Announcing the Top Rated Business Intelligence Tools for 2019
TrustRadius Top Rated
Today, we awarded the 2019 TrustRadius Top Rated badges for Business Intelligence (BI) Tools. The TrustRadius Top Rated awards are the most trusted in the industry because they are an unbiased reflection of customer sentiment, based solely on user feedback and satisfaction scores. Top Rated awards are the voice of the market and are not influenced by analyst opinion, the vendor’s company size, popularity, or status as a TrustRadius customer.
Business Intelligence (BI) Tools
Finding the right BI tool that meets all your business’ needs best can be a difficult task. Software buyers on TrustRadius use reviews written by BI tool end-users and product comparisons to help them make better informed purchasing decisions.
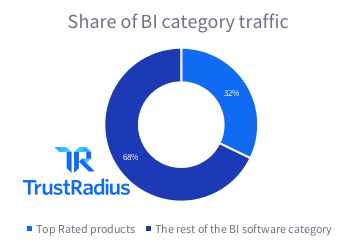
In the past quarter 39,900 professionals used TrustRadius to evaluate Business Intelligence (BI) tools—at least 9,600 of them were from enterprise companies with 1,000 or more employees. Visitors evaluating BI tools were most curious about comparing different products and reading product reviews —53% compared at least two products and 30% read reviews.
 Here are the winners:
SiSense
![]()
Sisense is a full-stack product with a columnar data store, an ETL layer and a set of front-end tools for constructing dashboards and visualizations. It has been designed for use by the non-technical user. Sisense has abandoned the familiar in-memory technology common to visualization tools for an “in-chip” solution which uses the data storage provided by the chip set, in addition to RAM and disk storage. This removes some of the speed limitations of traditional disk storage and has none of the size limitations of in-memory RAM solutions. Reviewers love the fact that SiSense is an all-in-one tool that can manage large amounts of data rapidly, produces powerful visualizations and is relatively easy-to-use but non-technical line-of-business staff.
“As of now the tool is used to display performance indicators and to help develop and maintain the performance-based budget…The biggest pro I found with Sisense is that you do not need a DBA in order to manage the system. This makes the learning curve really easy, which helps lots when thinking of implementation across a whole organization.”
– C-Level Executive, Management Consulting Company
[easy-tweet tweet=”The biggest pro I found with Sisense is that you do not need a DBA in order to manage the system.” user=”trustradius” template=”qlite”]
TIBCO Spotfire
![]()
TIBCO Spotfire is a data discovery and visualization tool capable of processing very large data volumes and includes a built-in predictive analytics runtime engine along with location analytics. Spotfire’s hybrid in-memory/in-database analytics architecture supports can easily scale to many users and limitless rows of data. The product is frequently used by analysts in data-intensive industries like retail, energy, life sciences and financial organizations. Reviewers highlight the powerful visualization capabilities, the ability of the product to handle very high data volumes, and built-in analytics.
“We use TIBCO Spotfire because of its advanced analytics capabilities combined with its broad data visualization offerings. Perhaps the most useful aspect of TIBCO Spotfire is the R Script interface, where we can use R scripts in Spotfire to create useful models and graphs.”
– Thomas Young, Senior Economist, Financial Services, 11-50 employees.
[easy-tweet tweet=”Perhaps the most useful aspect of TIBCO Spotfire is the R Script interface.” user=”trustradius” template=”qlite”]
Domo
![]()
Domo’s Business Cloud is a self-service business intelligence software designed to be used across the organization as a decentralized reporting and visualization platform. It can be used for data visualization, ad-hoc reporting and for building dashboards. A broad set of data connectors provide access to data wherever it resides. The product has a well-designed UI and is easy to use by non-specialists. According to reviewers, the product has an excellent user interface, strong visualizations, and many connectors to apps and other data sources.
“If done right, it can be one source of truth, uniting data from a lot of sources to paint a complete picture…When used for data visualization it is a pretty complete and full functioned, with the ability to cross all different types of data…and visualize them a lot of ways. Great suite of integration with anything you can imagine, and ability to pull in your own data a bunch of ways too.”
– Verified User, Product Management, Internet Company
[easy-tweet tweet=”Domo: Great suite of integration with anything you can imagine” user=”trustradius” template=”qlite”]
Microsoft Power BI
![]()
Microsoft Power BI cloud is a cloud visualization platform for dynamically visualizing real-time data, analyzing it, sharing insights, and making data-based business decisions. The platform enables users to do ad-hoc reporting and build business dashboards. It comes with pre-built dashboards and a large number of connections to popular business applications. Reviewers say that it is very easy to connect to databases or cloud apps, and that it’s easy to modify data sets and formatting in the product rather than in the source data. It’s also good value for money.
“Power BI is being used to build dashboards and reports…It allows us to have an insight into our business through the visual representation of our data…Power BI helps management make business decisions based on data (ex, whether to close or open branches based on customers in a region, launch refinancing campaign in regions where the mortgage to value rate is low, etc.).”
– Mathieu Gauouette, Senior BI Consultant, Banking Company
[easy-tweet tweet=”Power BI helps management make business decisions based on data” user=”trustradius” template=”qlite”]
Tableau Desktop/Server
![]()
Tableau Desktop is used to visualize and analyze data, create workbooks, visualizations, dashboards and stories, while Tableau Server allows users to publish workbooks so that they are available in a central location for viewing by others. Tableau Server users can interact with dashboards and visualizations on the server without any installation on their machines. Tableau has been designed primarily for the business user and has been very successful at serving that audience. The product was designed with business users in mind and has been remarkably successful at serving that audience. There are two separate editions of the platform: Personal and Professional. The difference between them is the number of database connections supported. Tableau has gradually added more enterprise-level features like data governance, and data preparation. Tableau users love being able to create powerful visualizations rapidly. In addition, reviewers frequently mention scalability and ease-of-use.
“Scalability of Tableau is amazing. We have thousands of users who interact with the Tableau reports on a daily basis without any major issues…Ease of use is another thing that is very good about Tableau. With a very less training, a user can start creating basic reports…Beautiful visualizations are the best part of Tableau.”
– Verified User, Information Technology Analyst, Computer Software Company
[easy-tweet tweet=”Beautiful visualizations are the best part of Tableau.” user=”trustradius” template=”qlite”]
Tableau Online
![]()
Tableau Online is the cloud version of Tableau Server. As for all SaaS products, the vendor maintains all hardware and system infrastructure outside the firewall. The product supports live connections to multiple data sources and allows for scheduled refreshes of published data. In addition to the standard benefits of the Tableau platform, reviewers mention the simplicity of using a cloud version which does not require any software installation or maintenance.
“No local maintenance. This is in comparison to Tableau Server which requires local installation and maintenance. Getting upgraded to the new version of Tableau Online is automatic.”
– Rolando Bernabe Tribo, Senior Data Engineer, Health and Fitness Company
[easy-tweet tweet=”Getting upgraded to the new version of Tableau Online is automatic.” user=”trustradius” template=”qlite”]
SAP Crystal
![]()
SAP Crystal is primarily a pixel-perfect reporting tool. It takes data from virtually any source and in any format and consolidates it before output as richly formatted reports. Reports and dashboards can be created with a minimum of coding. The product is designed and used primarily by small and medium-sized businesses. Reports can be published as Microsoft Word or Excel documents, or over the web. Web reporting allows a group to collaborate on updating and editing reports. Reviewers love the ability to pull data from many sources, the broad range of built-in functions, and the ease-of-use:
“I pull data in from Excel, text files, Access databases, and SQL databases, and Crystal can use all of those and many other data sources and pull them all into one report. It follows the relational database model, so the tables can be linked together on common fields, even when they are from different data sources. It allows you to make totals, running totals, charts, grand totals, and your own calculations. It has many built-in functions. I like the ease of use, and how you can get results pretty quickly, and yet it can handle large amounts of data.”
– Tom Fragale, Senior Consultant, IT and Services Company
[easy-tweet tweet=”SAP Crystal: I like the ease of use, and how you can get results pretty quickly” user=”trustradius” template=”qlite”]
Qlik Sense
![]()
Qlik Sense is a self-service visualization platform enabling data from multiple sources to be combined and analyzed in a single view. Qlik Sense features an “associative engine” that automatically figures out the logical relationships within data sets and color codes it accordingly. Qlik Sense also has storyboarding capabilities to allow data to tell a story. The platform runs on multiple devices including tablets and mobile devices. Reviewers love the intuitive user interface and the ability to ingest and process very large data sets.
“Qlik Sense helped in processing large data sets containing billions of rows across hundreds of rating factors. Qlik Sense did eventually empower the power users with self-service analytical capabilities… Intelligent association of disparate data sets providing early visibility of the connections in the underlying data.”
– Mohan Suswaram, Enterprise Data Architect, Utilities Company
[easy-tweet tweet=”Qlik Sense did eventually empower the power users with self-service analytical capabilities” user=”trustradius” template=”qlite”]
![]()
TIBCO Jaspersoft is a reporting and analytics tool with a well-designed modern user interface making the product relatively easy to use by end users. Jaspersoft has a reporting server, ad hoc query, in-memory analysis, dashboarding, a reports library, and ETL capabilities. It is often used in an OEM or embedded scenario where it is integrated as the reporting engine for business applications. Reviewers frequently mention the editing and formatting capabilities for pixel-perfect reports, the large number of connectors to other data sources, and the ease of embedding into web applications.
“The reports are exactly as they are designed in Jaspersoft Studio. It allows for pixel-perfect editing, so we can be sure the reports our customers get look great. We have a number of different data stores for our different products, and Jaspersoft has connectors for all of them. No matter where our data is, Jaspersoft allows us to access it easily, and transform it into a great looking report.”
– Verified User, Engineer, Transportation Company
[easy-tweet tweet=”No matter where our data is, Jaspersoft allows us to access it easily.” user=”trustradius” template=”qlite”]
Congratulations to the winners of the Top Rated Business Intelligence Tools Award!
Top Rated Criteria
Products included in the 2019 Top Rated Business Intelligence Tools list must have been in the top tier of their category TrustMap as of February 13th, 2019. To qualify for the Business Intelligence Tools Top Rated Award, products must have at least 10 reviews written within the past year, a TRScore of at least 7.5 out of 10, and must receive at least 1.5% of the traffic in their category. Every reviewer is verified and every review is vetted before publication. Products are plotted on the TrustMap based on end-user data, including users’ likelihood to recommend scores as well as buyer research patterns. To learn more about TrustMaps and Top Rated methodology, check out this page.
Was this helpful?