How to Analyze Survey Data: Methods and Best Practices
You’ve spent hours crafting smart, strategic, and unbiased survey questions. You’ve launched your survey, collected hundreds of responses, and now sit on a treasure trove of data.
It’s easy to spend 20 minutes looking at your survey results, pull out the most noteworthy statistic, and call it a day. But failing to rigorously analyze your survey results undermines your entire research project.
This article will not only make a case for why you should do in-depth survey analysis but will give you the tools and methods to do it well. If you’re still in the survey design part of your research project, read more about how to design successful surveys.
Why Survey Analysis Is Important
No matter how large or small your survey is, you can find hidden gems in the results if you dig deep enough. A cursory glance at your quantitative and qualitative data won’t do your research project justice.
Survey analysis can make the difference between an unhelpful statistic and a valuable business insight. For example, a simple net promoter score (NPS) survey can tell you how happy or unhappy your customers are.
But segmenting your NPS data by industry, company size, or even job title is much more revealing. It can show you which types of customers are the happiest and point to hypotheses about why.
Rigorous survey analysis is incredibly important outside of the business world too. A critical part of any academic research finding is that the results are reliable and replicable. Unexamined survey results lack depth and nuance. This makes them harder to replicate across populations. The more detailed and segmented your survey results are, the more robust they will be.
Survey Analysis Methods
There are many ways to analyze survey results. Which method you should use depends on what type of data you have. Qualitative survey data is typically in the form of open-text responses and produces unstructured data. Quantitative data can be expressed in numbers or counted in some way, producing structured response data.
| Qualitative | Quantitative | |
| Definition | Unstructured, typically text-based data that can’t be counted or expressed as a number. It usually expresses feelings, opinions, recounts experiences, etc. | Data that is numerical or can be counted. It’s usually expressed as either a continuous or discrete number or percentage |
| Types of data | Words, pictures, symbols, audio and video. | Continuous or discrete numerical data, data that can be counted and expressed as numbers. |
| Collection method | Open-response survey questions, interviews, focus groups, and ethnographies. | Structured interviews, close-ended survey questions, controlled experiments, natural experiments. |
| Best for | Collecting information about attributes, characteristics, or preferences. Ideal for doing discovery research and generating hypotheses. | Collecting structured information about outcomes and results. Ideal for validating hypotheses, and assessing causality and correlation. |
Watch this video to learn more about the differences between qualitative and quantitative and continuous and discrete data:
How to Measure Your Results
Start your survey analysis by examining the quantitative data you have. Compared with qualitative data, quantitative data typically takes less time to analyze. Since it’s already structured, this type of information can tell you things like which answer option was the most popular (had the highest percentage) among respondents.
Many survey platforms have built-in survey analytics capabilities, which you can use to get a high-level view of your findings. If you’re using a survey tool that doesn’t provide built-in survey analysis, you can export your results and do your analysis within a different tool.
After analyzing your quantitative data at a high level, start segmenting your data. Data segments are usually based on key demographic, firmographic, or characteristic information. This critical step is often forgotten. But it can produce some of the most valuable business insights and research findings.
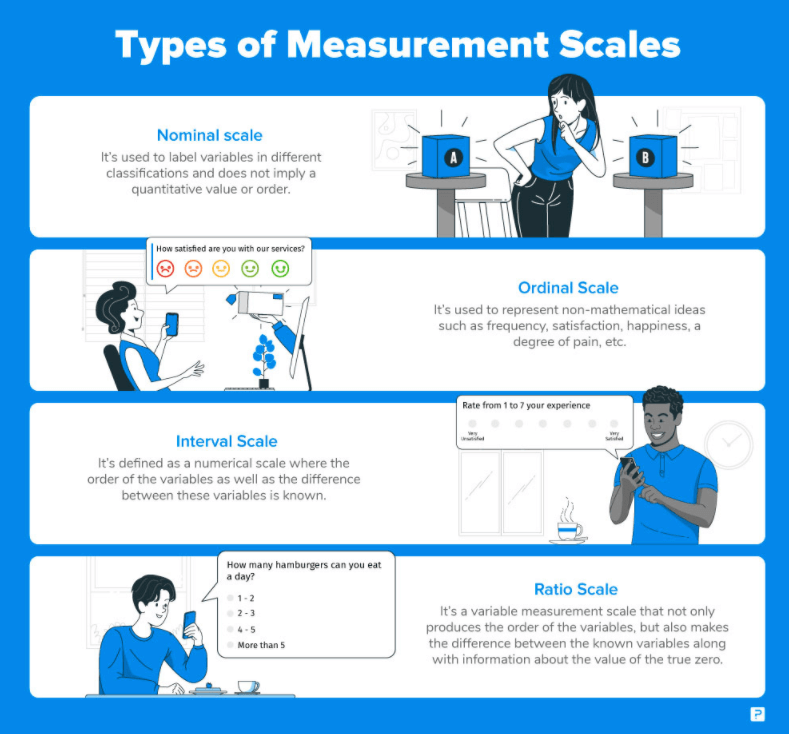
Quantitative and qualitative data can be represented on four key measurement scales:
- Interval
- Ratio
- Ordinal
- Nominal/categorical
Interval scales show what order values should be in and the difference between them. The difference between values is consistent throughout the scale. It’s also possible to have negative values on an interval scale. Interval scales do not need to have a true zero point on the scale. Examples of internal data include number-based grading, temperature in Celsius or Fahrenheit, or IQ test scores.
Ratio data is represented on a scale that shows the order and difference between values as well. But there is necessarily a zero point on ratio scales. Unlike interval data, it’s impossible to have negative values on a ratio scale, since there is a defined zero point.
Ordinal scales produce a type of ordered qualitative data. Different values have a label attached to them and there is a clear order between them. A 5-point agree/disagree scale is an example of an ordinal scale.
Nominal data, also called categorical data, is very similar to ordinal data. The main difference between the two is that there is no specific order or consistent value between labels on a nominal scale. A multiple-choice question that asks respondents to choose their favorite type of food would produce nominal data.
Quantitative Data
There are a few specific methods to use and caveats to be aware of when analyzing quantitative data.
At a basic level, there are two types of quantitative data: discrete and continuous. Discrete information can only have certain values, such as integers like 1,2,3,4, or 5. Continuous data points can take on any value within a given range. For example, any percentage point between 0 and 1, or any height between 3 and 8 feet tall.
Discrete data is easier to represent with bar and column charts than continuous data is. This is because there is a finite number of values that discrete data points can have. In contrast, scatter plots and line charts are better data visualizations to use for continuous data. Since continuous data points can be plotted anywhere along a spectrum, there are technically an infinite number of different values. Line charts are especially well-suited for representing continuous data over time.
Cross-Tabulating Data
When it comes to analyzing quantitative data, it’s almost always in your best interest to dig deeper into the data. One of the best ways to do this is by cross-tabulating your data. Cross-tabulation maps out the relationship between two, or sometimes three, different variables.
This allows you to identify important groups, or segments, within your response data. A business looking to better understand which segments of their customer base are the most or least satisfied might cross-tabulate customer satisfaction scores with company size or industry.
Correlation vs. Causation
Beware of confusing correlation for causation when analyzing quantitative data. Correlation simply means there is a linear relationship between two variables. In other words, they tend to increase or decrease, or be positive or negative, at the same time. Causation implies that variable A is the determining factor behind variable B. The burden of proof for causation is much higher than it is for correlation.
If you notice that your happiest customers tend to be from enterprise companies, they may not be happier because they’re from enterprises. Rather, they may be happier because they end up spending more money on your product, and therefore get a superior product experience. In many cases, there is a different moderating variable impacting the relationship between two highly correlated variables.
It’s tempting to attribute causation when there is really only correlation between two variables. But this can be dangerous. Acting on the assumption that variable A (e.g. ad spend) causes variable B (e.g. revenue growth) can lead to bad business decisions and wasted money.
Statistical Significance
One way to prove a causal relationship between two variables is by assessing statistical significance. I.e. estimating the probability that variable A causes variable B. There are multiple ways to test for statistical significance when you have a quantitative data set. Different tests and models for assessing statistical significance include:
- Calculating the pearson correlation coefficient (p-value)
- Paired and unpaired t-tests
- Chi-square test
- Regression analysis (linear, multiple linear, or logistic)
- ANOVA
Watch this video to learn more about different types of statistical significance tests and when to use them:
Qualitative Data
The biggest difference between analyzing quantitative and qualitative data is usually the amount of time required. As mentioned above, quantitative data is structured, which means there’s no prep work required to get it ready to analyze.
Qualitative data, on the other hand, is often unstructured. This is especially true if you have a bunch of open-text responses. Researchers typically need to manually code open-text responses in order to analyze them. Thus a large chunk of time is often spent just prepping qualitative survey results so they’re ready to be analyzed.
Some qualitative data may be semi-structured. If you’re dealing with ordinal or categorical data, then your responses might already have a label or identifier attached to them. Thus, you can group qualitative responses by these labels and save time on hand-coding individual responses.
If possible, use multiple choice or multi-select survey questions instead of open-text questions. Responses from open-text questions will always take longer to analyze. These types of responses also don’t lend themselves well to proving correlation or causation between two or more variables.
Unstructured open-response data is much better suited to collecting anecdotal evidence, finding quotes, and getting a general idea of your survey-takers’ sentiment towards a topic.
Survey Analysis Best Practices
Regardless of whether you’re working with quantitative or qualitative data (or a mix of the two), here are four essential best practices to keep in mind:
Pay attention to sample size
Sample size can have a large impact on how robust your survey findings are. It dictates whether or not you can make a claim about the data you collect and how generalizable your survey results are. This is especially true for quantitative data.
500 people saying they like your product’s new feature is a lot more powerful than 50 people saying they like your product’s new feature. Large sample sizes (e.g. n=1,000+) are typically needed to prove statistical significance as well.
However, large sample sizes aren’t always needed or required. This would be the case if your primary goal is to better understand the opinions and feelings of your customer base. You won’t need a large sample size to collect qualitative, anecdotal evidence. In this case, it’s much more important that you collect responses from the right type of people.
Segment Your Data
As mentioned above, segmenting your data often reveals important insights about your survey data. It’s easy to generalize a high-level finding across a population. But doing this doesn’t reveal the full truth.
Let’s say your company has an overall NPS score of 35. However, it may be either higher or lower among different groups of survey respondents. For example, it may be 22 among small businesses but 37 among enterprise customers. This produces a valuable and actionable business insight: that your smaller customers are less happy than your larger ones.
Benchmark your data
Always benchmark your data. You can do this by comparing your most recent data with previous data you’ve collected, comparing your data to the industry standard, or comparing it with similar research findings.
Looking at one dataset at one point in time doesn’t give you the information you need to put the data in context. It’s the comparative insights that show how relevant and valuable your survey results are.
An NPS score of 35 could either be a cause for celebration (if your previous score was 30) or a cause for concern (if your previous score was 40). Setting the right context for the data you share helps make it more easily understandable and actionable.
Present your findings
Don’t let your data sit on the shelf—especially not after investing time and energy doing rigorous survey analysis.
Creating an engaging and impactful research report or presentation is almost as important as the findings themselves. Especially in the business world, communicating your research findings in an effective way is critical. Even if your data is supremely consequential for the business, it has little value if it doesn’t inspire action or a shift in perspective.
Best Survey Analysis Tools
Understanding which survey analysis methods to use and why is a crucial first step. Step two is figuring out where and how to use them.
Many survey & forms building tools include survey analysis capabilities. For example, platforms like Qualtrics, SurveyMonkey, and SoGoSurvey offer a range of analysis features. They include the ability to calculate response percentages, create charts, and do trend analysis. All of these types of tools also allow users to download their results in Excel or csv file formats.
Spreadsheet software products like Microsoft Excel and Google Sheets are popular survey analysis tools. Excel has been a go-to survey analysis and visualization tool for a long time. Google Sheets is becoming a common alternative, especially if you’re collecting survey data via Google Forms.
Software programs like Microsoft BI, Tableau, R, or Stata are better equipped for doing more advanced statistical survey data analysis.
Visit TrustRadius’ survey & forms building category to learn more about different survey platforms.
Was this helpful?

Want to learn more about the first steps in survey creation? Learn how to design an effective, reliable survey here!