Best Web Analytics Tools For Enterprises 2022
Web analytics software empowers enterprises the data and analysis to meet the needs of their diverse consumers. By using the software for data collection and analysis, teams can find figure out the motivations behind user behavior. Organization can modernize their virtual platforms to achieve a better user experience. We go into some of the best web analytics software that are fantastically suited to major companies.
What is Web Analytics?
Website owners can use web analytics software for data collection and to map out and observe visitor behavior. Teams can perform analysis, make reports, and brainstorm with the data pulled form real-time customer behavior.
The website data is often used for meeting business goals as well as even updating a site’s search engine optimization (SEO). When you update your SEO you can help you increase your rankings with search engines and then become visible to your target audience.
When you upgrade your SEO, it can also help with your visibility and following on social media. By maximizing your virtual brand, you can pull in even more web traffic data.
Web analytics data is incredibly valuable for website performance. The key metrics or key performance indicators (KPIs) can be sued to statistically measure the progress of your business goals. Some common key metrics can be the number of visitors to landing pages, the bounce rate, and user retention.
The table below offers some examples of the features a website analytics platform can have. It includes key metrics and other areas of analysis tools that can optimize your site.
| Conversion Rate | Bounce Rate | Retention | Click-Through Rate (CTR) |
| The conversion rate is your total conversion divided by the number of website visitors. Conversion / # of visitors = conversion rate | The bounce rate is the percentage of users who leave after visiting a single page. Single-page sessions / total sessions = bounce rate | Visitor retention metrics are usually presented as a retention report that shows unique visitors who returned at least once. | The number of times your ad is clicked divided by the number of times your ad is seen (called an impression). Clicks/impressions = CTR |
| Average Time on Single Page | Referrals | Usability | A/B Testing |
| The amount of time all users spend on each web page is averaged. | Referral traffic comes from another site that had an outbound link to yours. | Ensuring your website functionality is fast and easy to navigate. | Tests two versions of a web page with users. |
All web analytics tools will offer a variety of different features. The next section discusses popular web analytics platforms’ enterprise plans and matching capabilities.
What Are The Best Website Analytics Tools?
Big companies need equally powerful tools that can collect and analyze massive amounts of data. Some of these tools with have testing capabilities like A/B testing and most will have key metrics like retention and bounce rate.
These web analytics solutions are definitely on the pricier side because most are designed for larger teams. Many will offer varied subscriptions so you can still consider your budget needs along with functionality.
Google Analytics
Special Note: Google Analytics free tool (aka Universal Analytics) is switching to Google Analytics 4 on July 1st, 2022. In this section, we’re just talking about Google Analytics and Google Analytics 360. This is because there aren’t too many users of the new version yet and the main difference is Google Analytics 4 is just a faster, better version with updated machine learning and smoother integrations. For more information about Google Analytics 4 go here.
When you do switch over that does mean some setup on your part. The instructions for Google Analytics 4 setup you can find here. There will be a new version of Google Analytics 360 as well but it’s not available right now. Anyone can switch to Google Analytics 4 early before July.
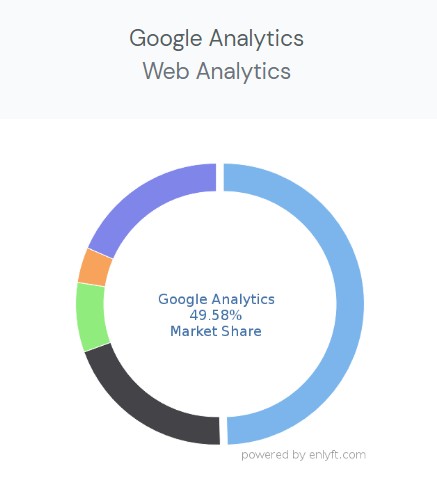
Google Analytics eclipse almost half of the entire web analytics market. They are reported to take up 49.58% of the industry. This isn’t that surprising when you think about how Google Analytics is standard practice for thousands of small businesses and massive companies.
The Google Analytics free subscription has great analytics features like real-time data reporting, attribution, funnel exploration, and easy integration with Google Ads.
| Google Analytics | Free | Google Analytics 360 |
| Cost | $0 | No upfront pricing*There is consistently reported pricing by other sources |
The Google Analytics 360 is the next subscription available. The plan offers more advanced analytics and cloud computing options like BigQuery Export, and dedicated experts. This is a much more powerful version of Google Analytics and it’s well suited for major enterprises. The problem is the matching cost is very steep.
Google Analytics 360 does not have upfront pricing but multiple sources report the same yearly cost of $150,000 for their starting plan. The majority of enterprises that use Google Analytics 360 make between 1 million and 50 million in revenue.
Larger teams can handle the cost but at the same time if you can achieve the same with other software why spend so much money when you don’t have to?
If you have research and developer teams then the addition of cloud computing with the web analytics software can be integral to creating original data sets and findings. If you don’t actually plan to work with the data and develop it then 360 isn’t a necessary jump.
Google Analytics 360 do report being very satisfied in terms of features and functionality. Some reported downsides were that it was limiting for enterprises and not enough user permissions as in Adobe Analytics. Others found the software to be very far from user-friendly and not easy to comprehend at all. The cost is also a very common negative as well.
We generally recommend 360 for companies that are in eCommcere or marketing with a flexible enough budget. The capabilities would be amazing for professional analytics, researchers but not for teams without those data skills. The UI and metrics are not as simple as in regular Google Analytics so you need to consider whether you team can handle it
For a quick overview of Google Analytics metrics see the beginner introduction below.
Adobe Analytics
Adobe Analytics in the Adobe Experience Cloud includes their own web analytics software for large teams and companies. This analytics solution unfortunately does not provide any upfront pricing. This does not stop Adobe Analytics from being one of the most popular options, especially with enterprises.
| Adobe Analytics from Adobe Experience Cloud |
| No upfront pricing |
Abode’s web analytics tool can offer teams amazingly intricate segmentation and predictive analytics. The tool offers more than just page view metrics and includes metrics that track web traffic sources, site content, and user engagement.
When it comes data collection and real-time data reporting Adobe uses machine learning algorithms. The analytics software has several core features. They include advanced segmentation with automated insights, traffic flow analysis with visualizations, and ad hoc analysis for personalizable data tables.
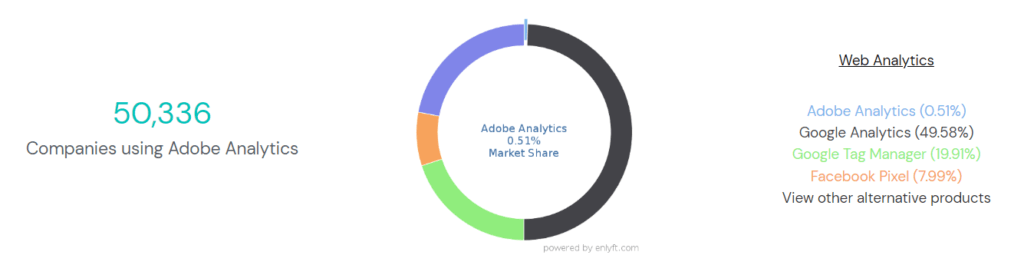
Adobe Analytics makes up only .51% of the web analytics market. This doesn’t mean thet don’t have a strong consumer base. Adobe Analytics has over 50,000 companies and is one of the most well known web analytics providers.
The best part about software reviews is the chance to gain insight into customer satisfaction. You can see reviews for the analytics product here.
The price of Adobe Analytics has been described as “not very budget-friendly.” Customers still report being satisfied with the software’s capabilities. The common issues you will see mentioned are with the UI and its learning curve. The training for the software has not been very helpful for customers.
In terms of usability, online training, and implementation, users weren’t too satisfied. One colorblind user noted that the UI had poor accessibility options. That same user actually gave Adobe Analytics a 10/10 rating for overall satisfaction. When it comes down to just features, users are extremely satisfied Adobe’s analysis capabilities.
Adobe Analytics is best suited for large companies. This is because of the advanced features and their high cost. Adobe’s customer segmentation alone is built with major brands in mind. Teams can monitor complex online platforms, launch massive marketing campaigns, and build their own custom data projects.
For a peak into what using Adobe Analytics is like see the tutorial below. It goes into detail on Adobe’s customer journey analytics.
KISSmetrics
KISSmetrics is another web analytics solution that is developed for optimizing customer experience. Similar to Adobe Analytics, they have more than just page view metrics.
Their customer journey data collection provides behavioral insights for fleshing out the different types of site visitors. You would be able to personalize user experience for your customer’s needs.
Teams can even access cohorts for unique visitors. They can then create visitor profiles for their most lucrative demographics. Those profiles can be the key to developing targeted ad campaigns.
KISSmetrics has upfront pricing for both their SaaS and eCommerce use cases. The subscriptions are almost identical, excluding small differences. We are only going to focus on the eCommerce plans and features.
All plans are billed annually, not monthly. All subscriptions limit the number of user seats, domains, populations and unique site visitors.
| KISSmetrics eCommerce Plans | Silver | Gold | Platinum |
| Cost | $299/month | $499/month | Custom plan |
For the Silver tier, team can work with 3 user seats, 1 domain, 10 different population cohorts, and up to 10K tracked users. The software tracks site users and builds real profiles around the actual people who came to your site. There is even a search function that allows your team to look for specific site visitors.
The plan includes different types of reports on user metrics. These include activity, conversion funnels, and paths. The visitor activity reports provide teams with information on customer trends. The funnel report offers conversion funnels and checkout funnels, and the paths report is a breakdown of the paths by channel and campaign.
Silver has up to 12-month data retention but doesn’t allow data exporting. The support offered in the plan is email access and they do not have onboarding resources.
The Silver subscription is not a good choice for large team. The more online presence you have to monitor the less the plan offers. It’s especially hard for multiple teams that would want to access the metrics because of the seat limit. This can be particularly frustrating because the cost of Silver is actually pretty steep and you wouldn’t expect it to only have 3 seats.
For the Gold plan it jumps to up to 25K tracked visitors, 10 seats, 3 domains, and 20 different populations. This is a better sample size for user data but 10 seats is not enough for large teams. There are more definitely more features.
The subscription even has A/B testing, revenue, and cohorts. Teams learn more in-depth detail about their customer base. The cost of the plan indicates it could be for a larger team, but with only 10 seats you can’t have too many analytics and developers using the testing data.
This plan also comes with 24 months of data retention and data export options (the data export options have undisclosed costs). The support is upgraded to email and chat and options. Teams are able to purchase onboarding resources. The subscription has good capabilities but it may not really be worth $500 a month even when you can afford it.
When it comes to Platinum, you can customize the price and features. It has everything in Silver and Gold but with some bonus features.
The plan has power and SQL reporting, as well as more advanced support options. The power report allows you to segment metrics into tables. Their SQL reports can show checkout cart metrics like abandonment rates. The upgraded support includes a dedicated account manager for consistent and reliable guidance.
Larger companies with a number of diverse demographics will want the flexibility Platinum can offer for tracked users and seats needed. The cost may not be upfront but it compared to all the limits associated with Silver and Gold, it would be a better deal to pay more for what you need.
Many teams also still use Google Analytics along with a paid enterprise software. You could easily do this with KISSmetrics. More teams would be able to acces metrics and specific teams would be able to use KISSmetrics to develop customer profiles for digital marketing projects.
For a look at how to use KISSmetrics see the demo video below.
HubSpot
HubSpot is one of the most well-known customer relationship management (CRM) platforms for digital marketing. Their internal marketing platform The Marketing Hub is especially useful for marketing strategies and campaign building.
The HubSpot Marketing Hub also has subscriptions that include metrics for website traffic analytics. The Hub also has a starter plan but it does not include the web analytics portion. The free subscription of HubSpot also does not have it.
We are focusing on what the subscription plans offer in terms of web analytics and not everything else they offer. For the full feature breakdown go here.
| HubSpot | Professional | Enterprise |
| Cost | $800/mo | $3,200/mo |
The Professional subscription has attribution, A/B testing for landing pages, custom reporting, and website traffic analytics. They are vague on the pricing page about what website traffic analytics actually includes.
HubSpot, fortunately, does have resources on how to use their web analytics. In their guide, they show you what you can track. You can see the sources of visitors and you can see session metrics like referrals. You can see traffic split by whether its from paid and organic search. You can also see things like a number of sessions, session length, and bounce rate. You can see for yourself by going here.
The Professional plan has all the basic web analytics metrics your team would need to track visitors. The Enterprise plan isn’t necessary if all you are looking for is web analytics because you get the same capabilities in Professional. There are the slight advantages like more advanced reporting in Enterprise. Choosing between them really comes down to how many marketing features you may want along with web analytics.
H3 Woopra
Woopra is customer journey focused web analytics platform. They have varied and affordable choices for enterprises with strong customer bases.
Each plan limits the amount of actions per month for each account. Actions are defined as all tracked events like pageviews, downloads, or customizations. They also limit the number of user seats for your team.
| Woopra | Core | Startup | Pro | Enterprise |
| Cost | $0 | $349 | $999 | Contact |
The Core plan is great for beginners or if your team wants a more in-depth experience before buying a more robust plan. In Core, you get 90-day data retention, 500K actions, and 10 user seats.
The main benefits of the plan are customer journey data on each user and over 30 available integrations allowed. The metrics include reports for trends, cohorts, etc. It also compiles profiles for users and audience segmentation.
This is a great starting plan for a small team but it won’t get a large team very far. The metrics are not advanced and the seat limit won’t work if you have more than one team using the software. The 500K limit on actions a month will also be hard in a team environment.
For the Startup subscription, you jump to 20 seats, 1 million actions a month, and 24-month data retention. With this plan, you get behavior segmentation, custom metrics, and dynamic customer journeys that are more specific about users.
This is definitely a better choice if you will have several teams using this data for website functionality, research, customer data, and marketing campaigns. Your teams will have more leeway to perform more actions in the software such as using the custom metrics for reports.
Pro is a subscription with a huge jump in cost. The reason for this is it comes with 50 seats, 5 million actions, and more advanced data options. With this plan, you can use custom data formulas, and advanced data importing.
If your business is particularly large and a lot of departments will need access to web analytics of your platform then 50 seats is ideal. The advanced data will be especially helpful to research teams for SEO, competition, marketing, product, etc.
When it comes to Enterprise you have over 50 million actions, and 50+ seats for massive teams. The plan has an account manager for support and custom objects for creating complex profiles on users or organizations.
This subscription is only ideal if you are a very large enterprise that expects to actually use well over 50 seats and over 50 million actions. The advanced metrics aren’t that different from Pro, so features wouldn’t be the best reason to switch.
For a quick look at how Woopra works see the intro below.
Mixpanel
Mixpanel is a web analytics platform designed for monitoring user behavior. You can increase interaction and long-term retention the type of user behavior insights the software offers. The platform gives teams reports and simplifies data.
Mixpanel’s UI is beginner-friendly and can help you create cohorts and funnels without knowing any SQL. This means you don’t need analysts that know code. It can be especially useful to startups with members that may be learning analysis skills on the fly.
Mixpanels’ subscriptions have no seat limits. This is awesome news for big teams that want fair and affordable pricing rather than being charged an arm and a leg for like 3 seats. The plan does have some lilits. The number of tracked users will change for each tier. Early-stage startups have the chance to apply for a free version of Growth for one year. Team can learn more here.
| Mixpanel | Free | Growth | Enterprise |
| Cost | $0 | Starting at $25/mo | Contact Sales |
The Free tier has unlimited data history, core reports, and data monitoring with alerts. They collect data for a whopping 100K users a month. Most free plans do not have this high a sample size for a freemium version. In fact, if you looked at KISSmetrics on the list, they charge quite a bit for less tracked users.
Mixpanel’s Free tier isn’t the best choice for big companies. The subscription does not have any advanced analysis like segmentation. Your access to data modeling, and exporting is limited, and you get only 5 saved reports per team member. There isn’t much for admin controls and there’s no compliance options (HIPAA), or support apart from the community.
Interestingly, Free could still be a good choice for Enterprises that used it in tandem with another software. Then you could save money if the software you chose for complex analytics had seat or usage limits.
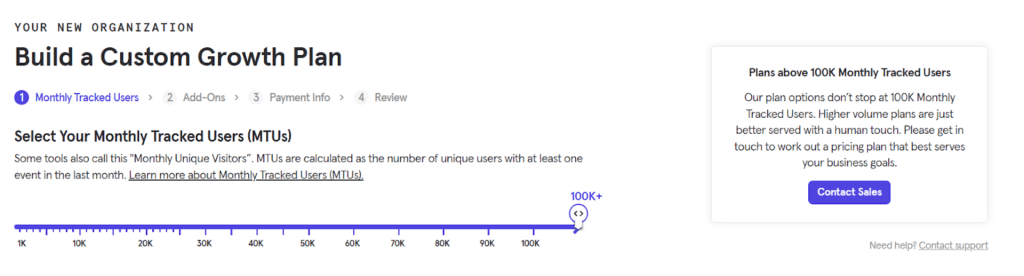
Next up is Growth, which give you the option to customize the number of monthly tracked visitors. This means that even though $25 a month is the starting price, you could end up paying much more. Big teams might consider a customizable plan like this but it’s important to look at their calculator first.
The tricky part is if you want capacity for over 100K visitors you need to contact sales.
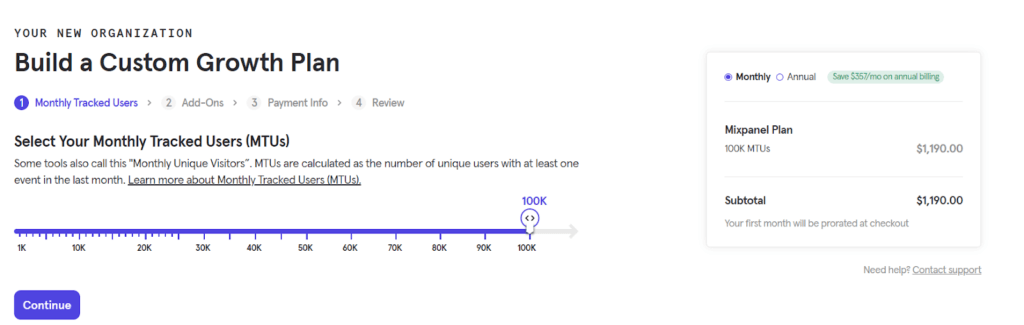
If you want up to 100K, you pay $1,190.00 a month.
In comparison to Growth, the Free plan looks way better. It has 100K built-in and no seat limits. The Growth plan does have more features than Free which explains the jump in cost. Growth includes data modeling, unlimited saved reports, and data exporting. It also has extra protection with data including HIPAA compliance. HIPAA compliance is a great benefit over free.
Growth has some admin controls but cannot control viewing and querying. The plan allows email support during business hours. The Growth tier comes with some advanced analytics like allowing users to be able to draw relationships and segment users. Teams won’t be able to experiment with the data or signal special actions to monitor.
The question you need to consider is do you need limited metrics collected from 100K users or do you need extensive metrics for 100K or less? Growth can be worth it if your budget is big enough that over 1,000 a month isn’t an issue. Companies that don’t want to spend that much money can always use Free with another free tool to fill in analytics gaps.
When it comes to Enterprise, you can customize everything. This can mean that the cost will be well into the thousands especially after you saw how much Growth can become. Enterprise does have real benefits. It includes full analytics, admin controls, and support. Teams can also include add-ons like live chat for support.
Enterprise is great for companies that need to track well over 100K users and want the features that can allow their team the best ease of use for research, marketing, and testing.
For an overview of what it’s like to use Mixpanel see the demo below.
Which Web Analytics Product Is The Best?
Here we compare the main differences and highlights about each product. This way you can think about the bigger pictures instead of getting caught up in the small details between each platform.
| Software comparisons | Google Analytics/ Google Analytics 360 | KISSmetrics | HubSpot |
| Adobe Analytics | Google Analytics is reported to be easier to use than Adobe Analytics but Google Analytics is reported to be less intuitive than Adobe Analytics. Google Analytics 360 and Adobe Analytics are equally powerful software but Adobe aims to offer more automation and simpler metrics. | Adobe Analytics offers less upfront information than KISSmetrics. Both platforms offer the same metrics and are customer journey-focused. KISSmetrics can be hefty in cost but Adobe Analytics has also been reported to be costly as well. | HubSpot and Adobe Analytics both come from platforms stacked with marketing and customer experience services. HubSpot’s marketing platform offers web analytics and a plethora of marketing tools. Adobe Analytics is part of their experience cloud which also has a wide array of customer experience tools. |
| Mixpanel | Mixpanel and Google Analytics both have free versions. With Google you don’t own your data while Mixpanels Growth plan and up offer HIPAA compliance. Mixpanel can become very expensive even though the starting cost is low. Google Analytics 360 is also reported to be very costly. | Mixpanel has no seat limits while KISSmetrics does. KISSmetrics focused on customer behavior and Mixpanel is also behavior-focused. They both limit the number of tracked users but Mixpanel offers thousands more for each plan. KISSmetrics plan cost are more clear while Mixpanel’s cost are customizable and can be very pricey. | Mixpanel and HubSpot both collect key metrics on-site visitors. HubSpot has an advantage by offering other marketing tools along with web analytics like email marketing and chatbots. Mixpanel has more complex data options with web analytics like data modeling whereas HubSpot mainly offers basic key metrics. |
| Woopra | Woopra and Google Analytics both have free versions. Woopra is more customer-focused. Woopra works to build data on unique users for deeper insight into trends and customer base. Google Analytics is deal for simple metrics. Google Analytics 360 has powerful metrics but they’re not consumer-focused. | Woopra and KISSmetrics are both laser-focused on the customer journey. Woopra has more complex and specified metrics. Both limit the number of users but Woopra offers more users per plan and has a freemium plan. KISSmetrics has cheaper plans than Woopra. | HubSpot and Whoopra both have ley metrics and free tools on their platform but HubSpot has no free web analytics. Woopra also has more detailed metrics for the customer journey. HubSpot has great features for marketing and outreach for your customer base. |
If you’re looking for more insight into web analytics platforms see the extra resources below.
More Resources
If you want to see more website analysis tools we have a couple of different lists of software available. We offer related software under the categories of web analytics, digital analytics, conversion rate optimization, and eCommerce analytics.
We also recommend these articles for those that to know more about web analytics. HubSpot’s blog has an awesome beginner introduction to web analytics and TechTarget is perfect for more in-depth learning. Clean.io’s blog goes into some major eCommerce benefits.
If you are in the latter stages of your web analytics purchasing decision, you may want a broader overview of web analytics pricing. Click the button below for a full breakdown of popular options!
For those that have used any of the platforms discussed here please leave a review to help other buyers make informed decisions.
Was this helpful?

Looking for your next Web Analytics tool? Click here to read REAL reviews from users like you!