9 Spokes vs. Flexmonster Pivot Table & Charts Component

Overview
ProductRatingMost Used ByProduct SummaryStarting Price
9 Spokes
Score 10.0 out of 10
N/A
9 Spokes is a smart dashboard that is designed to help companies see their business more clearly. Key metrics across essential areas of the user’s business are displayed in one place, revealing exactly how it's performing. The vendor’s value proposition is that 9 Spokes makes it easier for companies to make the right calls to manage or grow their business. According to the vendor, key benefits for SMEs include: One smart dashboard for your cloud business apps…N/A
Flexmonster Pivot Table & Charts Component
Score 10.0 out of 10
Mid-Size Companies (51-1,000 employees)
Flexmonster Pivot Table & Charts is a component for interactive pivot reports that can be inserted into a web page or a web application. It’s a JavaScript tool that enables a user to visualize their business data. This solution supports Microsoft Analysis Services OLAP cubes, Mondrian, icCube, JSON, SQL (MS SQL, MySQL and others) databases or static JSON or CSV files. According to the vendor, this solution allows users to work extremely quickly with really large data…
$0
Annual SaaS Subscription
Pricing
9 SpokesFlexmonster Pivot Table & Charts Component
Editions & Modules
No answers on this topic
Pivot Table for SQL/CSV/JSON Unlimited
$0
Annual SaaS Subscription
Pivot Table for Pentaho Mondrian
$0
Annual SaaS Subscription
Pivot Table for MS Analysis Services
$0
Annual SaaS Subscription
Pivot Table for SQL/CSV/JSON Basic
$299
Annual subscription
Pivot Table for Pentaho Mondrian
$799
Annual subscription
Pivot Table for SQL/CSV/JSON Unlimited
$799
Annual subscription
Pivot Table for MS Analysis Services
$799
Annual subscription
Offerings
Pricing Offerings
9 SpokesFlexmonster Pivot Table & Charts Component
Free Trial
YesYes
Free/Freemium Version
YesNo
Premium Consulting/Integration Services
NoYes
Entry-level Setup FeeNo setup feeNo setup fee
Additional Details9 Spokes is free to use - that’s joining, using the smart dashboard and connecting your apps to it. You'll only pay for any new apps you decide to purchase, but you can trial most of the app recommendations for free! If you want to purchase an app, we'll direct you to the app's website so you can sign up with them. If you sign up to a plan, you'll pay the apps directly and then you can connect the app to your dashboard.
More Pricing Information
Community Pulse
9 SpokesFlexmonster Pivot Table & Charts Component
Top Pros
Top Cons
Features
9 SpokesFlexmonster Pivot Table & Charts Component
BI Standard Reporting
Comparison of BI Standard Reporting features of Product A and Product B
9 Spokes
9.0
1 Ratings
9% above category average
Flexmonster Pivot Table & Charts Component
10.0
1 Ratings
20% above category average
Customizable dashboards9.01 Ratings00 Ratings
Report Formatting Templates00 Ratings10.01 Ratings
Ad-hoc Reporting
Comparison of Ad-hoc Reporting features of Product A and Product B
9 Spokes
7.0
1 Ratings
15% below category average
Flexmonster Pivot Table & Charts Component
9.5
1 Ratings
16% above category average
Drill-down analysis7.01 Ratings00 Ratings
Formatting capabilities00 Ratings9.01 Ratings
Report sharing and collaboration00 Ratings10.01 Ratings
Data Discovery and Visualization
Comparison of Data Discovery and Visualization features of Product A and Product B
9 Spokes
10.0
1 Ratings
21% above category average
Flexmonster Pivot Table & Charts Component
-
Ratings
Pre-built visualization formats (heatmaps, scatter plots etc.)10.01 Ratings00 Ratings
Access Control and Security
Comparison of Access Control and Security features of Product A and Product B
9 Spokes
9.0
1 Ratings
5% above category average
Flexmonster Pivot Table & Charts Component
-
Ratings
Multi-User Support (named login)9.01 Ratings00 Ratings
Mobile Capabilities
Comparison of Mobile Capabilities features of Product A and Product B
9 Spokes
8.0
1 Ratings
0% above category average
Flexmonster Pivot Table & Charts Component
10.0
1 Ratings
23% above category average
Responsive Design for Web Access6.01 Ratings10.01 Ratings
Dashboard / Report / Visualization Interactivity on Mobile10.01 Ratings00 Ratings
Report Output and Scheduling
Comparison of Report Output and Scheduling features of Product A and Product B
9 Spokes
-
Ratings
Flexmonster Pivot Table & Charts Component
10.0
1 Ratings
18% above category average
Publish to PDF00 Ratings10.01 Ratings
Best Alternatives
9 SpokesFlexmonster Pivot Table & Charts Component
Small Businesses
BrightGauge
BrightGauge
Score 8.9 out of 10
BrightGauge
BrightGauge
Score 8.9 out of 10
Medium-sized Companies
Reveal
Reveal
Score 9.9 out of 10
Reveal
Reveal
Score 9.9 out of 10
Enterprises
Jaspersoft Community Edition
Score 9.7 out of 10
Jaspersoft Community Edition
Score 9.7 out of 10
All AlternativesView all alternativesView all alternatives
User Ratings
9 SpokesFlexmonster Pivot Table & Charts Component
Likelihood to Recommend
7.0
(1 ratings)
10.0
(1 ratings)
Usability
-
(0 ratings)
9.0
(1 ratings)
Support Rating
5.0
(1 ratings)
10.0
(1 ratings)
User Testimonials
9 SpokesFlexmonster Pivot Table & Charts Component
Likelihood to Recommend
9 Spokes International Limited
Good for letting your investors, employees and others know at a glance how your company is doing. The interface is clean and organized well. I just wish more of the app's functionality was available for testing and implementation. "Coming soon" is not really encouraging when we already have been waiting for a year or more.
Read full review
Flexmonster
Fantastic product to embed in any SaaS solution for reporting and data exports. Excellent performance, ability to customize fields and tons of other features out of the box that makes it a well-rounded tool that is easy to use. To top it off their support is amazing for answering technical questions quickly and they provide great examples to learn how to interact with the code. We are very happy with our choice to use Flexmonster!
Read full review
Pros
9 Spokes International Limited
  • Grouping several apps in one place for easy viewing.
  • Clean dashboard interface that looks uncluttered when viewing several apps at once.
  • Setting up the apps is a breeze when the platform supports them.
Read full review
Flexmonster
No answers on this topic
Cons
9 Spokes International Limited
  • Integration with apps that are listed. Some of them are not supported yet and it seems the wait is taking longer than I'd like.
  • iPhone support. It would be nice to have this in the app store. Not available as of 04/25/2018.
Read full review
Flexmonster
No answers on this topic
Usability
9 Spokes International Limited
No answers on this topic
Flexmonster
Checks all the boxes! Easy to use, great out of the box feature set and fantastic support team
Read full review
Support Rating
9 Spokes International Limited
Support was helpful in the beginning but no longer needed because I didn't use the software as much. The experience that I did have with support was very friendly but not enough to give a good review. If the support team was called for initial setup, video chat or messenger app was used.
Read full review
Flexmonster
Quick response to questions and feedback, excellent documentation for learning about the product and tons of examples to leverage.
Read full review
Alternatives Considered
9 Spokes International Limited
I actually chose QuickBooks (currently using) and Method (used for a month) before deciding that 9 Spokes is just good for looking at a few apps in one place. I'll keep checking back with them to see if they have improved. I wouldn't be surprised if 9 Spokes improves their product within the next 6-12 months.
Read full review
Flexmonster
No answers on this topic
ScreenShots

9 Spokes Screenshots

Screenshot of Screenshot of Screenshot of

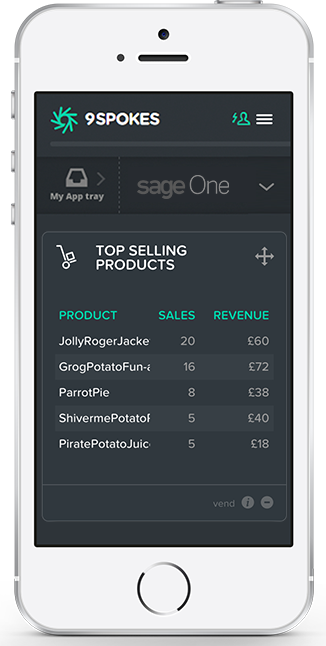
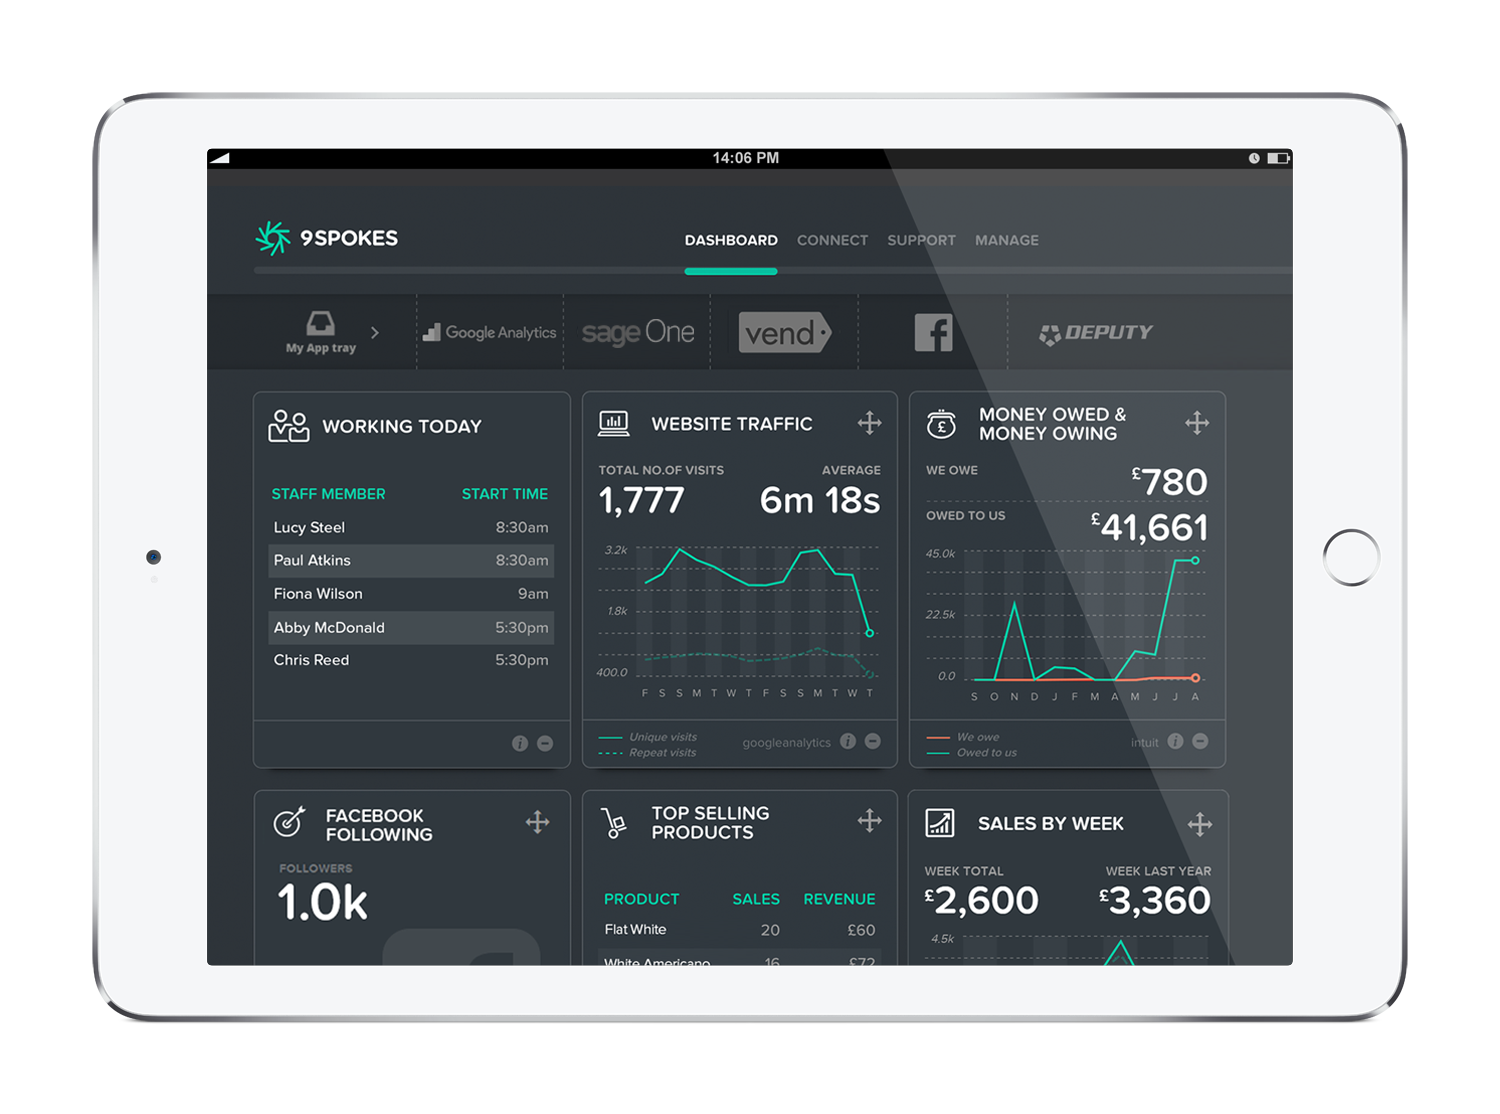
Flexmonster Pivot Table & Charts Component Screenshots

Screenshot of Pivot Component supports the printing of the Pivot view. Additionally users can export the reports into a variety of formats.Screenshot of Pivot Table Component helps you to create interactive pivot tables and charts reports for web and Flex applications. Pivot Component will provide your customers with an extremely intuitive end-user experience while creating and analyzing reports.Screenshot of Pivot Charts provide an alternative, interactive way to visualize data.Screenshot of The component will connect to any database: MS SQL, MySQL, Oracle, PostgreSQL - using simple script generating CSV output to enable real-time business analysis. Pivot Component is full browser-side component, thus you can use any desired server-side to generate CSV data.Screenshot of Pivot Table Component can connect to OLAP cubes via XMLA protocol. XMLA is XML for Analysis - an industry standard for data access in analytical systems, such as OLAP and Data Mining.Screenshot of Start mobile business reporting with the Flexmonster mobile application. It can be downloaded to your tablets from Google Play or Apple App Store.