iCharts vs. OpenText Magellan

Overview
ProductRatingMost Used ByProduct SummaryStarting Price
iCharts
Score 8.0 out of 10
Mid-Size Companies (51-1,000 employees)
iCharts is a Business Intelligence and Analytics solution for NetSuite. With this solution, users can transform their NetSuite data into interactive, real-time analytics without leaving their NetSuite dashboard. iCharts includes drag-and-drop chart creation and best-practice templates. The vendor’s value proposition is that iCharts accelerates an organization’s analytics strategy by empowering their team with the critical data-driven tools they need.
$10,000
per installation
OpenText Magellan
Score 9.0 out of 10
N/A
OpenText Magellan Analytics Suite leverages a comprehensive set of data analytics software to identify patterns, relationships and trends through data visualizations and interactive dashboards.N/A
Pricing
iChartsOpenText Magellan
Editions & Modules
Professional
$10,000
per installation
Business
15,000
per installation
Elite
$25,000
per installation
No answers on this topic
Offerings
Pricing Offerings
iChartsOpenText Magellan
Free Trial
YesNo
Free/Freemium Version
NoNo
Premium Consulting/Integration Services
YesNo
Entry-level Setup Fee$3,000 per installationNo setup fee
Additional DetailsBased on number of NetSuite licenses—
More Pricing Information
Community Pulse
iChartsOpenText Magellan
Top Pros
Top Cons
Features
iChartsOpenText Magellan
BI Standard Reporting
Comparison of BI Standard Reporting features of Product A and Product B
iCharts
9.0
2 Ratings
9% above category average
OpenText Magellan
7.0
2 Ratings
16% below category average
Customizable dashboards10.02 Ratings7.02 Ratings
Report Formatting Templates8.01 Ratings7.01 Ratings
Ad-hoc Reporting
Comparison of Ad-hoc Reporting features of Product A and Product B
iCharts
9.0
2 Ratings
10% above category average
OpenText Magellan
8.3
3 Ratings
2% above category average
Drill-down analysis9.02 Ratings8.03 Ratings
Report sharing and collaboration9.02 Ratings8.02 Ratings
Formatting capabilities00 Ratings8.03 Ratings
Integration with R or other statistical packages00 Ratings9.01 Ratings
Report Output and Scheduling
Comparison of Report Output and Scheduling features of Product A and Product B
iCharts
10.0
1 Ratings
18% above category average
OpenText Magellan
8.3
2 Ratings
1% below category average
Publish to Web10.01 Ratings8.02 Ratings
Publish to PDF00 Ratings8.02 Ratings
Report Versioning00 Ratings9.02 Ratings
Report Delivery Scheduling00 Ratings8.02 Ratings
Data Discovery and Visualization
Comparison of Data Discovery and Visualization features of Product A and Product B
iCharts
8.0
1 Ratings
1% below category average
OpenText Magellan
8.0
1 Ratings
1% below category average
Pre-built visualization formats (heatmaps, scatter plots etc.)8.01 Ratings9.01 Ratings
Predictive Analytics00 Ratings7.01 Ratings
Access Control and Security
Comparison of Access Control and Security features of Product A and Product B
iCharts
8.7
2 Ratings
1% above category average
OpenText Magellan
9.0
2 Ratings
5% above category average
Multi-User Support (named login)9.02 Ratings00 Ratings
Role-Based Security Model8.02 Ratings9.02 Ratings
Multiple Access Permission Levels (Create, Read, Delete)9.02 Ratings9.02 Ratings
Single Sign-On (SSO)00 Ratings9.02 Ratings
Mobile Capabilities
Comparison of Mobile Capabilities features of Product A and Product B
iCharts
10.0
2 Ratings
22% above category average
OpenText Magellan
7.0
2 Ratings
13% below category average
Responsive Design for Web Access10.01 Ratings7.02 Ratings
Dashboard / Report / Visualization Interactivity on Mobile10.02 Ratings7.02 Ratings
Application Program Interfaces (APIs) / Embedding
Comparison of Application Program Interfaces (APIs) / Embedding features of Product A and Product B
iCharts
-
Ratings
OpenText Magellan
6.2
1 Ratings
24% below category average
REST API00 Ratings5.01 Ratings
Javascript API00 Ratings9.01 Ratings
Java API00 Ratings5.01 Ratings
Themeable User Interface (UI)00 Ratings7.01 Ratings
Customizable Platform (Open Source)00 Ratings5.01 Ratings
Best Alternatives
iChartsOpenText Magellan
Small Businesses
BrightGauge
BrightGauge
Score 8.9 out of 10
BrightGauge
BrightGauge
Score 8.9 out of 10
Medium-sized Companies
Reveal
Reveal
Score 9.9 out of 10
Reveal
Reveal
Score 9.9 out of 10
Enterprises
Jaspersoft Community Edition
Score 9.7 out of 10
Jaspersoft Community Edition
Score 9.7 out of 10
All AlternativesView all alternativesView all alternatives
User Ratings
iChartsOpenText Magellan
Likelihood to Recommend
8.0
(2 ratings)
9.0
(11 ratings)
Likelihood to Renew
-
(0 ratings)
3.9
(9 ratings)
Usability
-
(0 ratings)
9.0
(1 ratings)
Support Rating
-
(0 ratings)
9.0
(2 ratings)
User Testimonials
iChartsOpenText Magellan
Likelihood to Recommend
iCharts, Inc.
The iCharts has suited our organization work as it has helped us a lot in our internal and external works. As we use iCharts for the internal team in representing the working reports and data of the business in an accurate manner. It helps in representing the presentation to the client to showcase our work and present him the data and work flow through the iCharts. As I don't found anything missing in this software.
Read full review
OpenText
If you do not have a large budget and are a large organization, I would steer clear of Actuate. If you are looking to do very complex washboarding, I would not use them. Your developers have to be very skilled to work with this. Plan to bring in consultants if necessary to help your process. Adhoc reporting is weak. If your pricing is user based and you expand, this could be very expensive.
Read full review
Pros
iCharts, Inc.
  • Their new platform is easy to navigate
  • We had a dedicated support person to help set up searches and train in the use of iCharts
  • Separate Dashboards for each group
Read full review
OpenText
  • The report outputs can vary across different types such as HTML, PDF, and Excel
  • Their open source offering is very sufficient
  • There are great boards and blogs for developers and engineers to expand and use their features.
  • The people from the company that I've worked with are professional and courteous.
Read full review
Cons
iCharts, Inc.
  • The new platform has limitations on colors and sizing
  • iCharts seem to have closed its doors without notification and now we have a product with no support
Read full review
OpenText
  • The documentation on all the available features, but most importantly on the scripting side, can be improved
  • The standard look & feel of some basic options, like parameter selection or sorting and filtering, looks dated and can't be customized
  • The server portal needs to provide better tools
  • More integration is needed with other OpenText products
Read full review
Likelihood to Renew
iCharts, Inc.
No answers on this topic
OpenText
I am no longer working for the company that was using Actuate but I believe they would continue to use it because the stitching costs would be to high. It would require a complete rewrite of the reports and the never version of Actuate (BIRT) even required an almost complete report rewrite
Read full review
Usability
iCharts, Inc.
No answers on this topic
OpenText
It is quite intuitive to use. It is fit specifically for doing sentiment, emotion, and intention analysis as well as text classification and text summarization. I would have given 10 if it is fit for the purpose of doing image processing and analysis as well. There is a huge market to analyze video and image data.
Read full review
Support Rating
iCharts, Inc.
No answers on this topic
OpenText
Always there on the front and backend for us and the client.
Read full review
Alternatives Considered
iCharts, Inc.
I haven't experience any other alternative product of this.
Read full review
OpenText
It is vastly superior to these in many ways, for complex reporting it is a much more sophisticated solution. Visualizations are very good. Javascript extensibility is very powerful, others don't support this or as well. Pentaho and MS are both OLAP oriented. Pentaho is moving more toward big data, which was not our primary focus. Others are stuck in the Crystal Reports Band metaphor.
Read full review
Return on Investment
iCharts, Inc.
No answers on this topic
OpenText
  • Actuate can handle 50 to 60 sub reports inside a report very well.
  • Dynamically creating the datasource, chart, graph, reports are the main advantages. We can do any level of drilling, and can create a performance matrix dashboard efficiently.
Read full review
ScreenShots

iCharts Screenshots

Screenshot of Screenshot of

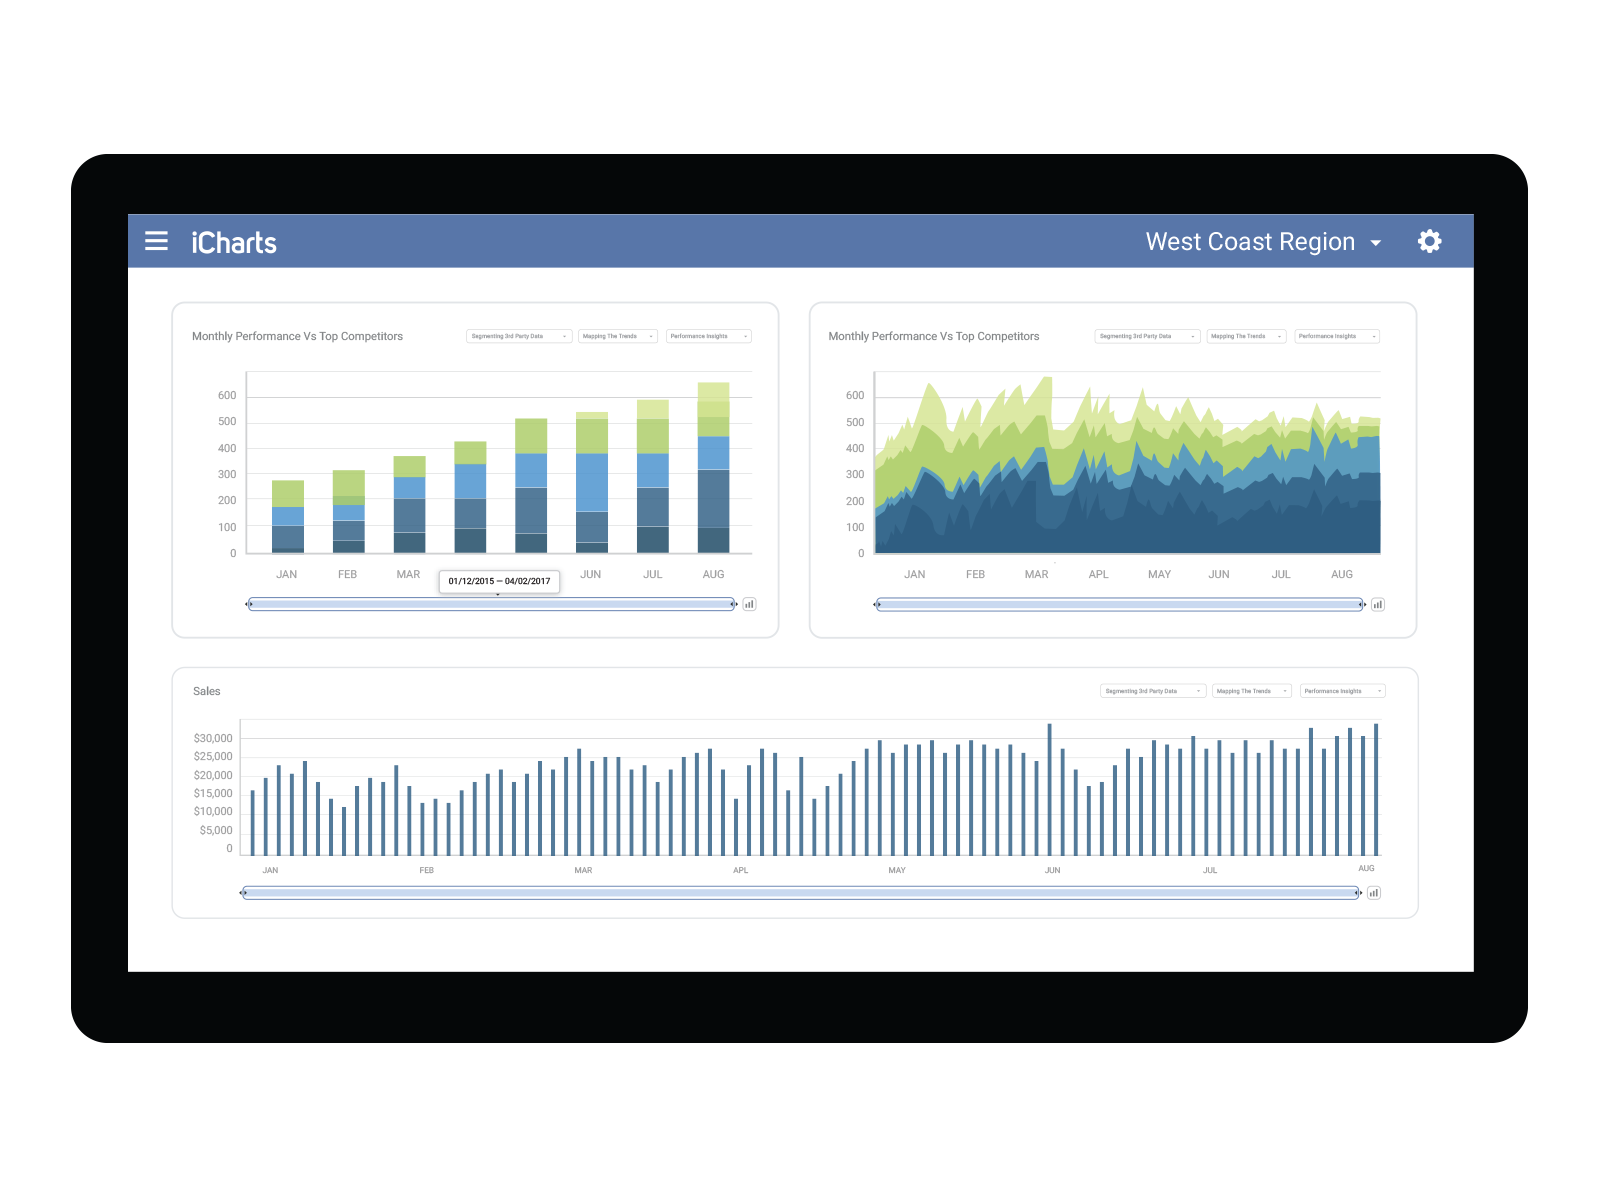
OpenText Magellan Screenshots

Screenshot of A Magellan BI & Reporting dashboard that an individual can interact with and personalize to their needs, such as changing chart types or computations.Screenshot of Magellan Data Discovery provides a Smart User Interface, designed to equip new users and users seeking a more streamlined set of features for insightsScreenshot of Magellan Data Discovery provides an Advanced User Interface that allows data analytics pros to leverage its breadth of sophisticated capabilities for insightsScreenshot of Magellan Text Mining insights can be displayed within easy-to-use dashboards.Screenshot of Data scientists can create visualizations within the Magellan Notebook and see it dynamically update as they write changes to it.