AppNeta vs. Splunk Application Performance Monitoring (APM)
AppNeta vs. Splunk Application Performance Monitoring (APM)
| Product | Rating | Most Used By | Product Summary | Starting Price |
|---|---|---|---|---|
 AppNeta | Enterprise companies (1,001+ employees) | AppNeta provides performance monitoring solutions for distributed, cloud-connected, digital enterprises. AppNeta’s SaaS-based solutions give IT teams application and network performance data, allowing them to constantly monitor user experience across any application, network, data center or cloud. | N/A | |
 Splunk Application Performance Monitoring (APM) | N/A | Splunk APM is an application performance monitor that uses AI to drive troubleshooting of issues that arise within applications. | $55 per month |
| AppNeta | Splunk Application Performance Monitoring (APM) | |||||||||||||||
|---|---|---|---|---|---|---|---|---|---|---|---|---|---|---|---|---|
| Editions & Modules | No answers on this topic |
| ||||||||||||||
| Offerings |
| |||||||||||||||
| Entry-level Setup Fee | No setup fee | No setup fee | ||||||||||||||
| Additional Details | — | Splunk APM offers Host-based Pricing or Usage-based Pricing, billed annually. Significant Volume Discounts offered. | ||||||||||||||
| More Pricing Information | ||||||||||||||||
| AppNeta | Splunk Application Performance Monitoring (APM) | |
|---|---|---|
| Top Pros | No answers on this topic | |
| Top Cons |
| No answers on this topic |
| AppNeta | Splunk Application Performance Monitoring (APM) | |||||||||||||||
|---|---|---|---|---|---|---|---|---|---|---|---|---|---|---|---|---|
| Application Performance Management |
|
| AppNeta | Splunk Application Performance Monitoring (APM) | |
|---|---|---|
| Small Businesses |  SolarWinds Pingdom Score 7.7 out of 10 |  GitLab Score 8.9 out of 10 |
| Medium-sized Companies |  ThousandEyes Score 9.0 out of 10 |  ManageEngine Site24x7 Score 9.2 out of 10 |
| Enterprises |  Nexthink Score 9.1 out of 10 | ManageEngine Site24x7 Score 9.2 out of 10 |
| All Alternatives | View all alternatives | View all alternatives |
| AppNeta | Splunk Application Performance Monitoring (APM) | |
|---|---|---|
| Likelihood to Recommend | 6.0 (2 ratings) | 8.1 (9 ratings) |
| Usability | - (0 ratings) | 8.0 (9 ratings) |
| Support Rating | 5.0 (1 ratings) | - (0 ratings) |
| AppNeta | Splunk Application Performance Monitoring (APM) | |
|---|---|---|
| Likelihood to Recommend |  Broadcom
| Splunk
|
| Pros | Broadcom
 Richard Phung Sr. Windows Administrator | Splunk
 John Abraham Director of Information Systems - ACOM |
| Cons | Broadcom
| Splunk
|
| Usability | Broadcom No answers on this topic | Splunk
|
| Support Rating | Broadcom
| Splunk No answers on this topic |
| Alternatives Considered | Broadcom
Richard Phung Sr. Windows Administrator | Splunk
 Kilhyun Ryu 상무(본부장) |
| Return on Investment | Broadcom
| Splunk
|
| ScreenShots | AppNeta Screenshots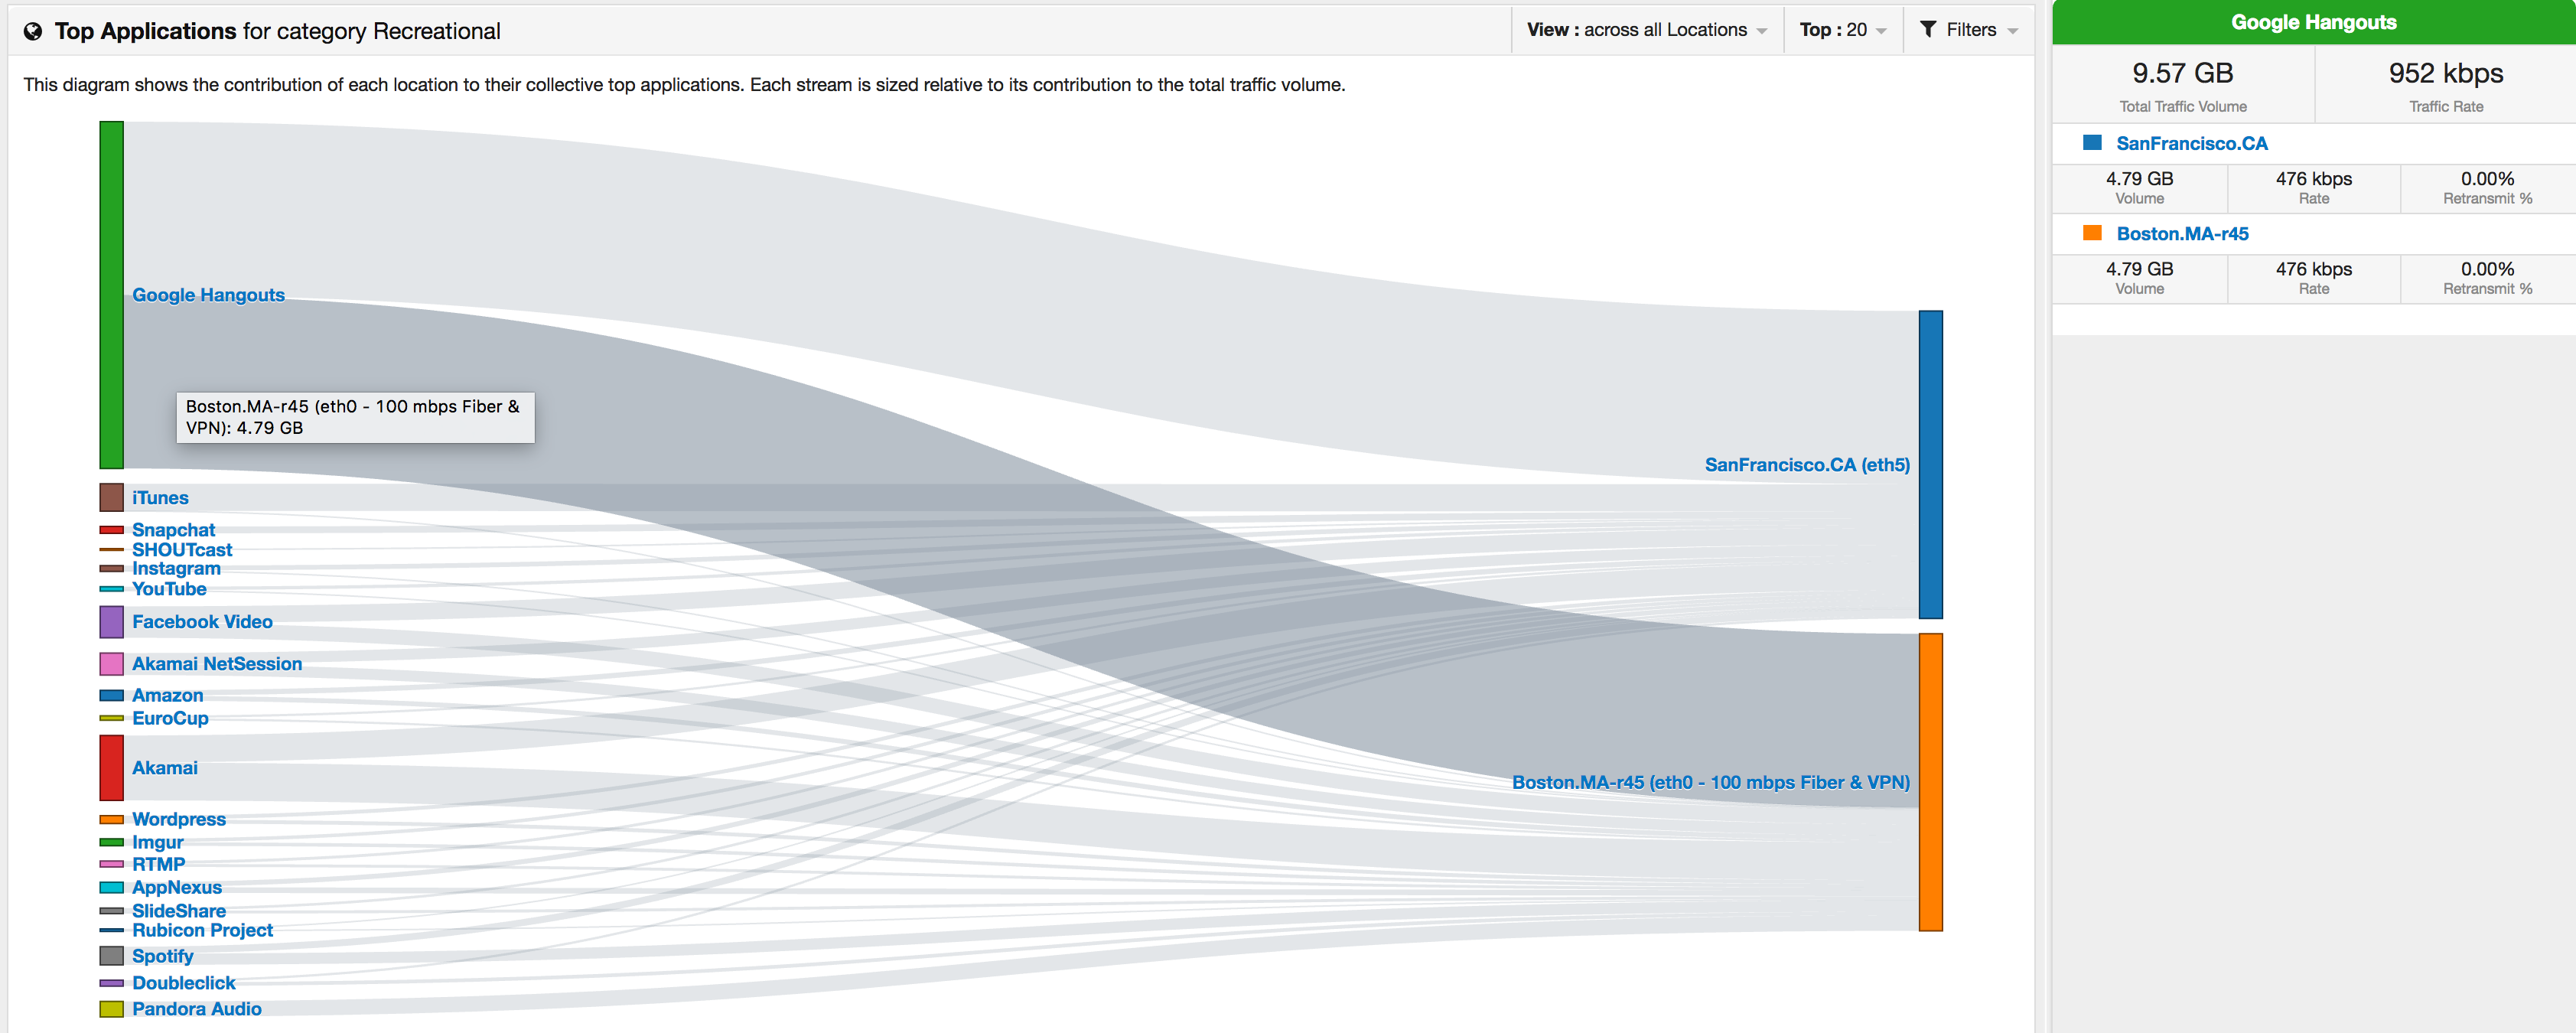 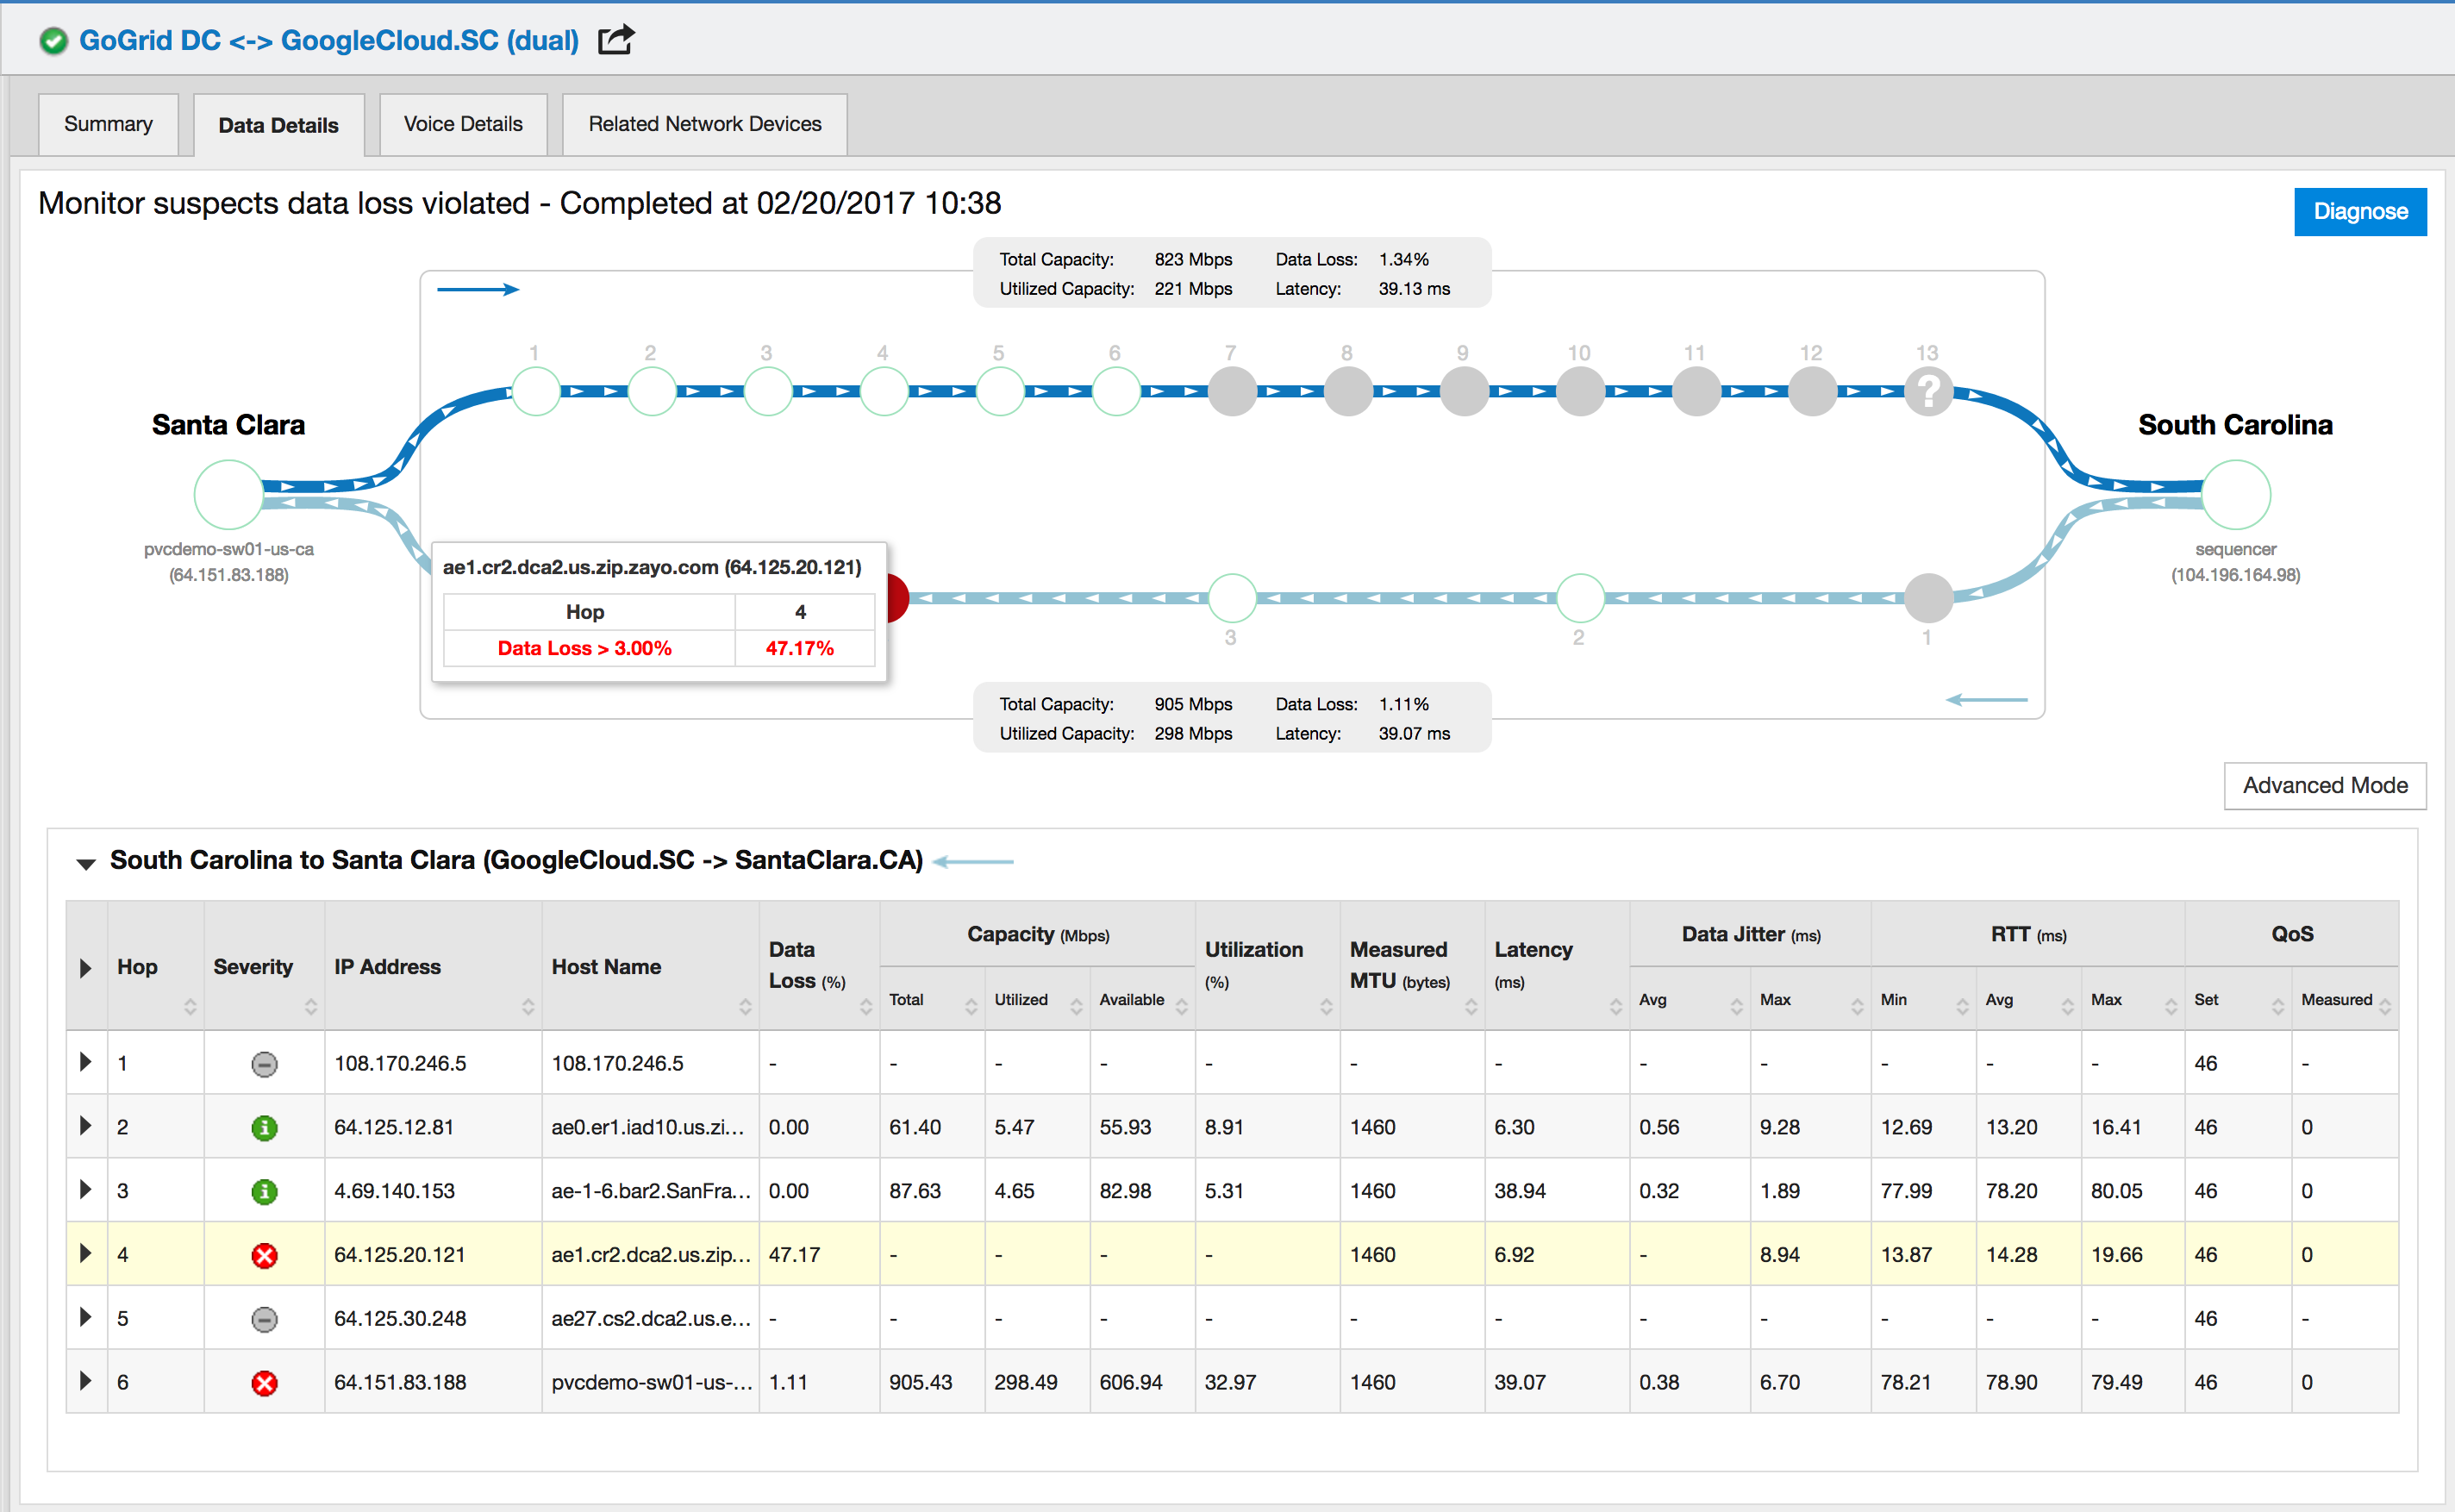   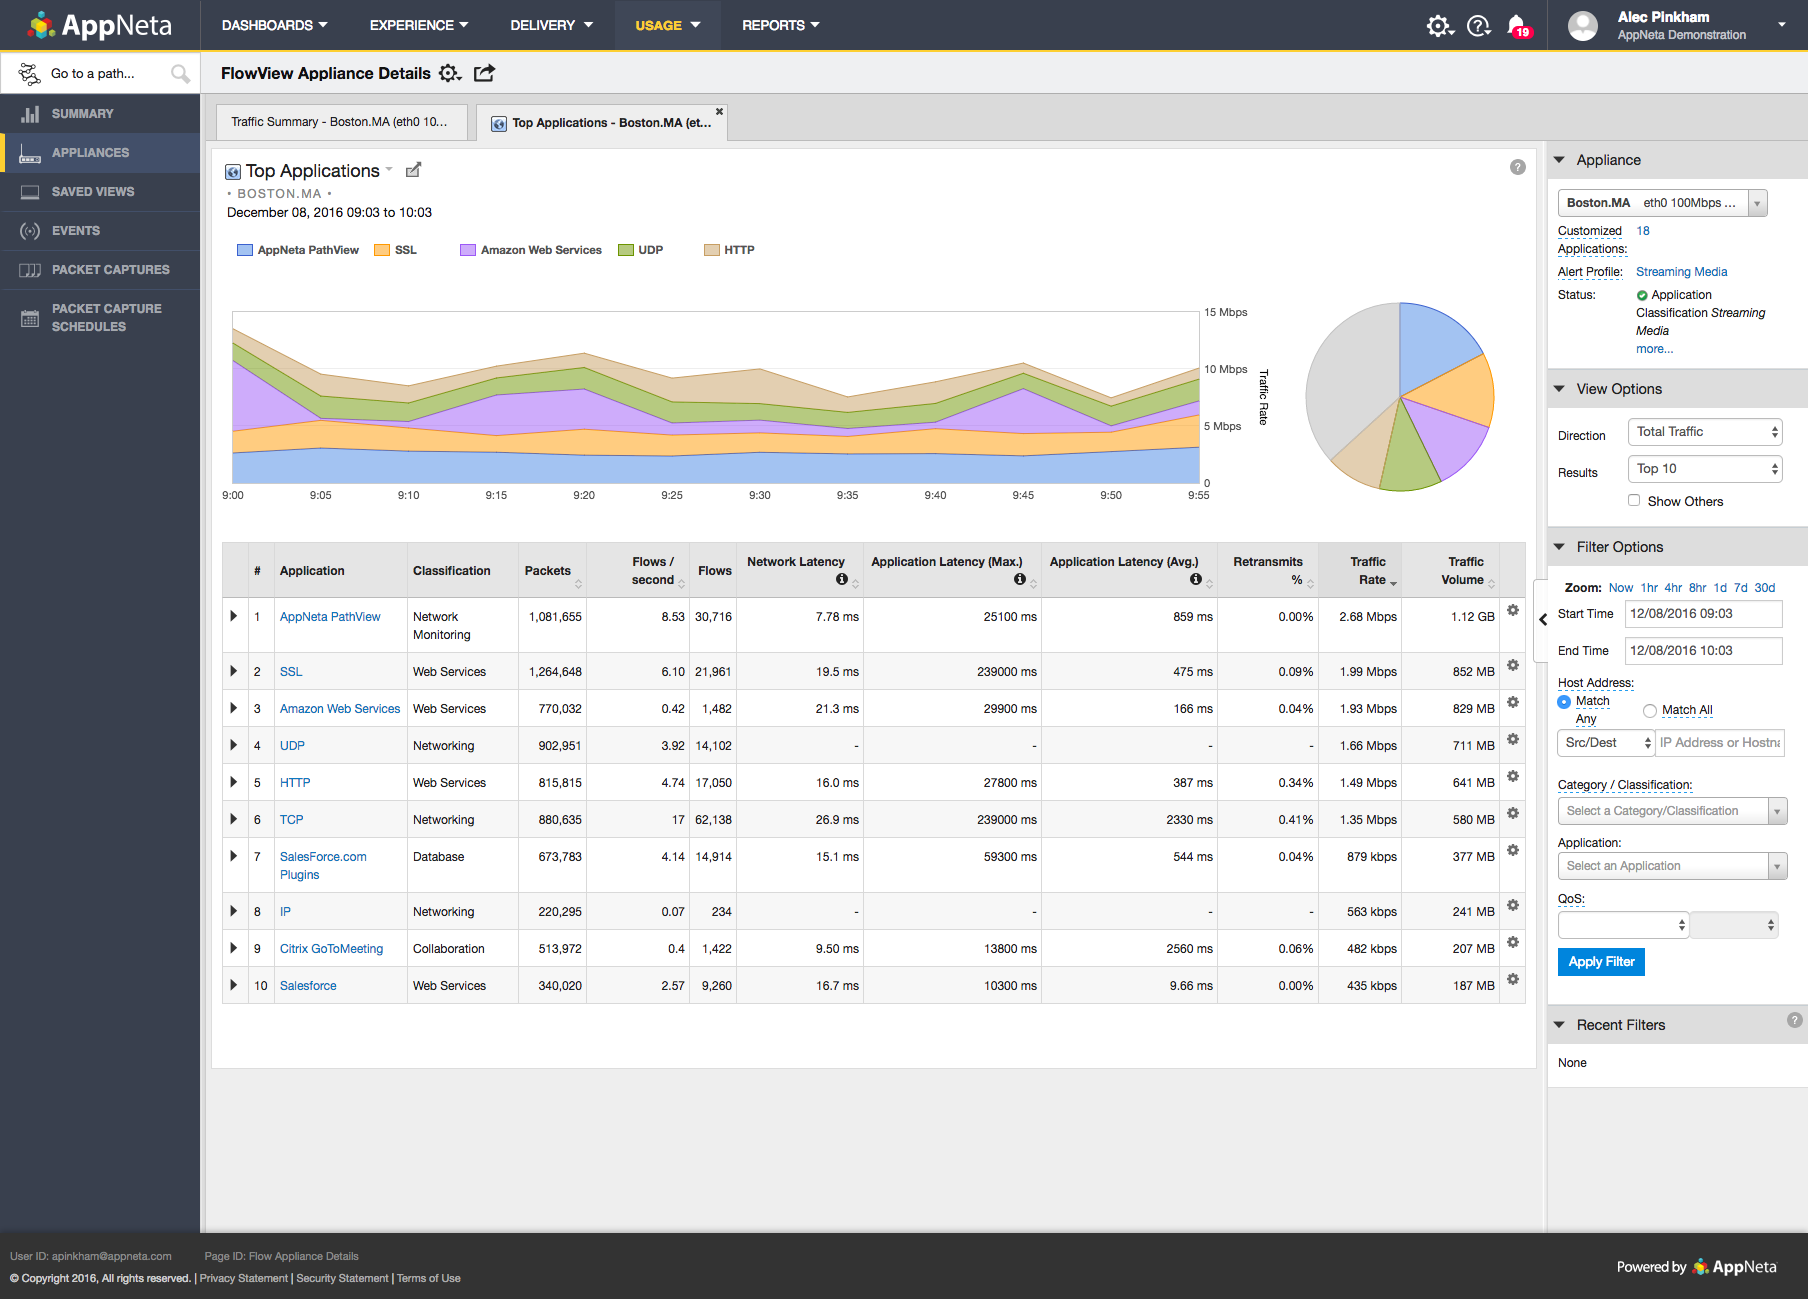  |