BizNet Software vs. Mediafly Intelligence360
BizNet Software vs. Mediafly Intelligence360
| Product | Rating | Most Used By | Product Summary | Starting Price |
|---|---|---|---|---|
 BizNet Software | Small Businesses (1-50 employees) | BizNet Excel Suite is a document management software offering from BizNet Software. It includes features such as a business reporting and analytics platform and provides real-time access to your business data from Microsoft Excel. | $30 per user, per month | |
 Mediafly Intelligence360 | N/A | Mediafly Intelligence360, based on InsightSquared's solution acquired by Mediafly in 2021, is a sales analytics and development platform that also supports demand generation analytics and SaaS reporting. It is designed for providing insights into sales processes, closing rates, pipeline and revenue forecasts, calculating KPIs, and market hiring processes. | $65 per month |
| BizNet Software | Mediafly Intelligence360 | |||||||||||||||
|---|---|---|---|---|---|---|---|---|---|---|---|---|---|---|---|---|
| Editions & Modules |
| No answers on this topic | ||||||||||||||
| Offerings |
| |||||||||||||||
| Entry-level Setup Fee | $4,500 per install plus starter pack licenses | No setup fee | ||||||||||||||
| Additional Details | BizNet Training - Standard Package (3 Seats) $795.00 Yearly BizNet Training - Premium Package (3 Seats) $995.00 Yearly BizNet Training - Premium Plus Package (3 Seats) $1,295.00 Yearly Education Block $695.00 Installation Training $225.00 | — | ||||||||||||||
| More Pricing Information | ||||||||||||||||
| BizNet Software | Mediafly Intelligence360 | |
|---|---|---|
| Top Pros | ||
| Top Cons |
|
|
| BizNet Software | Mediafly Intelligence360 | |||||||||||||||
|---|---|---|---|---|---|---|---|---|---|---|---|---|---|---|---|---|
| BI Standard Reporting |
| |||||||||||||||
| Ad-hoc Reporting |
| |||||||||||||||
| Report Output and Scheduling |
| |||||||||||||||
| Data Discovery and Visualization |
| |||||||||||||||
| Access Control and Security |
|
| BizNet Software | Mediafly Intelligence360 | |
|---|---|---|
| Small Businesses |  BrightGauge Score 8.9 out of 10 |  Salesforce Sales Cloud Score 8.4 out of 10 |
| Medium-sized Companies |  Reveal Score 9.9 out of 10 |  Clari Score 8.2 out of 10 |
| Enterprises |  Jaspersoft Community Edition Score 9.7 out of 10 | Clari Score 8.2 out of 10 |
| All Alternatives | View all alternatives | View all alternatives |
| BizNet Software | Mediafly Intelligence360 | |
|---|---|---|
| Likelihood to Recommend | 8.9 (20 ratings) | 7.1 (45 ratings) |
| Likelihood to Renew | 6.1 (2 ratings) | 8.5 (25 ratings) |
| Usability | 9.1 (3 ratings) | 7.9 (5 ratings) |
| Availability | - (0 ratings) | 8.4 (3 ratings) |
| Performance | - (0 ratings) | 9.1 (1 ratings) |
| Support Rating | 9.1 (3 ratings) | 9.5 (4 ratings) |
| Implementation Rating | 9.1 (3 ratings) | 9.1 (1 ratings) |
| Product Scalability | - (0 ratings) | 8.2 (1 ratings) |
| BizNet Software | Mediafly Intelligence360 | |
|---|---|---|
| Likelihood to Recommend | BizNet Software
|  Mediafly, Inc.
|
| Pros | BizNet Software
 Ryan Palumbo Accounting Manager | Mediafly, Inc.
 Mona Trabelsi Account Manager |
| Cons | BizNet Software
 Viola Avery Staff Accountant | Mediafly, Inc.
 Amanda Matczynski Senior Operations Specialist |
| Likelihood to Renew | BizNet Software
 Lisa Beach ERP and Business Intelligence Consultant | Mediafly, Inc.
 Henry Hayes Support Operations Lead |
| Usability | BizNet Software
 Rick Findley BS, MS, CGFM auditor | Mediafly, Inc.
 Lindsey Hunt Sales Enablement |
| Reliability and Availability | BizNet Software No answers on this topic | Mediafly, Inc.
 Alex Unruh Technical Recruiter |
| Performance | BizNet Software No answers on this topic | Mediafly, Inc.
 Josh Costello Technical Recruiter |
| Support Rating | BizNet Software
| Mediafly, Inc.
 Ryan Weber Sr. Marketing Operations Manager |
| Implementation Rating | BizNet Software
Rick Findley BS, MS, CGFM auditor | Mediafly, Inc. No answers on this topic |
| Alternatives Considered | BizNet Software
| Mediafly, Inc.
|
| Return on Investment | BizNet Software
 Sherma Thorne Accounting Associate | Mediafly, Inc.
Lindsey Hunt Sales Enablement |
| ScreenShots | BizNet Software Screenshots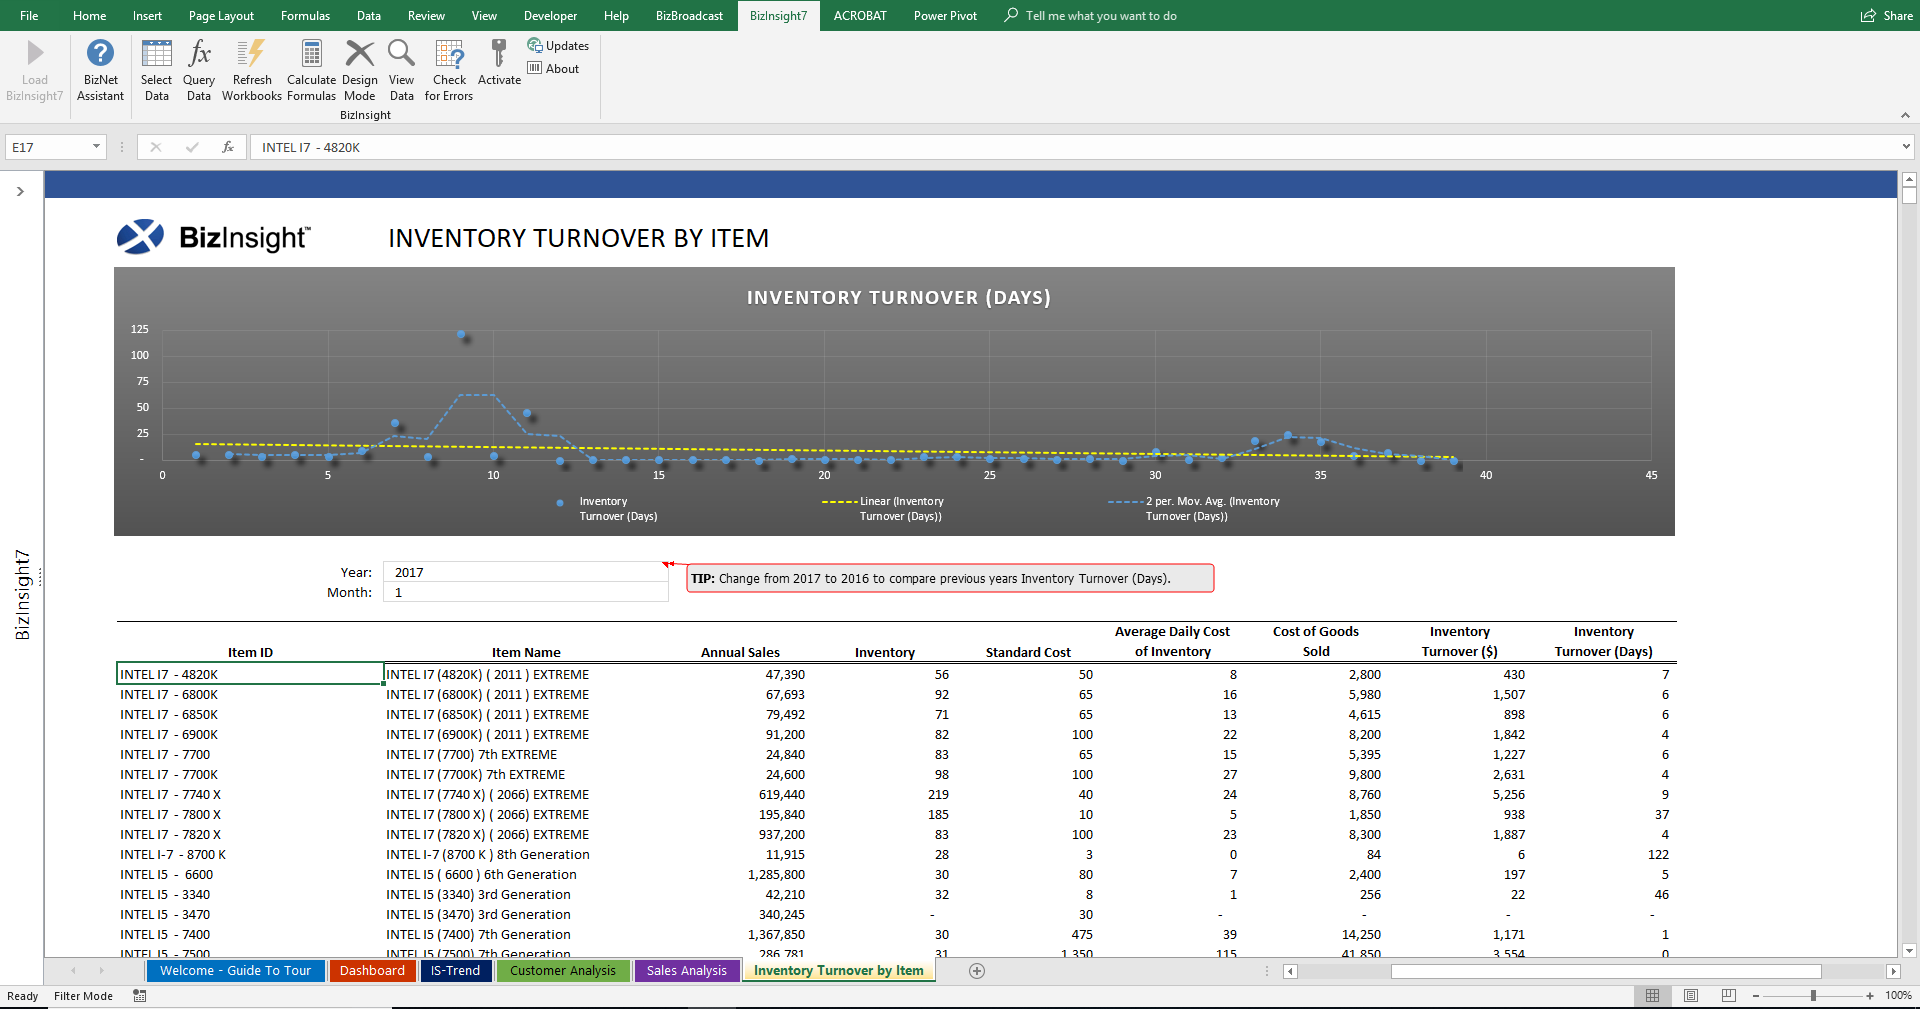 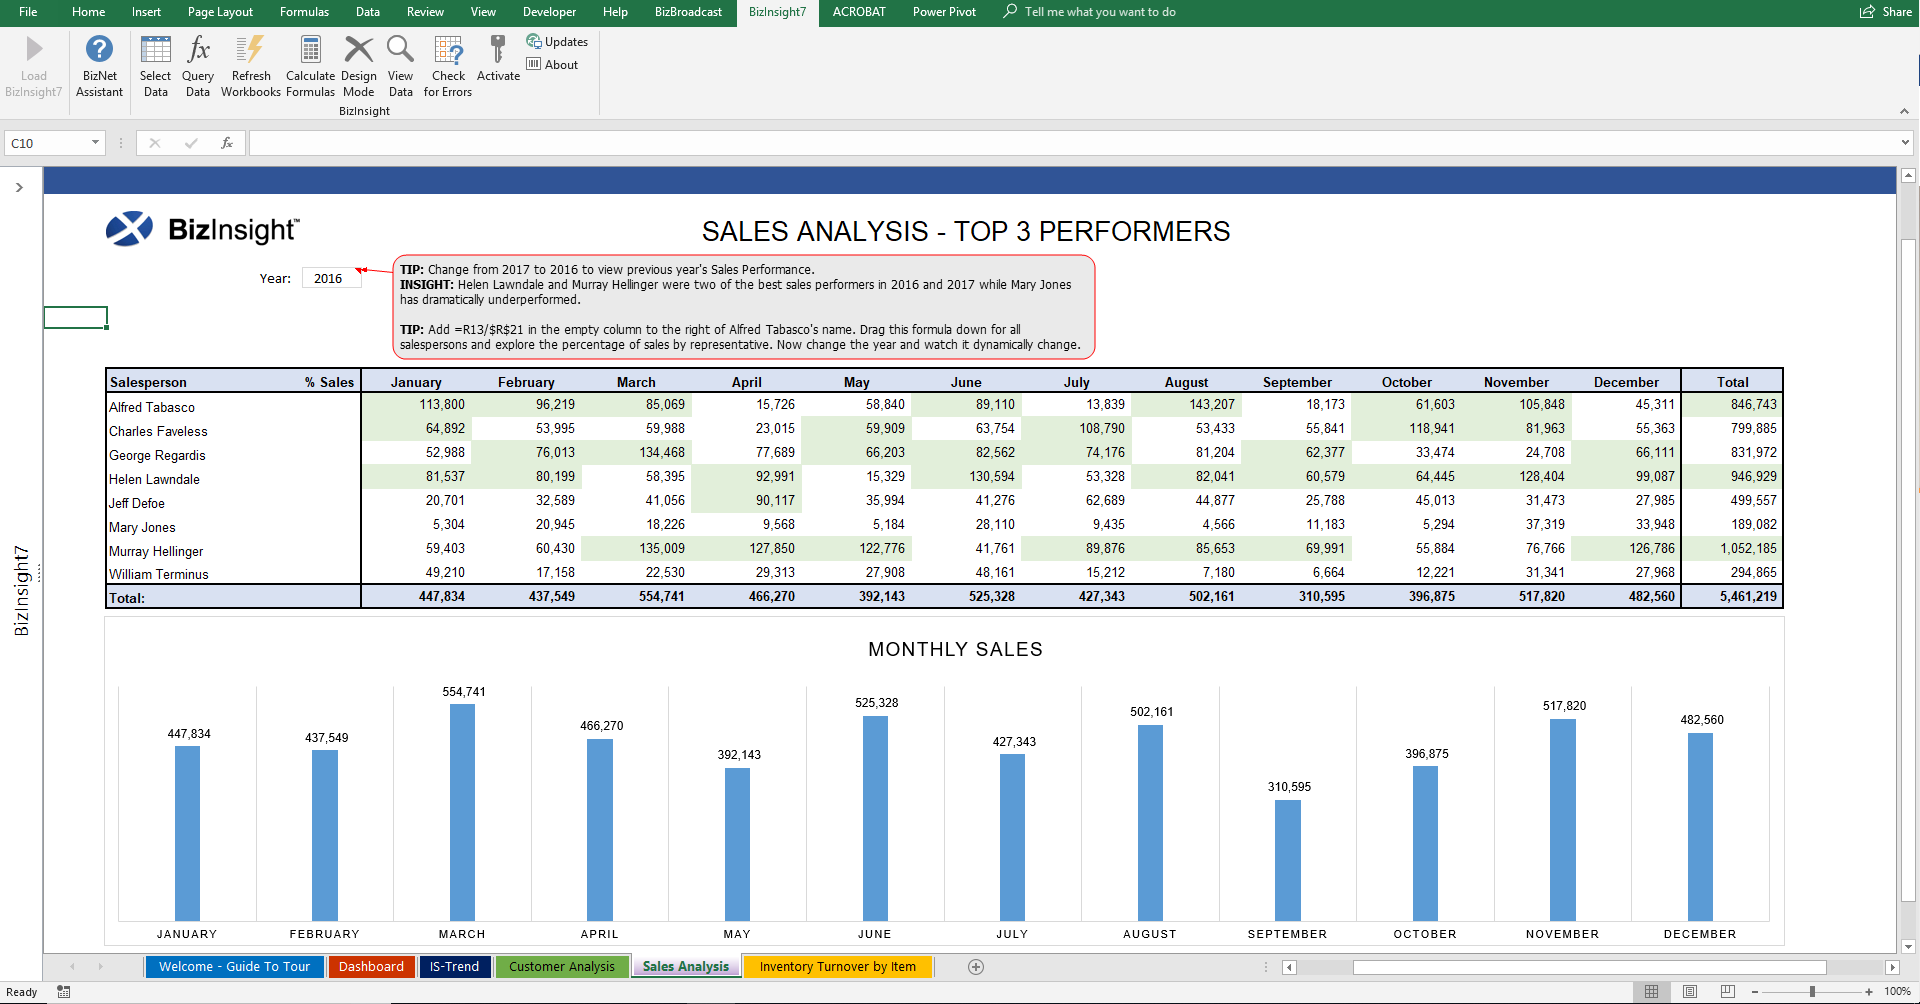  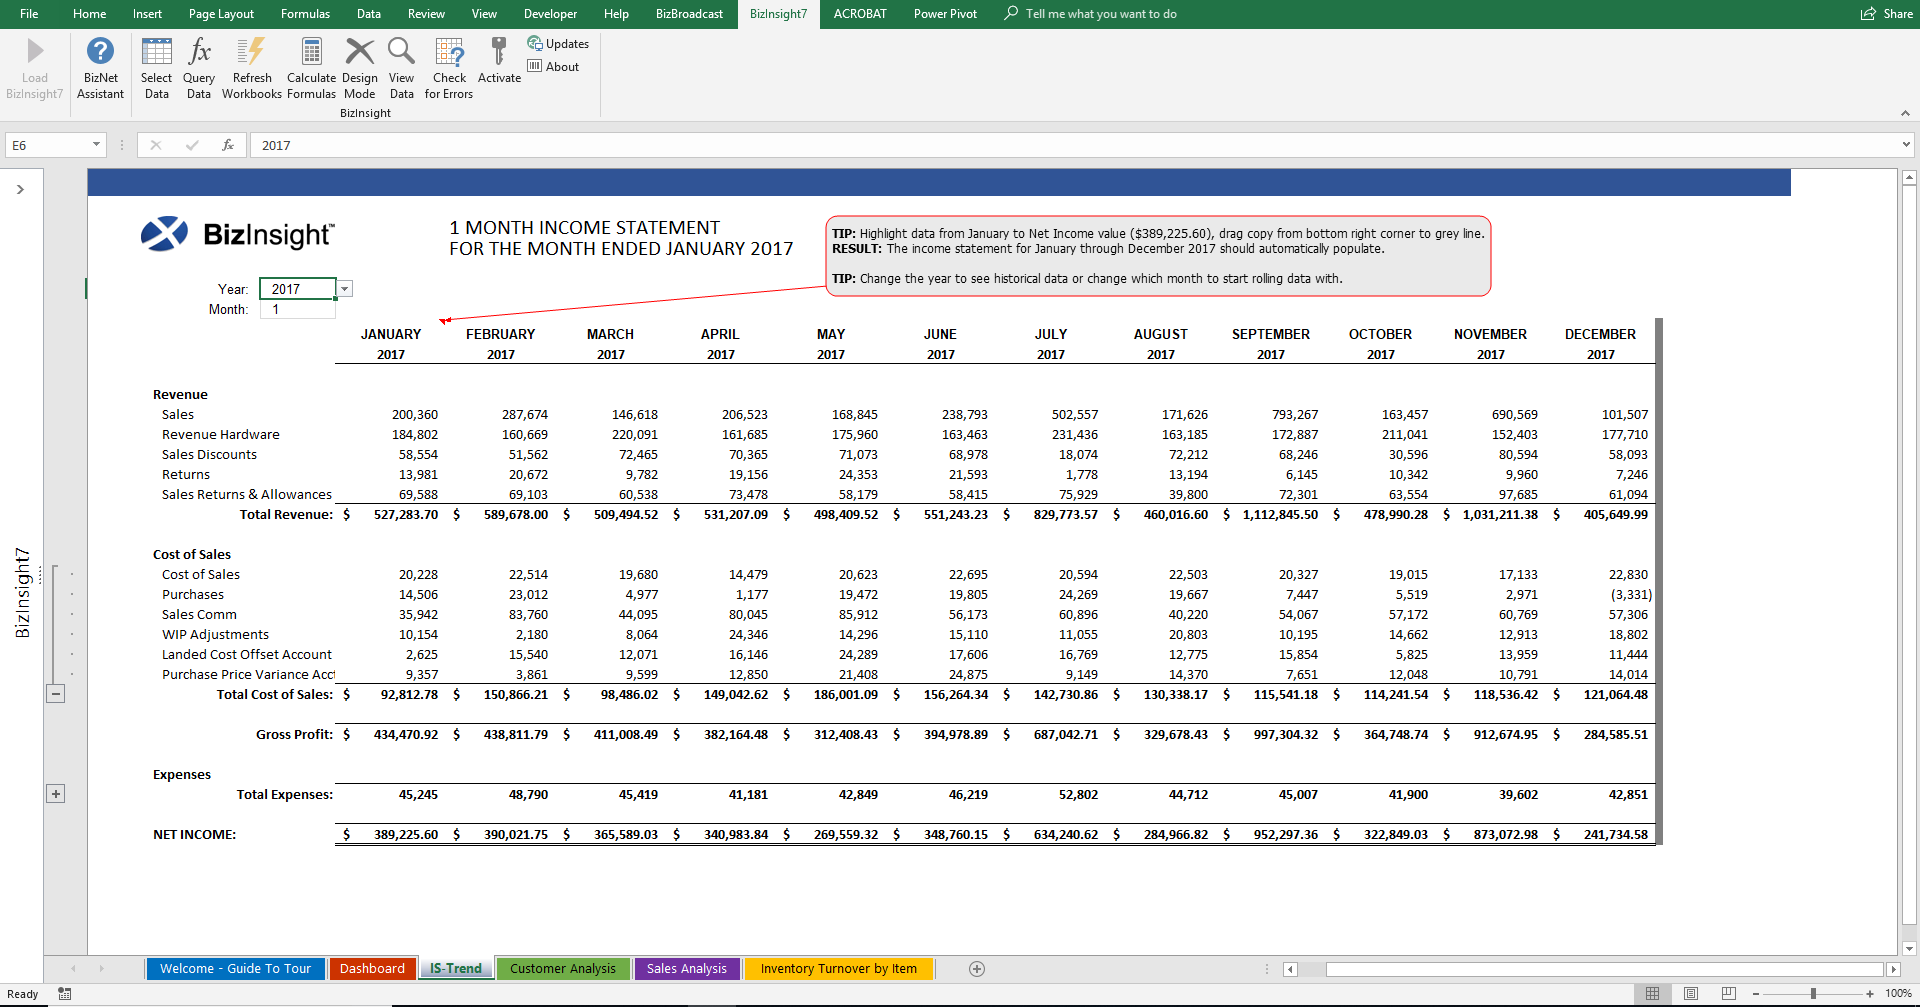 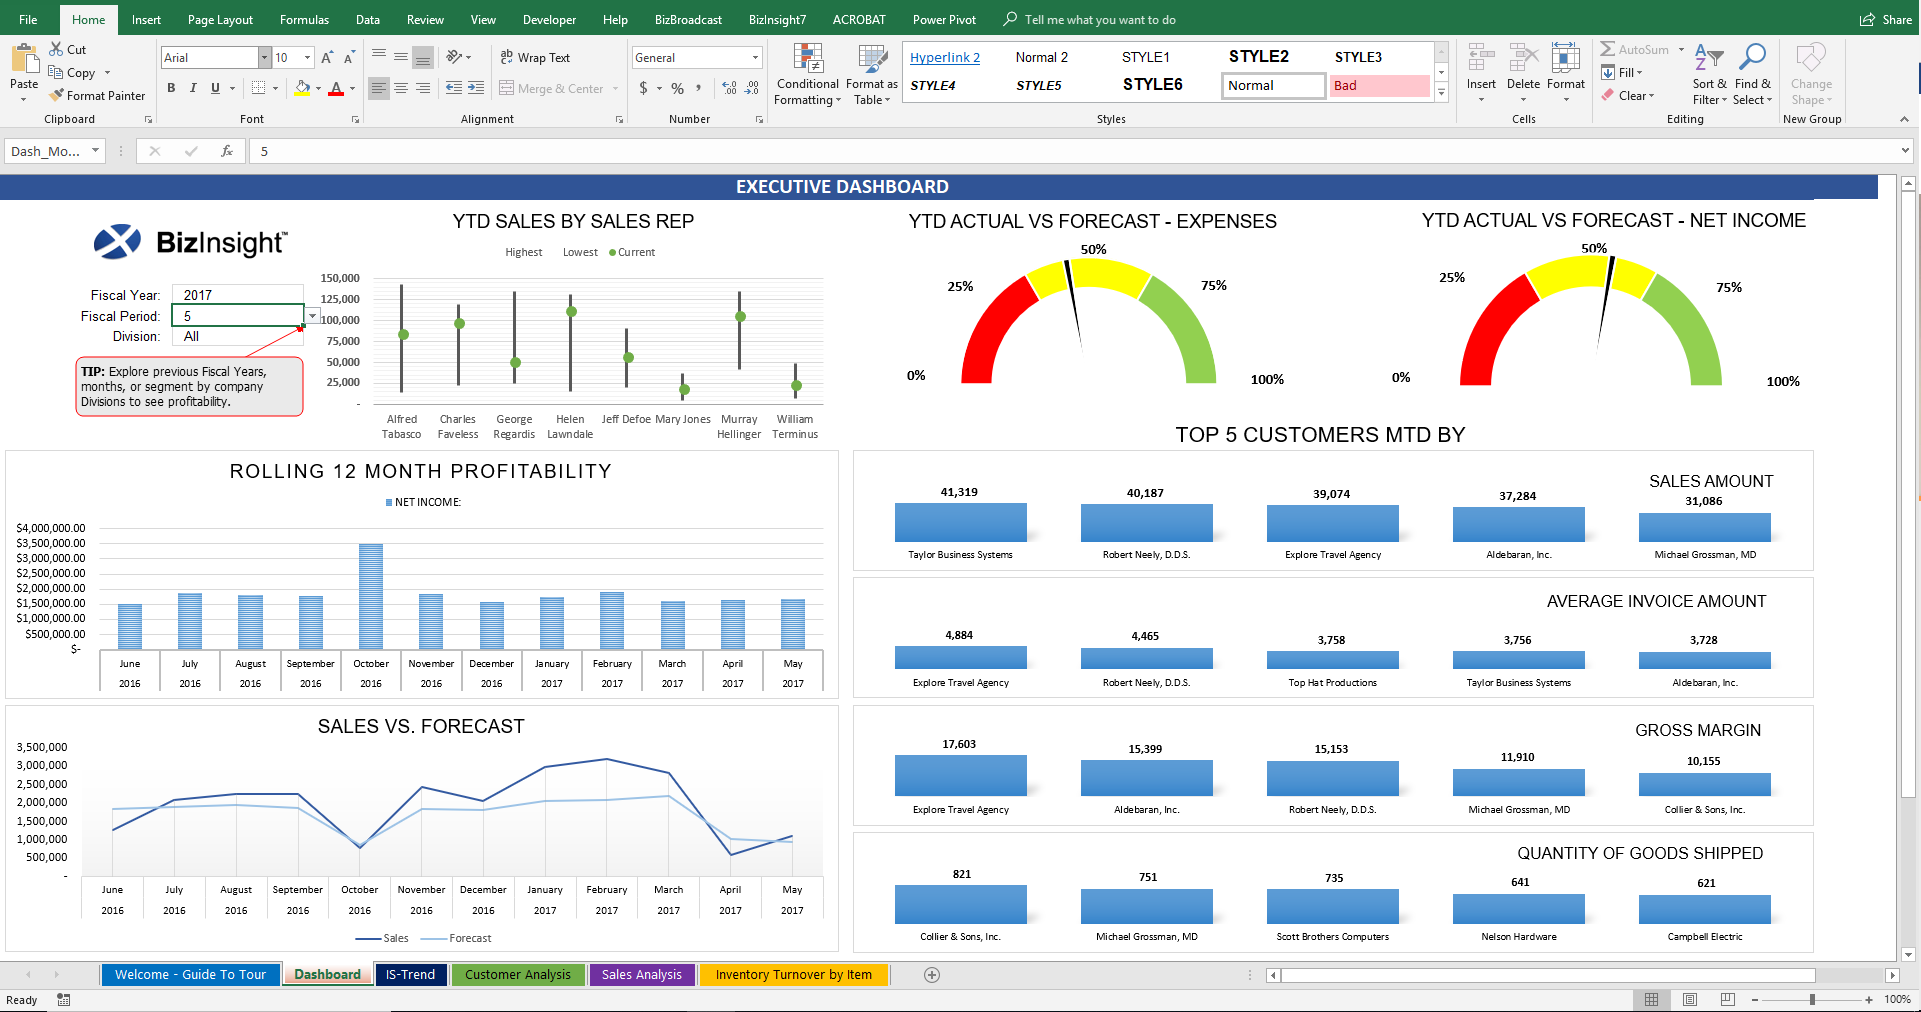 | Mediafly Intelligence360 Screenshots     |