ConnectWise PSA (formerly Manage) is a business management platform for companies that sell, service, and support technology. The platform is cloud-based and integrates automation, help desk and customer service, sales, marketing, project management, and business analytics. It is the hub of the ConnectWise suite.
$35
Per Tech Per Month
Sigma
Score 8.3 out of 10
N/A
Sigma Computing headquartered in San Francisco provides a suite of data services such as code free data modeling, data search and explorating, and related BI and data visualization services.
N/A
Pricing
ConnectWise PSA
Sigma Computing
Editions & Modules
Subscription
$35.00
Per Tech Per Month
No answers on this topic
Offerings
Pricing Offerings
ConnectWise PSA
Sigma
Free Trial
No
Yes
Free/Freemium Version
No
No
Premium Consulting/Integration Services
No
No
Entry-level Setup Fee
No setup fee
Optional
Additional Details
—
Contact us for pricing.
More Pricing Information
Community Pulse
ConnectWise PSA
Sigma Computing
Features
ConnectWise PSA
Sigma Computing
Incident and problem management
Comparison of Incident and problem management features of Product A and Product B
ConnectWise PSA
8.7
88 Ratings
6% above category average
Sigma Computing
-
Ratings
Organize and prioritize service tickets
9.388 Ratings
00 Ratings
Expert directory
6.950 Ratings
00 Ratings
Subscription-based notifications
8.361 Ratings
00 Ratings
ITSM collaboration and documentation
8.168 Ratings
00 Ratings
Ticket creation and submission
9.888 Ratings
00 Ratings
Ticket response
9.687 Ratings
00 Ratings
Self Help Community
Comparison of Self Help Community features of Product A and Product B
ConnectWise PSA
8.1
82 Ratings
1% above category average
Sigma Computing
-
Ratings
External knowledge base
8.467 Ratings
00 Ratings
Internal knowledge base
7.877 Ratings
00 Ratings
Multi-Channel Help
Comparison of Multi-Channel Help features of Product A and Product B
ConnectWise PSA
9.2
85 Ratings
14% above category average
Sigma Computing
-
Ratings
Customer portal
8.080 Ratings
00 Ratings
IVR
10.021 Ratings
00 Ratings
Social integration
10.028 Ratings
00 Ratings
Email support
9.580 Ratings
00 Ratings
Help Desk CRM integration
8.575 Ratings
00 Ratings
BI Standard Reporting
Comparison of BI Standard Reporting features of Product A and Product B
ConnectWise PSA
-
Ratings
Sigma Computing
7.9
163 Ratings
3% below category average
Pixel Perfect reports
00 Ratings
6.8104 Ratings
Customizable dashboards
00 Ratings
9.2161 Ratings
Report Formatting Templates
00 Ratings
7.8133 Ratings
Ad-hoc Reporting
Comparison of Ad-hoc Reporting features of Product A and Product B
ConnectWise PSA
-
Ratings
Sigma Computing
7.8
166 Ratings
3% below category average
Drill-down analysis
00 Ratings
8.4155 Ratings
Formatting capabilities
00 Ratings
7.3163 Ratings
Integration with R or other statistical packages
00 Ratings
7.35 Ratings
Report sharing and collaboration
00 Ratings
8.1162 Ratings
Report Output and Scheduling
Comparison of Report Output and Scheduling features of Product A and Product B
ConnectWise PSA
-
Ratings
Sigma Computing
8.0
156 Ratings
2% below category average
Publish to Web
00 Ratings
8.3103 Ratings
Publish to PDF
00 Ratings
7.9130 Ratings
Report Versioning
00 Ratings
7.7120 Ratings
Report Delivery Scheduling
00 Ratings
8.3132 Ratings
Delivery to Remote Servers
00 Ratings
7.668 Ratings
Data Discovery and Visualization
Comparison of Data Discovery and Visualization features of Product A and Product B
BrightGauge lets us know when we have critical issues that need solving. A massive influx of tickets all at the same time triggers an investigation. Usually, it is tied to a server going down, which we can address. It would not be helpful for a small MSP or IT department with just a few daily tickets. The stats are better used to track a large amount of clients.
We were able to set up client-facing embedded reports with ease and security. The interface is not difficult to learn, although we may not be aware of or lack the necessary expertise to utilize more advanced features that would likely benefit us.
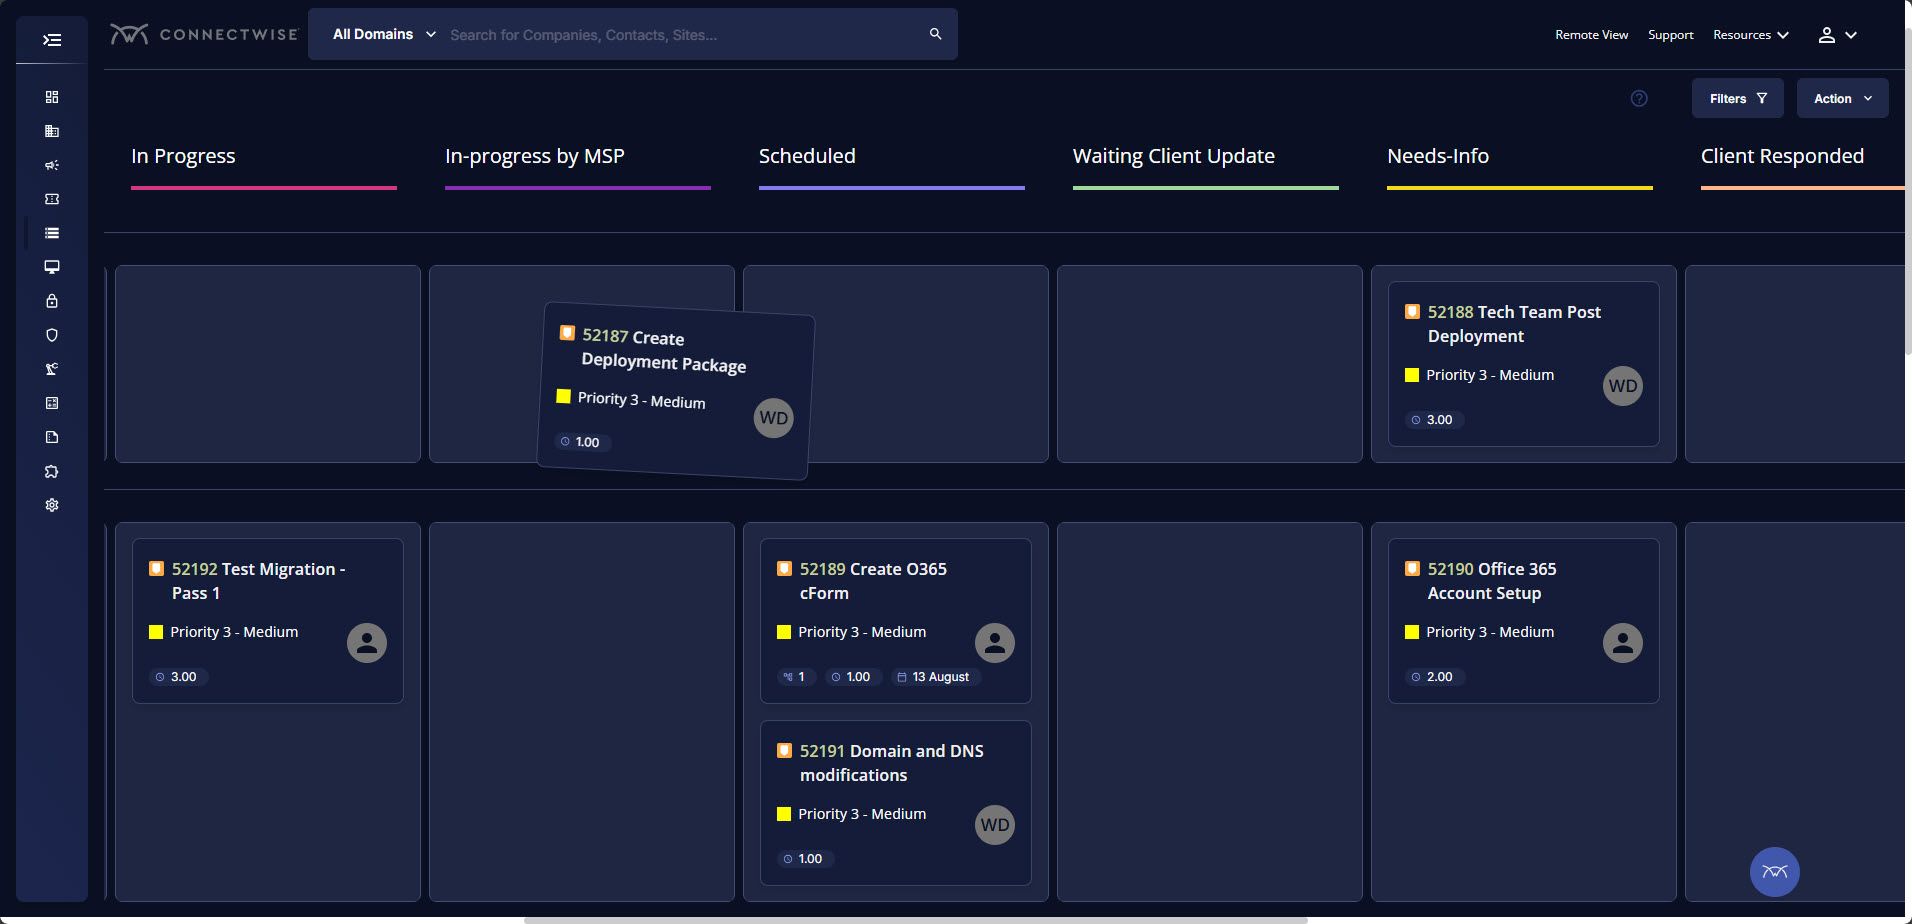
Tickets- Customers can email and a ticket is generated and falls under their profile for historical records. You can save documents and select if they are customer facing or only internal facing. The option as well to have communication in tickets whether its internal facing or customer facing is nice to have when you're trying to keep a record or important details for just internal means and the customer doesn't have to see all the jargon.
Procurement - It's great to have this integrate with Quosal Sell. Quotes being processed into opportunities and then into a sales order which connects to a ticket or project is pretty easy to use. It does have a learning curve but once you get the hang of it, it's straightforward. Everything is pretty connected, whether keeping track of products customers have purchased historically through us, to knowing what ticket is associated to an RMA.
Annual or more than annualized data is desperately needed for MSPs to show trends, current limitation is previous 240 days for ConnectWise tickets
Alerts when datasets do not sync properly, I have to rely on my team to notice vs get an automated alert from BrightGauge
Small thing, but it would be nice to have more options on the report scheduler to enable a start date. If you wish to do it quarterly, you have to start the schedule exactly 3 months from the next run.
Sigma Computing does not allow custom ordering of pivot fields in pivot tables easily
Sigma Computing lacks functionality for creating tables or sections that dynamically adjust to the browser window's height while maintaining a fixed height textbox at the bottom
Sigma Computing does not provide straightforward options for formatting totals in tables, such as renaming 'Total' to 'Average', 'Team Total', etc
Sigma Computing does not support searching by individual tab names within a workbook
ConnectWise has uniquely positioned themselves with the Modern Office Suite to have direct integration with a nearly full suite of tools for MSPs. Although each tool may not necessarily be the absolute best tool on the market, the efficiencies leveraged through direct integration make the entire suite an obvious choice for most companies.
Sigma has helped us a lot and has become an integral part of our daily workflow. It would be difficult to switch to another platform and have to rebuild the numerous metrics and performance reports that we have already established
I have been using ConnectWise since 2004 and I am impressed with the progress they have made. However, there are still bugs that don't work quite like they should. If I were to run reports and get consistent answers along with a couple other annoyances, then I would score CW as a 10
It has a clean and modern interface. However, it is not completely intuitive. I think it would be better and easier to navigate with more Windows style drop down menus and/or tabls. There is a significant learning curve, but that may be due in part to the technical nature of this type of software tool.
We use the cloud version of ConnectWise and in the last 5 years it has never been down for us during business hours. I can only recall 1 time when it was not available during off hours when we wanted to use it.
Some tab for certain areas load speeds could be better. Dashboards can load slowly when they reference multiple reports. Some reports can load slowly based on the tables and views they are accessing. At times the SQL queries being performed in the background can actually timeout and a tab or screen will fail to load.
The front line support techs are wildly inconsistent when it comes to the level of support. Sometimes you get someone who just wants to throw links to University documentation at you, sometimes you get someone who truly tries to understand your issue and confers with peers and managers to find an answer, and sometimes you get someone who just wants to create a ticket and escalate immediately. If you ask three different techs the same question you will probably get three different answers, one of them being, "That's not possible."
They are very friendly and informative. They are quick in resolving our queries and help us understand very minute things as well. They are quick in creating feature tickets based on our custom requirements, and they would also create a bug ticket if there is any discrepancy and get that checked on time.
We are a telecoms company. Whilst CW were very happy to sell us their product and tell us how good it is for telecoms. All the training material is geared towards IT MSP's. The on-line training material was virtually useless. We found the implementation a bit of a joke. They tried telling us 12 hours of implementation time would be sufficient to launch the product. We erred on the side of caution and paid for 24 hours. This was quickly eaten away and we were nowhere near ready to go-live. I find the on-line chat facility is of much more use for us.
Rather than letting them sell you a block of time for implementation, create a list of things that must be completed do declare the implementation complete. The implementer will have the discretion on what they set up and in what order. They will be trying to end their services in as little time as possible and may not get things set up right. You are best advised to hire a third-party wizard that has done many of these setups. Record the audio and video of all of your implementation sessions.
Everyone but dynamics had holes in it. Dynamics is good, but it requires more development time. I spoke with some people that have CW and liked it. But when I inquired after our frustrations, I discovered they had a full time scheduling & logistics CW manager and the field people were using it purely like any other more simplistic ticket system. They said it would be impossible otherwise. The one big difference is the transparency of the sales effort. The other sales people were honest on the limitations or potential challenges and worked with us. They also worked with our agenda. At CW they don't have that option. The consulting time is eaten through a pre-formatted agenda which they communicate too you, not with you.
With Looker, to be effective, a substantial amount of coding & modeling needs to happen in LookML. Being another language to learn, users have to context switch again from at a minimum either SQL or Python into LookML. The concept of being able to source control, code review, and deploy your models is a plus though.
Tableau is the gold standard for data visualization, no question. Power users will be able to create dazzling content that Sigma won't necessarily be able to easily match. However, since development usually happens via an extract, helping other users troubleshoot is an arduous process. Trying to re-do or un-do all the transformations and calculations that cause a certain number is very difficult.
With Sigma, all the queries happen directly against Snowflake and you can see the query logs. The data modeling happens right in a tabular, spreadsheet-like manner, so within only a few minutes, substantial transformations can happen, with visualizations just a few more clicks away.
ConnectWise seems to have a good understanding of the IT service industry. During the required onboarding training, they even preach configuring only features that you need right now, as you can always scale up later. The feature set for the most part takes into considerations all aspects of an IT business, whether small or enterprise, or growing from one to the next.
Monitoring health of cloud platform has allowed the company to anticipate issues before they affect customers – Sigma prompted us building a canary monitoring process that provides customer container health.
Customer success has used an activity report to discover customers running runaway processes that they were unaware of, creating an alert to contact the customer and prevent an embarrassing situation.
Customer success uses the activity report to prompt conversations regarding increases or declines in behavior that led to increasing contract limits or addressing churn concerns.