Chartbeat delivers real-time analytics, insights, and transformative tools for content teams around the world, to help improve audience engagement, inform editorial decisions, and increase loyalty.
N/A
Coremetrics / IBM Digital Analytics (discontinued)
Score 8.2 out of 10
N/A
Based on the former Coremetrics, IBM Digital Analytics is a discontinued analytics product. IBM acquired Coremetrics in 2010, and re-branded the platform to the IBM Digital Marketing Optimization Solution. Product support was ultimately provided by Acoustic, but the product is not a part of the company's plans going forward.
N/A
Pricing
Chartbeat
Coremetrics / IBM Digital Analytics (discontinued)
Editions & Modules
No answers on this topic
No answers on this topic
Offerings
Pricing Offerings
Chartbeat
Coremetrics / IBM Digital Analytics (discontinued)
Free Trial
Yes
No
Free/Freemium Version
Yes
No
Premium Consulting/Integration Services
No
No
Entry-level Setup Fee
No setup fee
No setup fee
Additional Details
Chartbeat pricing is based on monthly site page views. Discounts are applied to multi-year contracts. The Basic Plan includes the Real-time Dashboard, Historical Dashboard, Heads Up Display, Reports, Big Board, iOS and Android app, and Real-time API endpoints.
The Plus Plan includes all of the Basic Plan features, plus ONE of the following Premium features: Headline Testing, Advanced Queries, or Multi-Site View.
The Premium Plan includes all of the Basic Plan features, plus ALL Premium features: Headline Testing, Advanced Queries, Multi-Site View, and enterprise-level support and custom trainings.
Coremetrics / IBM Digital Analytics (discontinued)
Likelihood to Recommend
Chartbeat
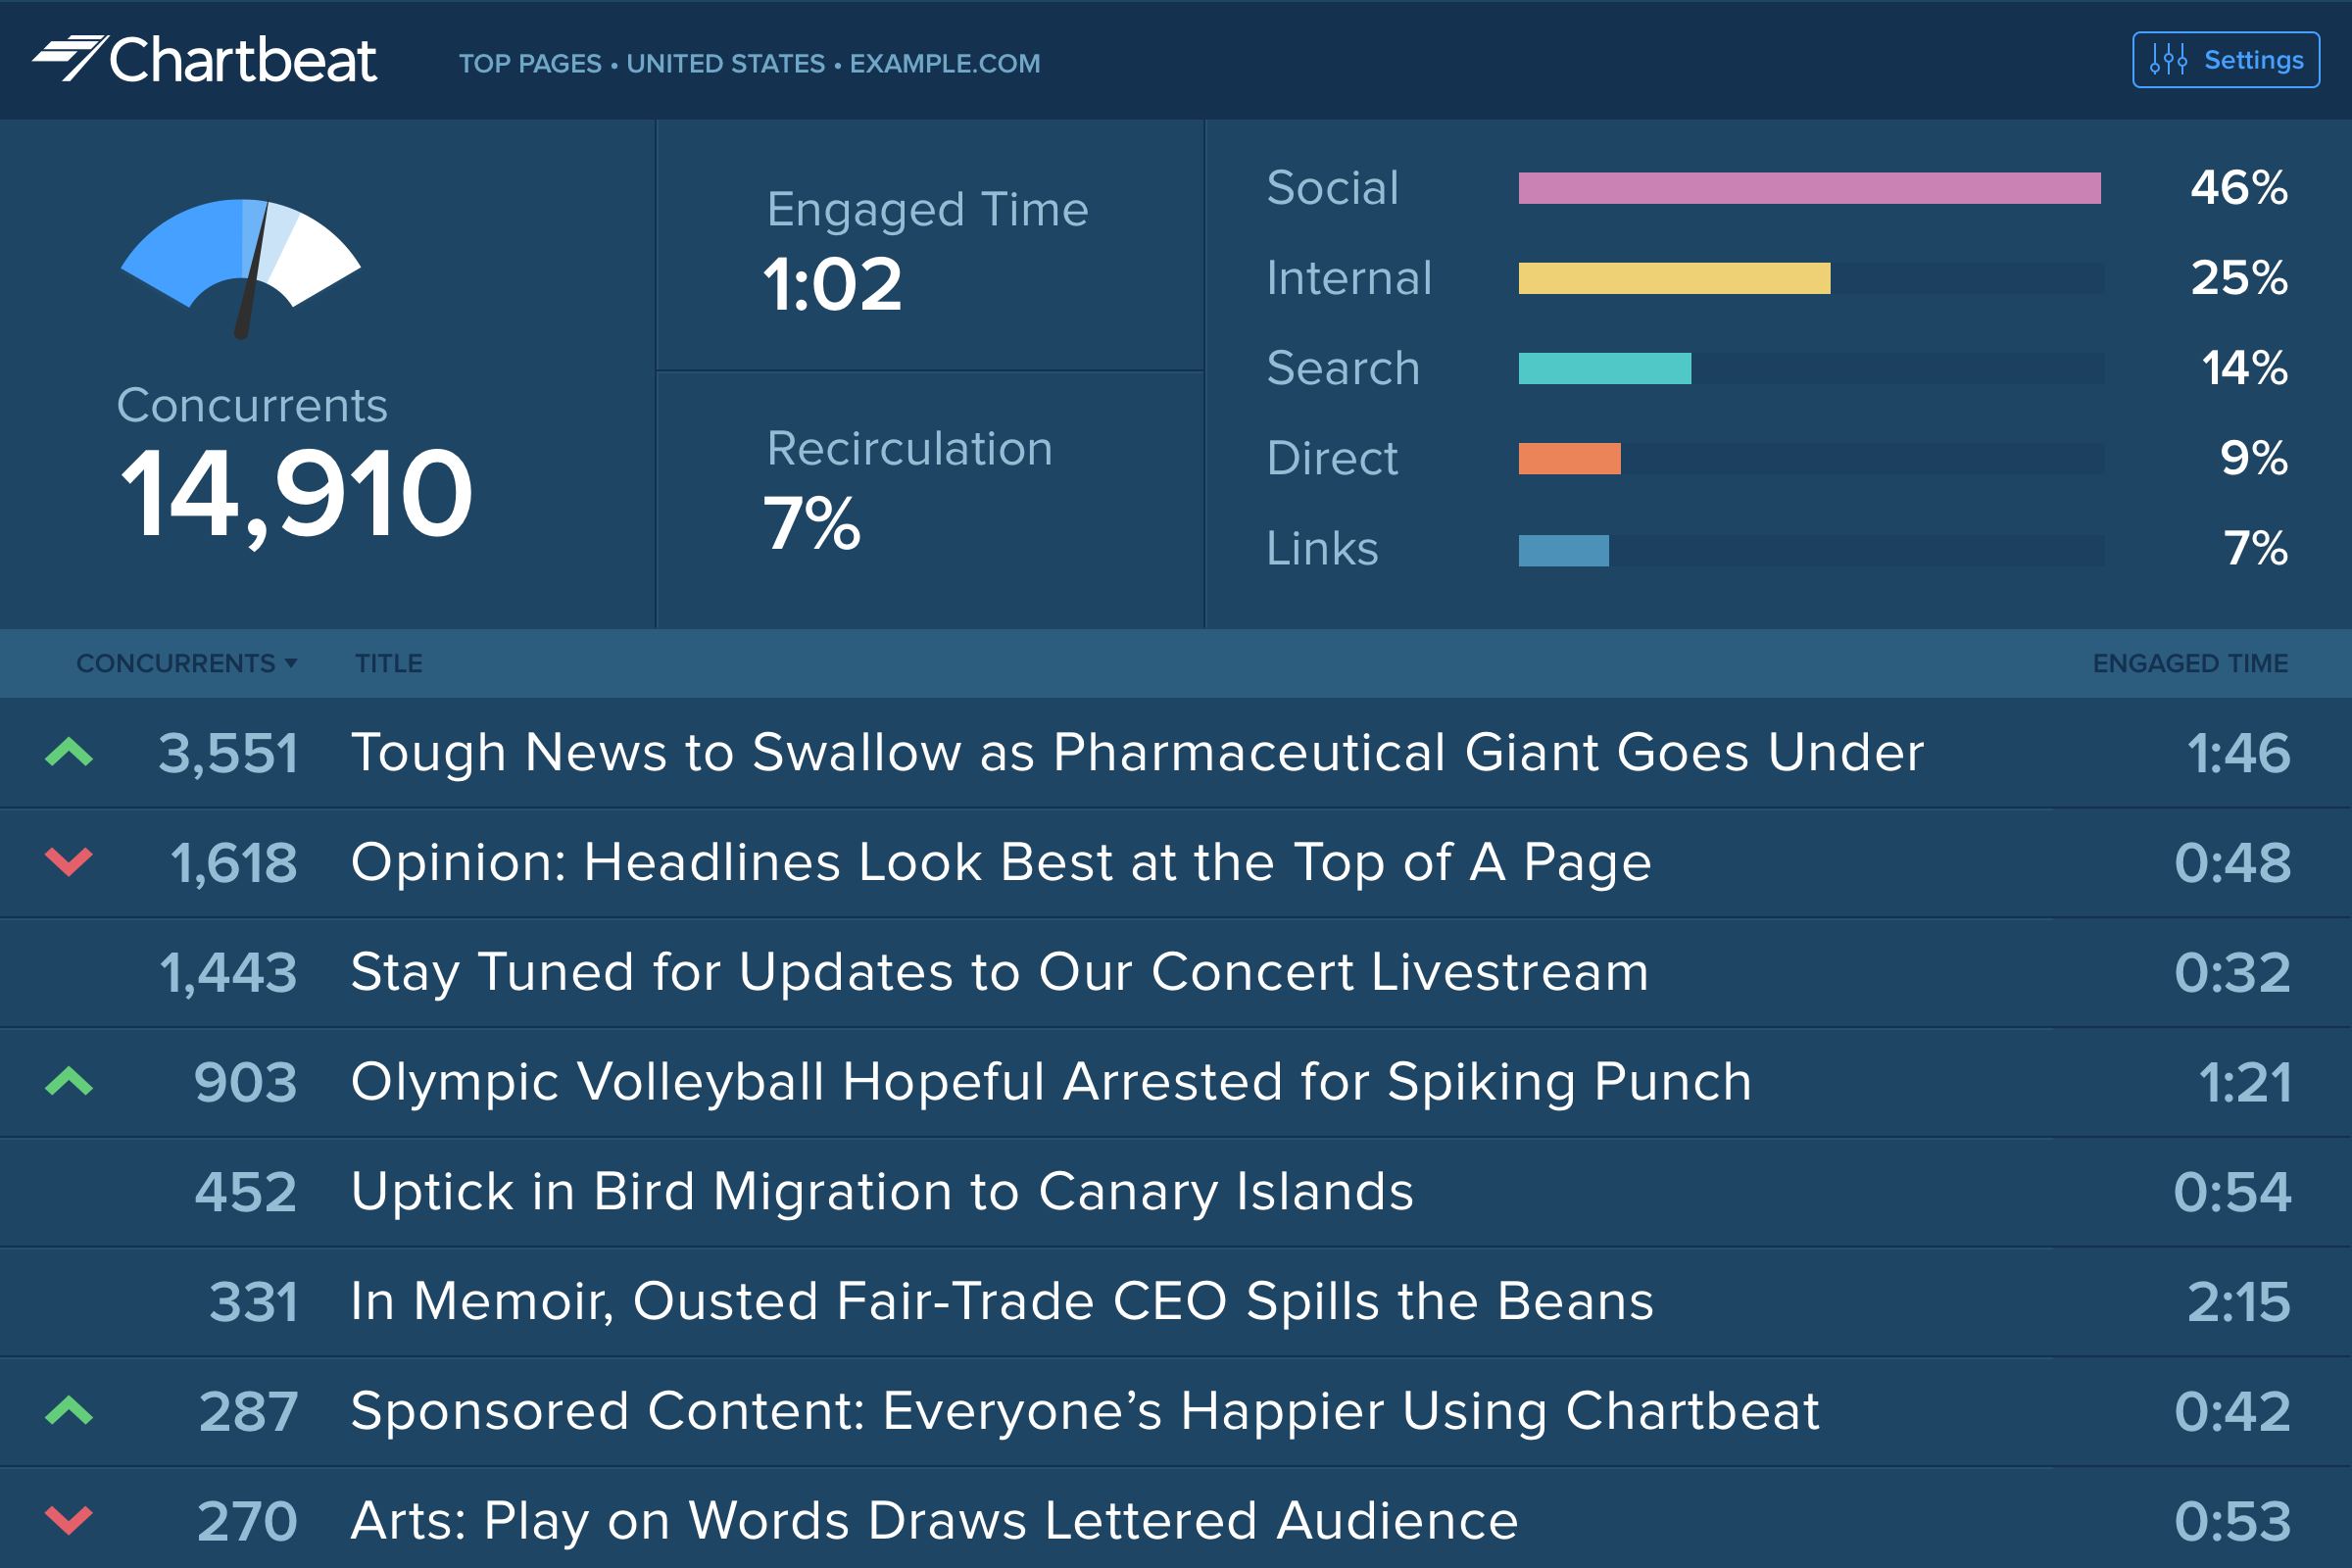
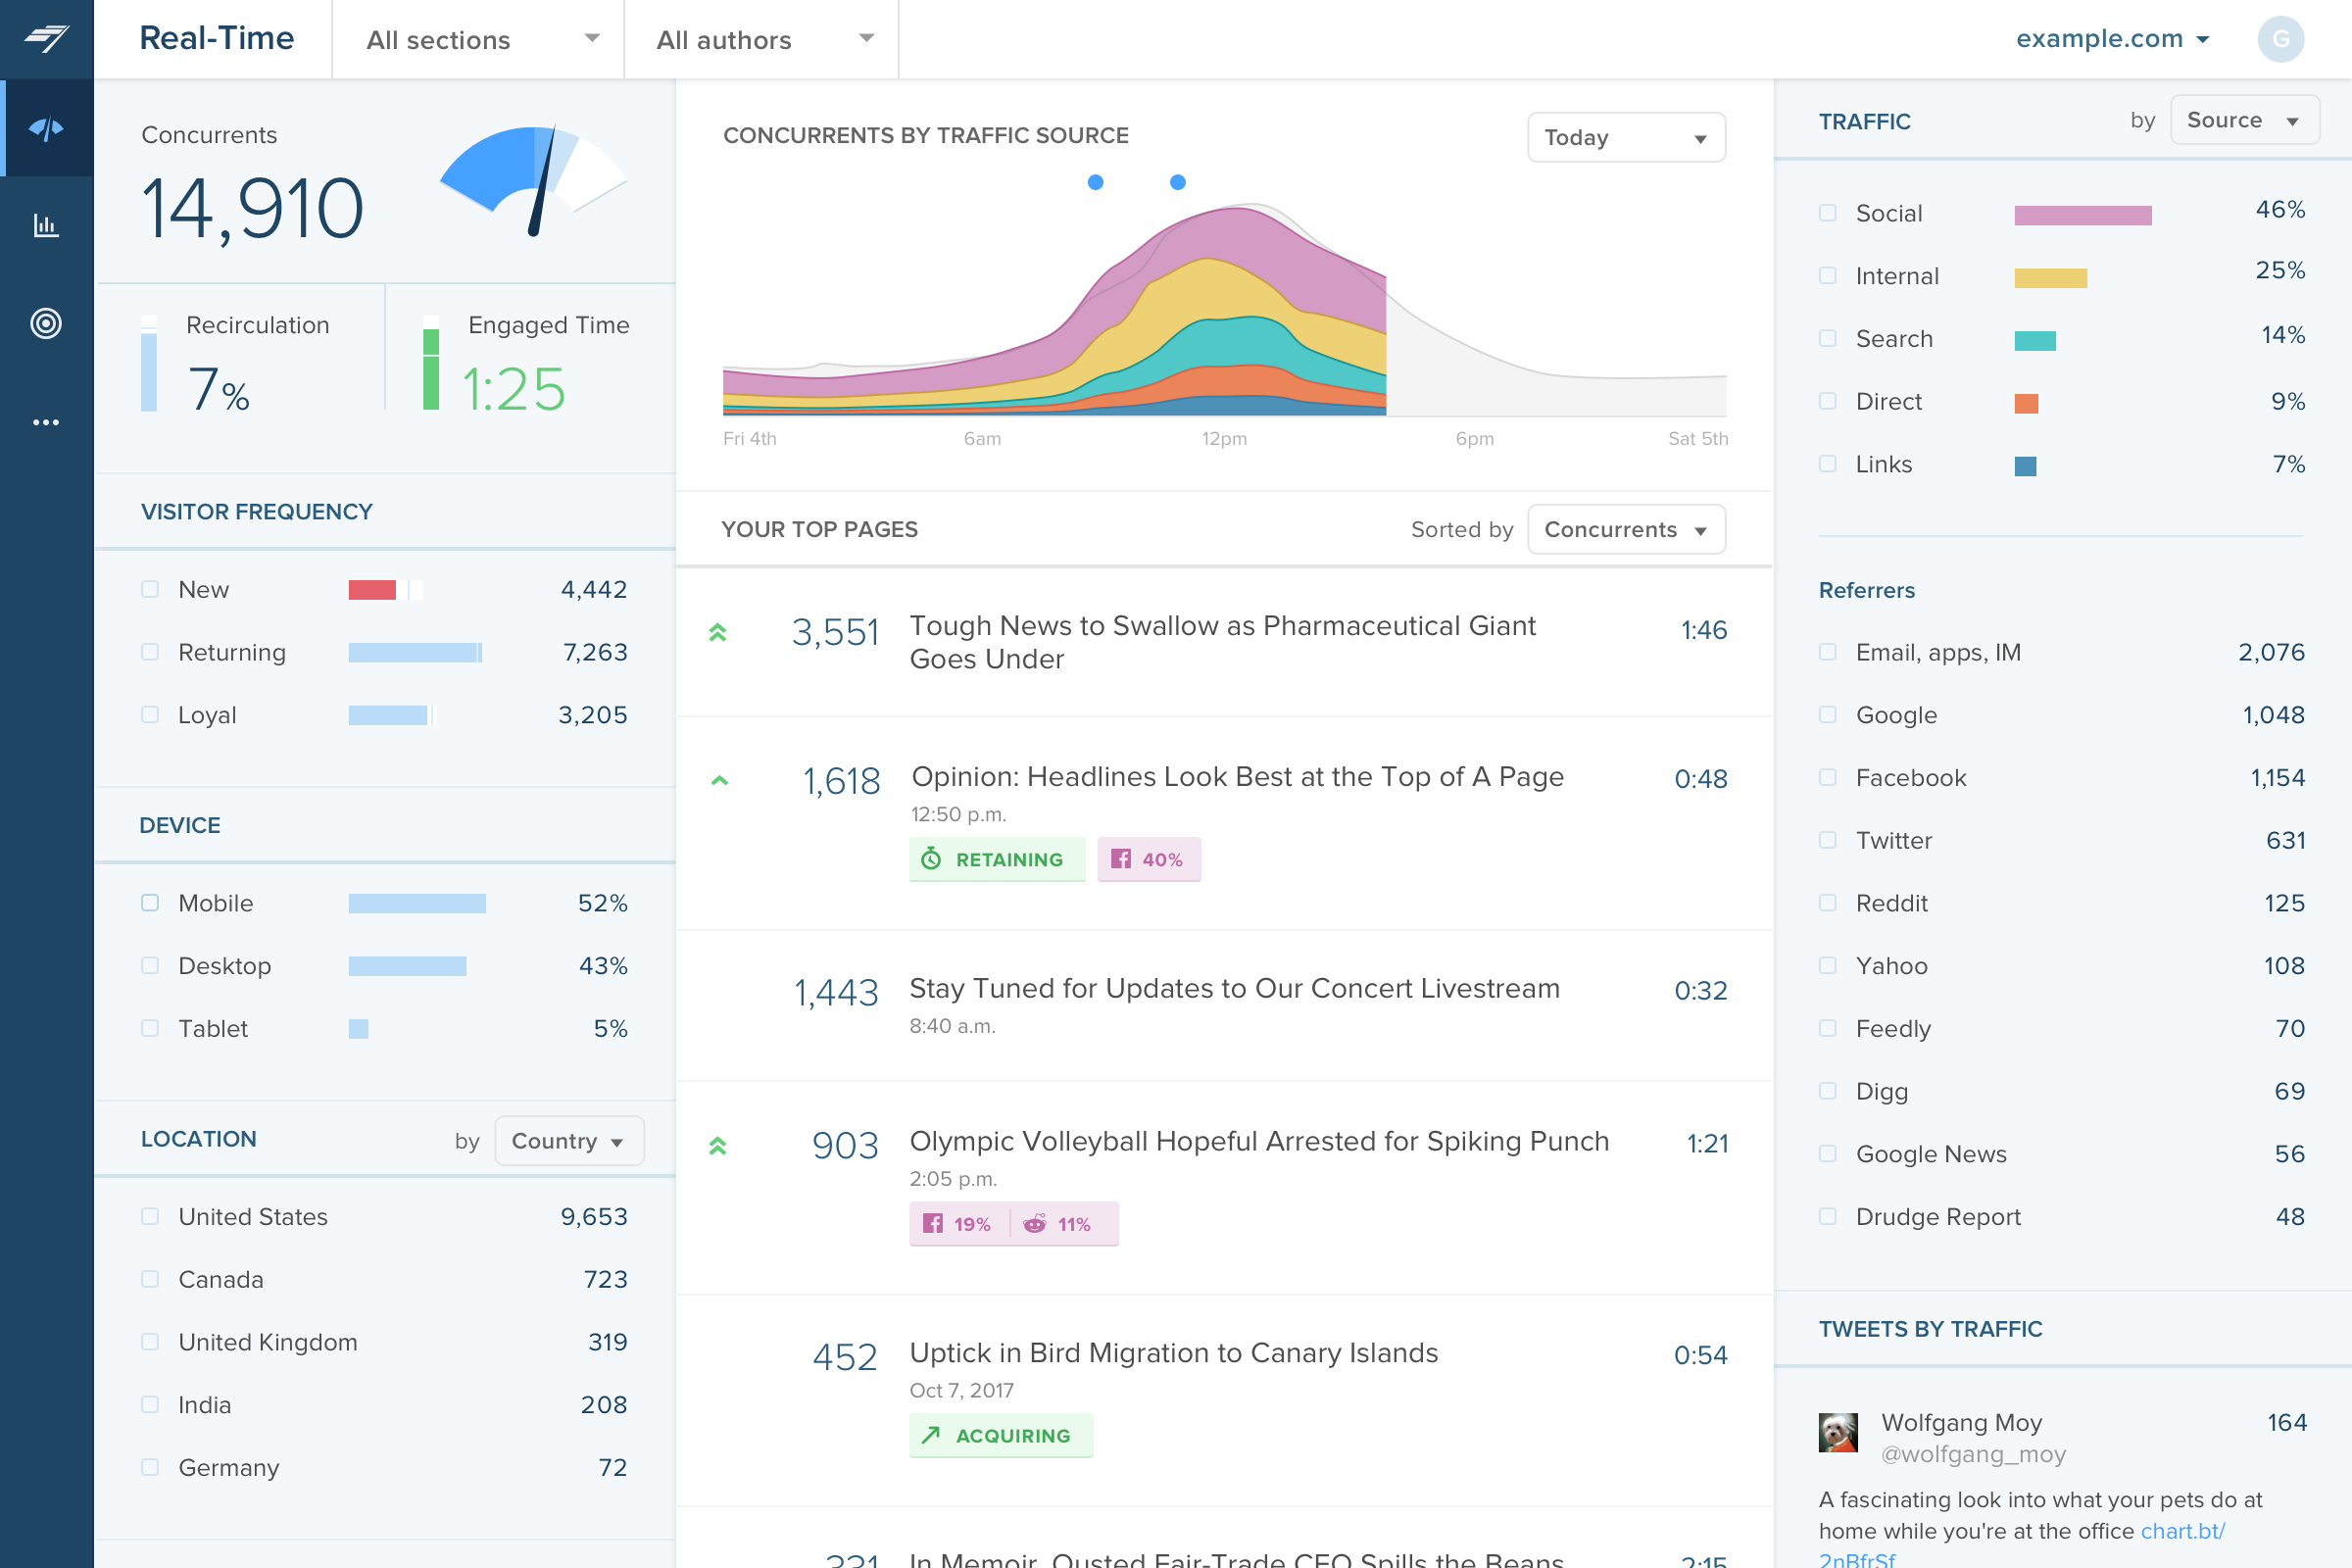
The main point of benefit is the realtime data. This is vital to our team as we are publishing a lot of content per day, so we have a busy homepage to manage and it's important to know which content is performing well. We also like to get an understanding as quickly as possible - which Chartbeat offers - of where traffic is coming from. Often we will see an example where a page is getting high traffic from Google, for example, and we know that might not need to be placed so prominently on the homepage because the traffic is arriving to us externally anyway. Without that depth of understanding what is performing best and why - updated immediately, unlike in Google Analytics now - our homepage would not be as well optimised for users coming to us direct
IBM analytics has continued to improve upon the days of being the original core metrics. After using the updated version for quite some time, it has been great at providing the needed analytics to measure ROI and goal performance for our quarterly KPI's. It has resulted in a great increase in web engagements although we are a midsize company, smaller outfits may not need such an expensive option.
IBM CXA comprises an acquisition called Tealeaf. This tool has deep heritage and this is evident in its present-day capabilities.
The Universal Behaviour Exchange or UBX puts the concept of personalisation at the forefront. The ability to combine physical (analog) and digital transactions to create the complete picture of a customer journey, is a stand out benefit.
The solution does not have to involve the purchase of software. IBM CXA can be sold as a service bundled with analytics as a service. This not only lowers the cost of ownership, it gets around one of the principal issues. Strong staff with design and analytical capability to drive the solution and deliver tangible benefits.
The seamless integration of Watson AI services to help with the heavy lifiting. Watson reinforces the analytical focus this solution has and can learn to recognise situations specific to a company.
Source of traffic needs improvement. Search and social make sense, but "internal" and "links" is a grey area. It would be helpful to define those with an organization and provide an information icon so users can easily remember what each of those buckets is tracking.
More ways to customize the real-time board. For example, with video content, that's great that I can see a user has started a video, but what is the completion rate, was that only on O&O or can that track Facebook, too?
Would like to see demo (age) information included as a way to slice the data so I can see what's working with my older and younger demo.
The user interface is in Flash, which can be very frustrating and slow at times. Apparently, this is to be transitioned in a future release.
Can only segment the last 93 days of data. Any historical segmentation beyond the 93 days must be run in Explore (which is credit based, and has its own limitations with the number of credits per month, based on the initial contract with IBM).
Reports can only display 93 days of data at a given time for custom date ranges. There are pre-programmed date ranges setup with IBM during implementation (last week, last month, last quarter etc.), but are not flexible enough to answer more specific questions.
Certain reports cannot have segments applied, making answering some simple questions a bit more tricky. For example, I can create a segment around mobile devices and apply it to the marketing channels report, but I can't create a marketing channel segment and apply it to the mobile reports.
Built in API calls allows for nice report design and automation.
I gave Chartbeat a 5 for a renewal rating, because, while it delivers clear and understandable content, Google Analytics also provides many of the same features for free. For a small to medium website, I believe it would be more cost effective to use Google Analytics. A website with a high amount of traffic, however, could merit spending the money on Chartbeat to maximize their potential.
IBM Digital Analytics is a great solution for our clients and I believe they offer the best solution for the retail space. We have access to IBM support via email or live chat and they can answer many of the reporting questions that come up. IBM is receptive to our feedback of the product so I am confident they will continue making improvements
I am able to "set it and forget it," keeping it up on my monitor for either constant checking or just keeping an eye on the numbers during the day. I'm also able to keep track of what times are perfect to post a story and which stories rack up the most traffic.
As reports are templated, the system is pretty quick. Sometimes you have to wait a bit for a report to render. Or you might have to re-load the page. But there is no real issue here and the system is on par with other similar systems.
I have had limited experience of support for Chartbeat but whenever I have needed help it has been there. Recently there was an issue of seeing different forms of data in real time - app and otherwise effectively, and the issue was being clearly dealt with and communicated back to us.
Overall, the level of support is very good and I would say it is a strong asset of the solution. However, you can sometimes feel that there is a difference of level among the support team.
Online training is really great. One of the best assets that they have. Lots of great videos, pop quizzes at the end of each module. Fantastic. Other tools have similar features, but not as good.
Omnilytics is more robust, detailed, and catered for an intermediate media user, while I think Chartbeat is a more user-friendly and beginner-oriented piece of technology. That being said, there is an impressive amount of lift for Chartbeat, and it's evident that simplicity is the key to using a software daily (which is absolutely the point in the content world).
Much of the work we did in IBM Digital Analytics could have been answered through Google Analytics, a much simpler, agile and FREE solution set. Not mention, given the vast number of Google Analytics USERS, free and actionable support is simply a click away ... this compared to IBM Digital Analytics fractured and often absent support service.
This solution can support large amount of data and transaction. The way that user management features are built, it shows it is meant for large organizations.
We spend too much time trying to work around bugs on the new UI.
We spend too much time trying to figure out how to make certain segments work because support and the knowledge center are lackluster.
Our sales rep is very unresponsive and leaves us searching for a lot of answers on our own, including what other products we may benefit from that IBM offers.