Euna Budget vs. Google Charts
Euna Budget vs. Google Charts
| Product | Rating | Most Used By | Product Summary | Starting Price |
|---|---|---|---|---|
 Euna Budget | N/A | Euna Budget (Questica Budget and OpenBook) is a budgeting tool that enables organizations to share and communicate their financials and other data, when and where they need to. Additionally, its Project Explorer for Capital Budgets allows organizations to display on an interactive map every infrastructure project, including the budget, actual spend, funding sources, and accompanying documentation, images, video, etc. | N/A | |
 Google Charts | N/A | Google Charts provides a way to visualize data on your website - for free. From simple line charts to complex hierarchical tree maps, the chart gallery provides a large number of ready-to-use chart types. The most common way to use Google Charts is with simple JavaScript that you embed in your web page. | N/A |
| Euna Budget | Google Charts | |||||||||||||||
|---|---|---|---|---|---|---|---|---|---|---|---|---|---|---|---|---|
| Editions & Modules | No answers on this topic | No answers on this topic | ||||||||||||||
| Offerings |
| |||||||||||||||
| Entry-level Setup Fee | No setup fee | No setup fee | ||||||||||||||
| Additional Details | — | — | ||||||||||||||
| More Pricing Information | ||||||||||||||||
| Euna Budget | Google Charts | |
|---|---|---|
| Top Pros | No answers on this topic |
|
| Top Cons |
|
|
| Euna Budget | Google Charts | |||||||||||||||||||||
|---|---|---|---|---|---|---|---|---|---|---|---|---|---|---|---|---|---|---|---|---|---|---|
| BI Standard Reporting |
| |||||||||||||||||||||
| Ad-hoc Reporting |
| |||||||||||||||||||||
| Report Output and Scheduling |
| |||||||||||||||||||||
| Data Discovery and Visualization |
| |||||||||||||||||||||
| Access Control and Security |
| |||||||||||||||||||||
| Mobile Capabilities |
| |||||||||||||||||||||
| Application Program Interfaces (APIs) / Embedding |
|
| Euna Budget | Google Charts | |
|---|---|---|
| Small Businesses |  MIP Fund Accounting Score 8.7 out of 10 |  BrightGauge Score 8.9 out of 10 |
| Medium-sized Companies |  Centage Score 9.6 out of 10 |  Reveal Score 9.9 out of 10 |
| Enterprises |  Oracle Fusion Cloud ERP Score 8.1 out of 10 |  Jaspersoft Community Edition Score 9.7 out of 10 |
| All Alternatives | View all alternatives | View all alternatives |
| Euna Budget | Google Charts | |
|---|---|---|
| Likelihood to Recommend | 6.0 (1 ratings) | 8.9 (61 ratings) |
| Likelihood to Renew | - (0 ratings) | 7.3 (8 ratings) |
| Usability | 6.0 (1 ratings) | 8.9 (33 ratings) |
| Availability | - (0 ratings) | 10.0 (1 ratings) |
| Performance | - (0 ratings) | 5.0 (1 ratings) |
| Support Rating | 4.0 (1 ratings) | 8.2 (33 ratings) |
| Online Training | - (0 ratings) | 5.0 (1 ratings) |
| Implementation Rating | - (0 ratings) | 10.0 (1 ratings) |
| Configurability | - (0 ratings) | 8.0 (1 ratings) |
| Ease of integration | - (0 ratings) | 10.0 (1 ratings) |
| Product Scalability | - (0 ratings) | 8.0 (1 ratings) |
| Vendor post-sale | - (0 ratings) | 10.0 (1 ratings) |
| Vendor pre-sale | - (0 ratings) | 10.0 (1 ratings) |
| Euna Budget | Google Charts | |
|---|---|---|
| Likelihood to Recommend | Euna Solutions (Formerly GTY Technology)
|  Google
|
| Pros | Euna Solutions (Formerly GTY Technology)
| Google
|
| Cons | Euna Solutions (Formerly GTY Technology)
| Google
 Sarah Bandy Executive Director |
| Likelihood to Renew | Euna Solutions (Formerly GTY Technology) No answers on this topic | Google
 Daniel Ma Web Developer |
| Usability | Euna Solutions (Formerly GTY Technology)
| Google
|
| Reliability and Availability | Euna Solutions (Formerly GTY Technology) No answers on this topic | Google
|
| Performance | Euna Solutions (Formerly GTY Technology) No answers on this topic | Google
|
| Support Rating | Euna Solutions (Formerly GTY Technology)
| Google
 Alexander Cooper RPA Developer |
| Online Training | Euna Solutions (Formerly GTY Technology) No answers on this topic | Google
|
| Implementation Rating | Euna Solutions (Formerly GTY Technology) No answers on this topic | Google
|
| Alternatives Considered | Euna Solutions (Formerly GTY Technology)
| Google
|
| Scalability | Euna Solutions (Formerly GTY Technology) No answers on this topic | Google
|
| Return on Investment | Euna Solutions (Formerly GTY Technology)
| Google
|
| ScreenShots | Euna Budget Screenshots     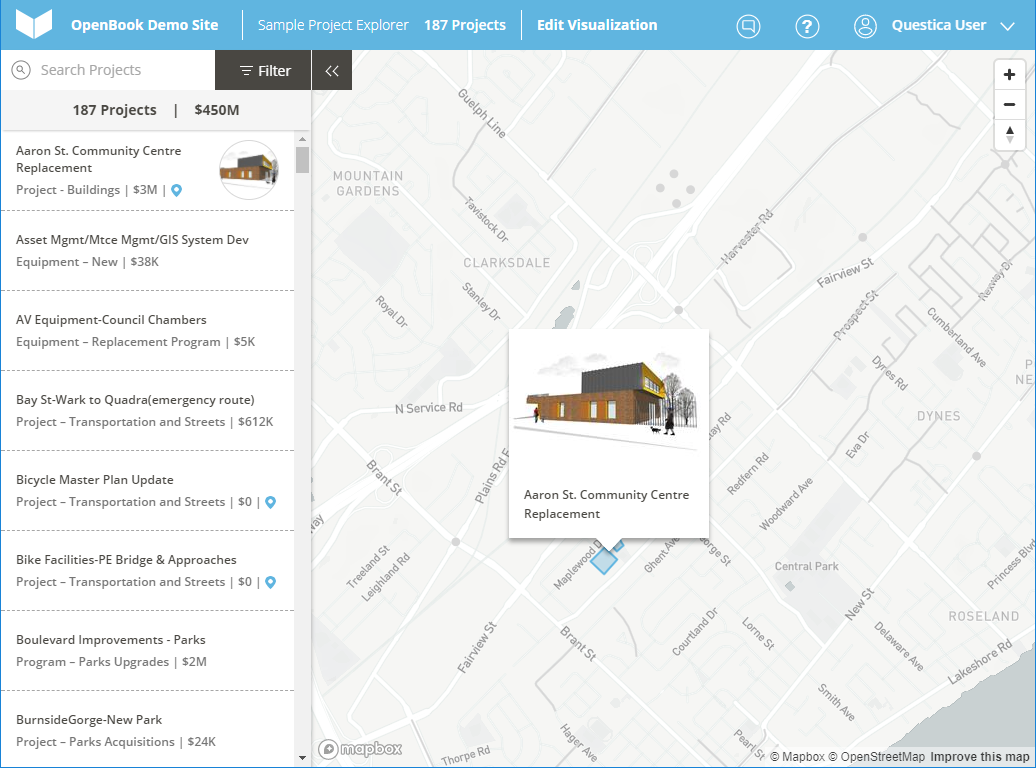 |