iCharts vs. SAP BusinessObjects Business Intelligence
iCharts vs. SAP BusinessObjects Business Intelligence
| Product | Rating | Most Used By | Product Summary | Starting Price |
|---|---|---|---|---|
 iCharts | Mid-Size Companies (51-1,000 employees) | iCharts is a Business Intelligence and Analytics solution for NetSuite. With this solution, users can transform their NetSuite data into interactive, real-time analytics without leaving their NetSuite dashboard. iCharts includes drag-and-drop chart creation and best-practice templates. The vendor’s value proposition is that iCharts accelerates an organization’s analytics strategy by empowering their team with the critical data-driven tools they need. | $10,000 per installation | |
 SAP BusinessObjects Business Intelligence | N/A | The SAP® BusinessObjects™ Business Intelligence Platform provides users with ad hoc queries, reporting, data visualizations, and analysis tools. Its integrated, unified infrastructure aims to offer scalability from one-to-many tools and interfaces on-premise, in the cloud, or as a hybrid approach. | N/A |
| iCharts | SAP BusinessObjects Business Intelligence | |||||||||||||||
|---|---|---|---|---|---|---|---|---|---|---|---|---|---|---|---|---|
| Editions & Modules |
| No answers on this topic | ||||||||||||||
| Offerings |
| |||||||||||||||
| Entry-level Setup Fee | $3,000 per installation | No setup fee | ||||||||||||||
| Additional Details | Based on number of NetSuite licenses | — | ||||||||||||||
| More Pricing Information | ||||||||||||||||
| iCharts | SAP BusinessObjects Business Intelligence | |
|---|---|---|
| Top Pros |
|
|
| Top Cons |
|
|
| iCharts | SAP BusinessObjects Business Intelligence | |||||||||||||||||||||
|---|---|---|---|---|---|---|---|---|---|---|---|---|---|---|---|---|---|---|---|---|---|---|
| BI Standard Reporting |
| |||||||||||||||||||||
| Ad-hoc Reporting |
| |||||||||||||||||||||
| Report Output and Scheduling |
| |||||||||||||||||||||
| Data Discovery and Visualization |
| |||||||||||||||||||||
| Access Control and Security |
| |||||||||||||||||||||
| Mobile Capabilities |
| |||||||||||||||||||||
| Application Program Interfaces (APIs) / Embedding |
|
| iCharts | SAP BusinessObjects Business Intelligence | |
|---|---|---|
| Small Businesses |  BrightGauge Score 8.9 out of 10 | BrightGauge Score 8.9 out of 10 |
| Medium-sized Companies |  Reveal Score 9.9 out of 10 | Reveal Score 9.9 out of 10 |
| Enterprises |  Jaspersoft Community Edition Score 9.7 out of 10 | Jaspersoft Community Edition Score 9.7 out of 10 |
| All Alternatives | View all alternatives | View all alternatives |
| iCharts | SAP BusinessObjects Business Intelligence | |
|---|---|---|
| Likelihood to Recommend | 8.0 (2 ratings) | 7.7 (71 ratings) |
| Likelihood to Renew | - (0 ratings) | 8.3 (24 ratings) |
| Usability | - (0 ratings) | 9.0 (14 ratings) |
| Availability | - (0 ratings) | 10.0 (5 ratings) |
| Performance | - (0 ratings) | 9.0 (10 ratings) |
| Support Rating | - (0 ratings) | 8.6 (16 ratings) |
| In-Person Training | - (0 ratings) | 10.0 (4 ratings) |
| Online Training | - (0 ratings) | 9.0 (2 ratings) |
| Implementation Rating | - (0 ratings) | 9.0 (8 ratings) |
| Configurability | - (0 ratings) | 9.0 (2 ratings) |
| Ease of integration | - (0 ratings) | 9.0 (1 ratings) |
| Product Scalability | - (0 ratings) | 9.0 (2 ratings) |
| Vendor post-sale | - (0 ratings) | 9.0 (1 ratings) |
| Vendor pre-sale | - (0 ratings) | 9.0 (1 ratings) |
| iCharts | SAP BusinessObjects Business Intelligence | |
|---|---|---|
| Likelihood to Recommend | iCharts, Inc.
|  SAP
|
| Pros | iCharts, Inc.
| SAP
|
| Cons | iCharts, Inc.
| SAP
|
| Likelihood to Renew | iCharts, Inc. No answers on this topic | SAP
 Robert Scrimshaw Finance Analyst III |
| Usability | iCharts, Inc. No answers on this topic | SAP
|
| Reliability and Availability | iCharts, Inc. No answers on this topic | SAP
|
| Performance | iCharts, Inc. No answers on this topic | SAP
 Dariusz Zyskowski Business Intelligence Manager |
| Support Rating | iCharts, Inc. No answers on this topic | SAP
 Saurabh Raheja Technology Lead |
| In-Person Training | iCharts, Inc. No answers on this topic | SAP
 Dharmesh Shah Associate Principal |
| Online Training | iCharts, Inc. No answers on this topic | SAP
|
| Implementation Rating | iCharts, Inc. No answers on this topic | SAP
 Priyanka Musale Sr SAP BOE/BODS Lead |
| Alternatives Considered | iCharts, Inc.
| SAP
 Michael Diaz-Suarez Help Desk Specialist |
| Scalability | iCharts, Inc. No answers on this topic | SAP
Dharmesh Shah Associate Principal |
| Return on Investment | iCharts, Inc. No answers on this topic | SAP
|
| ScreenShots | iCharts Screenshots 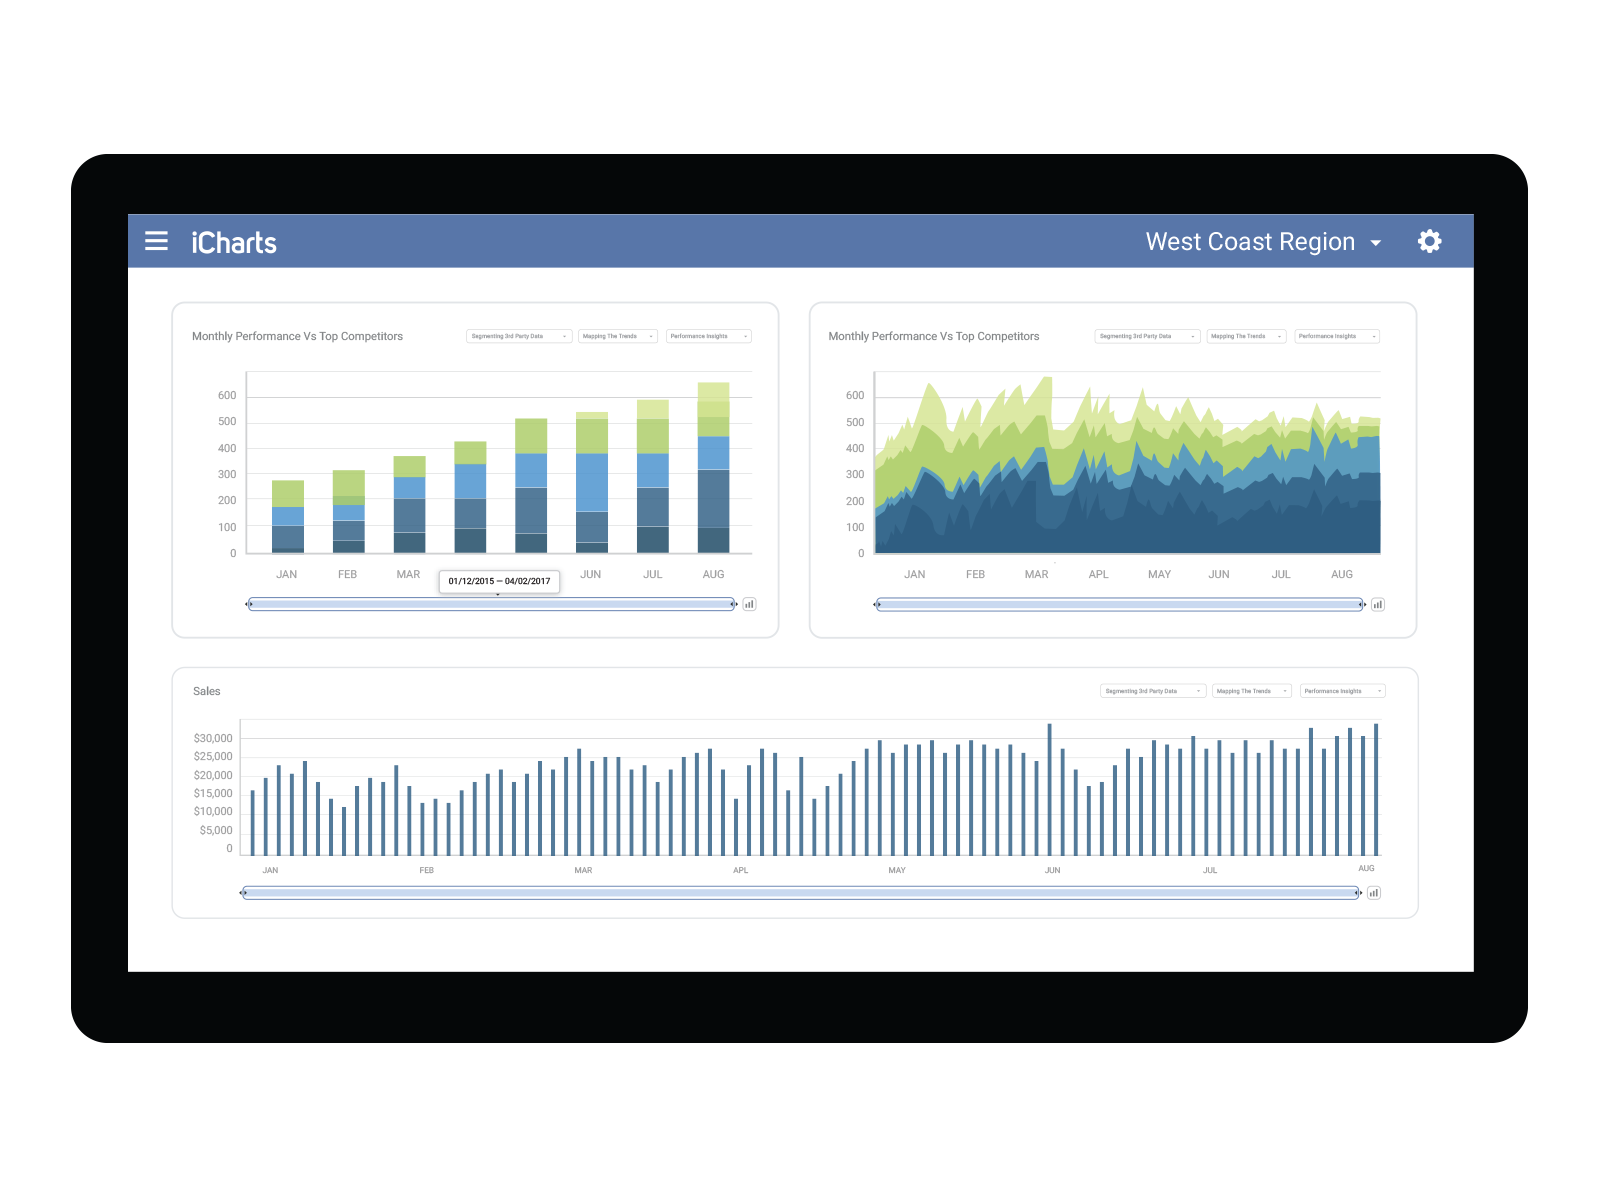 |