JarviX vs. Microsoft Power BI

Overview
ProductRatingMost Used ByProduct SummaryStarting Price
JarviX
Score 8.1 out of 10
N/A
Synergies is a cognitive application service provider that combines business knowledge, artificial intelligence technology, and software development. Their mission is to help businesses through their digital transformation journey, become leaders and innovators in their industries by unlocking the power of data in the hands of business users and decision makers. Their product, JarviX, is an AnalyticOps Platform . JarviX uses NLP…N/A
Microsoft Power BI
Score 8.4 out of 10
N/A
Microsoft Power BI is a visualization and data discovery tool from Microsoft. It allows users to convert data into visuals and graphics, visually explore and analyze data, collaborate on interactive dashboards and reports, and scale across their organization with built-in governance and security.
$10
per month per user
Pricing
JarviXMicrosoft Power BI
Editions & Modules
No answers on this topic
Offerings
Pricing Offerings
JarviXMicrosoft Power BI
Free Trial
NoYes
Free/Freemium Version
NoYes
Premium Consulting/Integration Services
NoNo
Entry-level Setup FeeNo setup feeNo setup fee
Additional Details
More Pricing Information
Community Pulse
JarviXMicrosoft Power BI
Considered Both Products
JarviX
Chose JarviX
In comparison to JarviX, Power BI offers a lot of customization for reporting purposes. However, JarviX has the advantage of saving time and built-in algorithmic analyses that integrate data visualization. JarviX’s also has a huge advantage in its natural language query …
Microsoft Power BI

No answer on this topic

Top Pros
Top Cons
Features
JarviXMicrosoft Power BI
BI Standard Reporting
Comparison of BI Standard Reporting features of Product A and Product B
JarviX
7.6
2 Ratings
8% below category average
Microsoft Power BI
7.2
138 Ratings
13% below category average
Pixel Perfect reports8.21 Ratings6.5118 Ratings
Customizable dashboards7.32 Ratings8.0138 Ratings
Report Formatting Templates7.31 Ratings7.2126 Ratings
Ad-hoc Reporting
Comparison of Ad-hoc Reporting features of Product A and Product B
JarviX
7.8
2 Ratings
4% below category average
Microsoft Power BI
7.0
139 Ratings
15% below category average
Drill-down analysis7.12 Ratings7.2138 Ratings
Formatting capabilities7.31 Ratings6.4137 Ratings
Integration with R or other statistical packages9.11 Ratings7.5102 Ratings
Report sharing and collaboration7.72 Ratings7.0134 Ratings
Report Output and Scheduling
Comparison of Report Output and Scheduling features of Product A and Product B
JarviX
7.8
1 Ratings
7% below category average
Microsoft Power BI
7.8
133 Ratings
7% below category average
Publish to Web9.11 Ratings8.1128 Ratings
Publish to PDF7.31 Ratings8.1121 Ratings
Report Versioning6.41 Ratings7.3101 Ratings
Report Delivery Scheduling8.21 Ratings8.7103 Ratings
Delivery to Remote Servers8.21 Ratings6.773 Ratings
Data Discovery and Visualization
Comparison of Data Discovery and Visualization features of Product A and Product B
JarviX
8.2
2 Ratings
2% above category average
Microsoft Power BI
7.6
135 Ratings
6% below category average
Pre-built visualization formats (heatmaps, scatter plots etc.)7.31 Ratings7.5130 Ratings
Location Analytics / Geographic Visualization9.11 Ratings7.8121 Ratings
Predictive Analytics8.32 Ratings7.4101 Ratings
Access Control and Security
Comparison of Access Control and Security features of Product A and Product B
JarviX
9.2
2 Ratings
7% above category average
Microsoft Power BI
8.2
126 Ratings
5% below category average
Multi-User Support (named login)9.62 Ratings8.2120 Ratings
Role-Based Security Model9.11 Ratings8.8102 Ratings
Multiple Access Permission Levels (Create, Read, Delete)9.11 Ratings8.4110 Ratings
Single Sign-On (SSO)9.11 Ratings8.694 Ratings
Report-Level Access Control00 Ratings7.01 Ratings
Mobile Capabilities
Comparison of Mobile Capabilities features of Product A and Product B
JarviX
9.1
1 Ratings
13% above category average
Microsoft Power BI
7.9
117 Ratings
1% below category average
Responsive Design for Web Access9.11 Ratings8.0111 Ratings
Dashboard / Report / Visualization Interactivity on Mobile9.11 Ratings7.4112 Ratings
Mobile Application00 Ratings7.493 Ratings
Application Program Interfaces (APIs) / Embedding
Comparison of Application Program Interfaces (APIs) / Embedding features of Product A and Product B
JarviX
-
Ratings
Microsoft Power BI
8.4
80 Ratings
6% above category average
REST API00 Ratings8.172 Ratings
Javascript API00 Ratings9.656 Ratings
iFrames00 Ratings8.055 Ratings
Java API00 Ratings7.946 Ratings
Themeable User Interface (UI)00 Ratings8.263 Ratings
Customizable Platform (Open Source)00 Ratings8.444 Ratings
Best Alternatives
JarviXMicrosoft Power BI
Small Businesses
BrightGauge
BrightGauge
Score 8.9 out of 10
BrightGauge
BrightGauge
Score 8.9 out of 10
Medium-sized Companies
Reveal
Reveal
Score 9.9 out of 10
Reveal
Reveal
Score 9.9 out of 10
Enterprises
Jaspersoft Community Edition
Score 9.7 out of 10
Jaspersoft Community Edition
Score 9.7 out of 10
All AlternativesView all alternativesView all alternatives
User Ratings
JarviXMicrosoft Power BI
Likelihood to Recommend
8.1
(2 ratings)
7.9
(140 ratings)
Likelihood to Renew
-
(0 ratings)
10.0
(1 ratings)
Usability
8.1
(2 ratings)
9.0
(56 ratings)
Support Rating
9.2
(2 ratings)
7.9
(52 ratings)
User Testimonials
JarviXMicrosoft Power BI
Likelihood to Recommend
Synergies Intelligent Systems
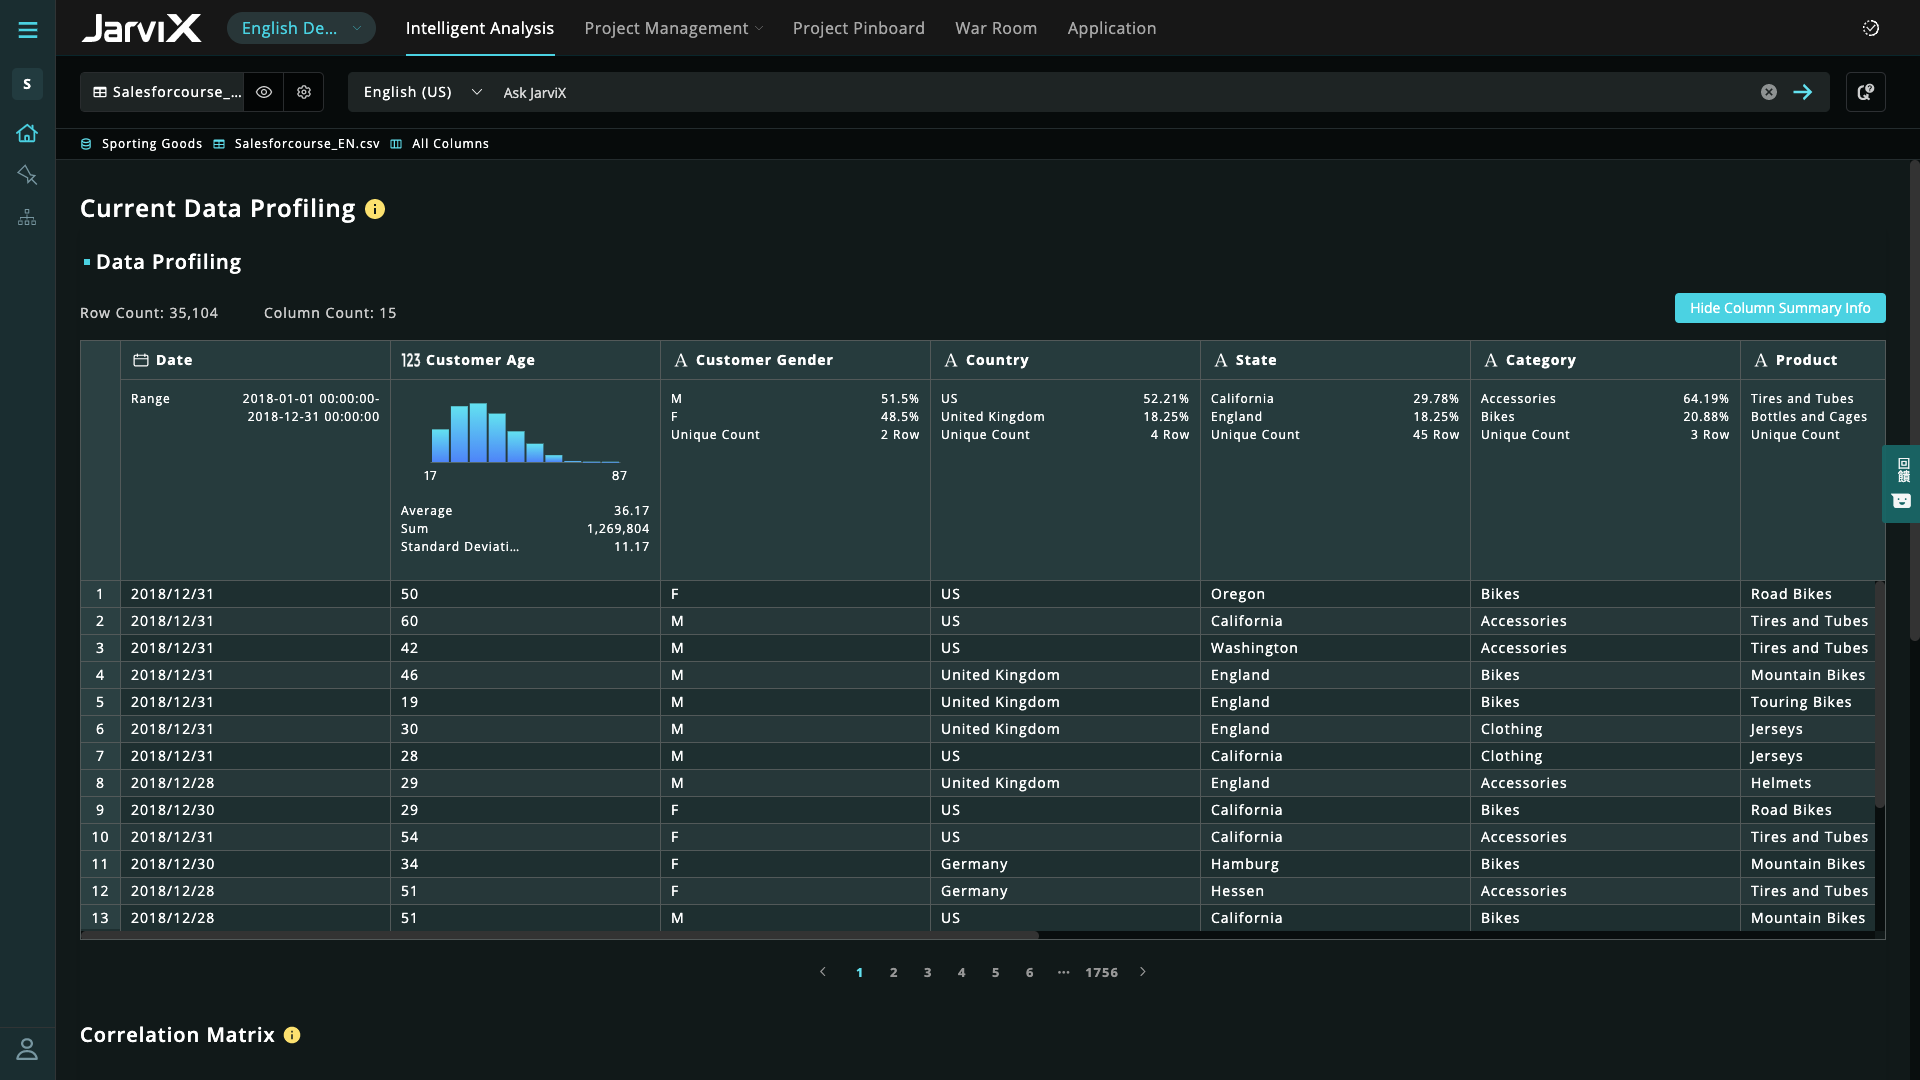
JarviX is very good at data integration, creating charts and reports for data visualization. It is really impressive that Jarvix can let our marketing team know the number of members living in a specific area in seconds. In addition, the product manager from Synergies is willing to help us with all problems we encounter. I accidentally changed one of the settings in a data table which threw the existing dashboard into chaos. However, after assistance from the product manager, we were able to successfully bring the data back to normal.
Read full review
Microsoft
In operations we use the tool for many different topics, from factory quality systems to high level reviews. We have created kind of an internal "App Store" based on Power BI where you have a lot of different dashboards for different solutions (cost, cash, health and safety, sales, factories, distribution centers...) and you as an user just need to get in that "App Store" and enter in whatever tool can be useful for you. It is open to all the operations employees and can use on demand. Also it has raised the imagination of our colleagues, as they are not only working by themselves creating new reports, but also raising fantastic ideas that can be extended for the usage of all the community.
Read full review
Pros
Synergies Intelligent Systems
  • The algorithm platform is handy
  • Time-saving
  • Real-time data update
  • Database docking
Read full review
Microsoft
  • Quickly filter and view granular data sets with easily configurable reporting figures.
  • The ability to quickly switch between tabs allows for historical data comparisons and progress tracking.
  • It's helpful to dive into the data and break it down from high levels to small.
  • Achieve actionable insights faster by using real-time data. It's incredible to have online access to reports.
Read full review
Cons
Synergies Intelligent Systems
  • There should be more flexibility in changing the data tables uploaded into JarviX. For example, it should enable users to edit the syntax of the table or change the data format of the columns without affecting the existing dashboard and charts already created using that data table.
Read full review
Microsoft
  • The desktop app is great but needs a lot of performance improvements
  • No MacOS Version for the Desktop app, this is a big limitation for business since executives prefer Macs
  • Premium Cloud Version of Power BI is awfully expensive
  • On-Premise Version of the Power BI Reports Server is bundled only with SQL Server Enterprise License and cannot be purchased separately and requires Software Assurance Subscription
  • On-Premise Power BI Report Server doesn't support ADFS, AzureAD or any Claims-Based authentication platform, a sad disadvantage for enterprises
Read full review
Likelihood to Renew
Synergies Intelligent Systems
No answers on this topic
Microsoft
I find it helpful and easy to use
Read full review
Usability
Synergies Intelligent Systems
JarviX is very easy to use, once everyone learns how to use JarviX to produce their own data reports, it reduces IT’s workload.
Read full review
Microsoft
At this point, I think we all know who has taken the lead in the business intelligence and analytics market worldwide. With fresh new updates every other day on top of an already robustly built product with all features that one can dream of is a no brainer, I feel. Microsoft will invariably be synonymous with quality and professionalism.
Read full review
Support Rating
Synergies Intelligent Systems
JarviX is very easy to use, once everyone learns how to use JarviX to produce their own data reports, it reduces IT’s workload.
Read full review
Microsoft
I can't really speak to the support overall, [but] I will say that in the almost three years I have used the system, I have only needed to contact their support team once. I think the team was helpful, but it did take some time for us to resolve the issues/ request that they had. I guess the good news is that the system is pretty stable, and I personally have rarely needed to contact their technical support team.
Read full review
Alternatives Considered
Synergies Intelligent Systems
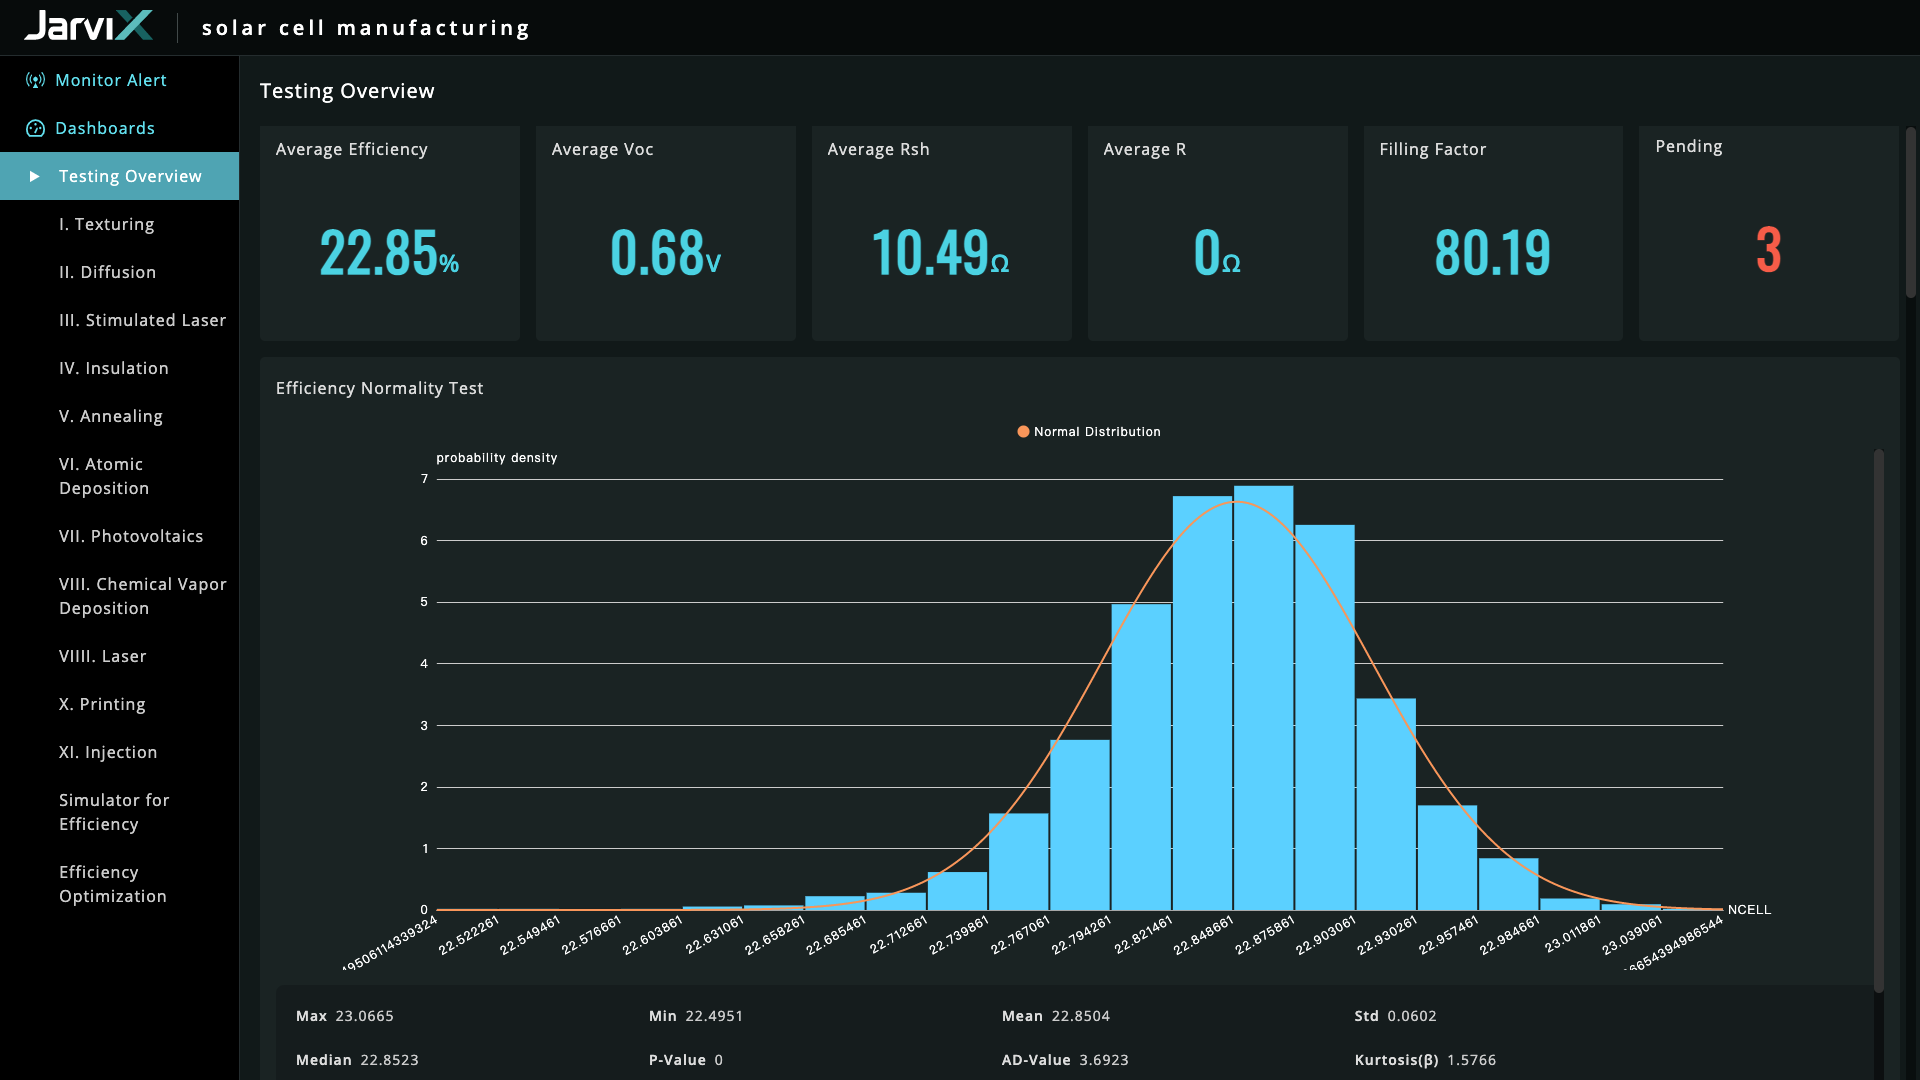
Tableau and Power BI. Obviously, they are not in the same category. Tableau and Power BI only provide data visualizations plus a little bit of analytics. JarviX not only provides data exploration, so you can find out what the problem is, as well as model management and App builder. If you only look for a dashboard, yes BI is probably enough, but if you constantly feel lacking actionable insights for actual implementations of improvements, JarviX is the choice for you.
Read full review
Microsoft
[Microsoft] Power BI is practical and effective, like a hammer for a nail, it is easy to use and produces very quickly the results that in most cases are urgently required by clients (nice reports to share on the web). To start using [Microsoft] Power BI you need a business email address, with that you create an account in Power BI Service and in less than 1 hour you will have installed Power BI Desktop, a report will have been created and it will have been published on the web .
Read full review
Return on Investment
Synergies Intelligent Systems
  • I think the best part of JarviX is that we can get the analysis results in several minutes. We spent lots of time making reports and managing our data in the past. All in all, it helps us save the time, cost, and labor of managing data.
Read full review
Microsoft
  • It helps us track and achieve company goals.
  • It shows us [our] performance in areas we could not previously track and allows us to see and work on how to improve their performance.
  • Quick easy access for executives to use in helping teams and addressing issues.
Read full review
ScreenShots

JarviX Screenshots

Screenshot of APPsScreenshot of AutoMLScreenshot of ForecastScreenshot of HomeScreenshot of Root Cause AnalysisScreenshot of War Room

Microsoft Power BI Screenshots

Screenshot of Microsoft Power BI - Turns insights into impact for business usersScreenshot of Power BI integrates easily with Microsoft 365Screenshot of Microsoft Power BI - AI-Powered CapabilitiesScreenshot of Microsoft Power BI - Copilot can be used to create reportsScreenshot of Microsoft Power BI - Data HubScreenshot of Microsoft Power BI - Scales as organizational needs grow