Panorama Necto vs. SAS Visual Analytics

Overview
ProductRatingMost Used ByProduct SummaryStarting Price
Panorama Necto
Score 8.0 out of 10
N/A
Panorama Necto is a business intelligence solution that provides enterprises with new ways to collaborate and create unique contextual connections. Some key features include: Workboards/Dashboards, Advanced Analytics, and Contextual Discovery.N/A
SAS Visual Analytics
Score 8.3 out of 10
Enterprise companies (1,001+ employees)
SAS Visual Analytics provides a complete platform for analytics visualization, enabling users to identify patterns and relationships in data that weren't initially evident. Interactive, self-service BI and reporting capabilities are combined with out-of-the-box advanced analytics so everyone can discover insights from any size and type of data, including text.
$0
Annual By Users: 5, 10, 20
Pricing
Panorama NectoSAS Visual Analytics
Editions & Modules
No answers on this topic
SAS Visual Analytics for SAS Cloud
Annual By Users: 5, 10, 20
Offerings
Pricing Offerings
Panorama NectoSAS Visual Analytics
Free Trial
YesYes
Free/Freemium Version
NoNo
Premium Consulting/Integration Services
YesYes
Entry-level Setup FeeNo setup feeNo setup fee
Additional Details—SAS Visual Statistics and SAS Office Analytics are also available as add-ons.
More Pricing Information
Community Pulse
Panorama NectoSAS Visual Analytics
Top Pros
Top Cons
Features
Panorama NectoSAS Visual Analytics
BI Standard Reporting
Comparison of BI Standard Reporting features of Product A and Product B
Panorama Necto
7.3
24 Ratings
12% below category average
SAS Visual Analytics
8.3
12 Ratings
1% above category average
Pixel Perfect reports6.022 Ratings8.012 Ratings
Customizable dashboards8.024 Ratings8.012 Ratings
Report Formatting Templates8.024 Ratings9.011 Ratings
Ad-hoc Reporting
Comparison of Ad-hoc Reporting features of Product A and Product B
Panorama Necto
8.0
24 Ratings
1% below category average
SAS Visual Analytics
8.8
13 Ratings
8% above category average
Drill-down analysis9.023 Ratings9.013 Ratings
Formatting capabilities7.024 Ratings8.013 Ratings
Integration with R or other statistical packages8.017 Ratings8.011 Ratings
Report sharing and collaboration8.022 Ratings10.012 Ratings
Report Output and Scheduling
Comparison of Report Output and Scheduling features of Product A and Product B
Panorama Necto
7.2
22 Ratings
15% below category average
SAS Visual Analytics
9.2
13 Ratings
10% above category average
Publish to Web7.821 Ratings9.012 Ratings
Publish to PDF6.722 Ratings9.013 Ratings
Report Versioning7.116 Ratings9.010 Ratings
Report Delivery Scheduling7.021 Ratings10.012 Ratings
Delivery to Remote Servers00 Ratings9.07 Ratings
Data Discovery and Visualization
Comparison of Data Discovery and Visualization features of Product A and Product B
Panorama Necto
7.7
23 Ratings
5% below category average
SAS Visual Analytics
9.7
11 Ratings
18% above category average
Pre-built visualization formats (heatmaps, scatter plots etc.)7.023 Ratings10.010 Ratings
Location Analytics / Geographic Visualization8.522 Ratings10.011 Ratings
Predictive Analytics7.620 Ratings9.010 Ratings
Access Control and Security
Comparison of Access Control and Security features of Product A and Product B
Panorama Necto
7.6
23 Ratings
12% below category average
SAS Visual Analytics
8.3
12 Ratings
4% below category average
Multi-User Support (named login)8.422 Ratings9.012 Ratings
Role-Based Security Model7.322 Ratings8.011 Ratings
Multiple Access Permission Levels (Create, Read, Delete)7.322 Ratings8.012 Ratings
Single Sign-On (SSO)00 Ratings8.08 Ratings
Mobile Capabilities
Comparison of Mobile Capabilities features of Product A and Product B
Panorama Necto
7.0
21 Ratings
13% below category average
SAS Visual Analytics
8.3
10 Ratings
4% above category average
Responsive Design for Web Access7.421 Ratings10.010 Ratings
Mobile Application6.816 Ratings9.08 Ratings
Dashboard / Report / Visualization Interactivity on Mobile7.218 Ratings9.09 Ratings
Application Program Interfaces (APIs) / Embedding
Comparison of Application Program Interfaces (APIs) / Embedding features of Product A and Product B
Panorama Necto
-
Ratings
SAS Visual Analytics
9.2
6 Ratings
15% above category average
REST API00 Ratings10.05 Ratings
Javascript API00 Ratings9.05 Ratings
iFrames00 Ratings9.05 Ratings
Java API00 Ratings9.05 Ratings
Themeable User Interface (UI)00 Ratings9.05 Ratings
Customizable Platform (Open Source)00 Ratings9.03 Ratings
Best Alternatives
Panorama NectoSAS Visual Analytics
Small Businesses
BrightGauge
BrightGauge
Score 8.9 out of 10
BrightGauge
BrightGauge
Score 8.9 out of 10
Medium-sized Companies
Reveal
Reveal
Score 9.9 out of 10
Reveal
Reveal
Score 9.9 out of 10
Enterprises
Jaspersoft Community Edition
Score 9.7 out of 10
Jaspersoft Community Edition
Score 9.7 out of 10
All AlternativesView all alternativesView all alternatives
User Ratings
Panorama NectoSAS Visual Analytics
Likelihood to Recommend
8.0
(25 ratings)
9.0
(18 ratings)
Likelihood to Renew
8.0
(17 ratings)
9.3
(3 ratings)
Usability
8.2
(2 ratings)
6.0
(1 ratings)
Support Rating
7.1
(3 ratings)
8.0
(3 ratings)
Implementation Rating
6.7
(2 ratings)
-
(0 ratings)
User Testimonials
Panorama NectoSAS Visual Analytics
Likelihood to Recommend
Panorama Software
Panorama Necto 14 is well suited where BI is built to support social collaboration so that its analytics features can be shared to improve decision making by incorporating various organizational input. Additionally it supports an infographic display for information review which is unlike most of its competitors.
Read full review
SAS
I was in a meeting with the client and there I have to show them some analytic data to them. But I was confused about how I will manage to show big data to clients with accuracy. But then the SAS Visual Analytics software helps me in presenting accurate data at the moment and it was very presentable and through that, I got the deal for that business.
Read full review
Pros
Panorama Software
  • Comes with lot of option to modify and build the smart infographic. Uses innovative pictures and charts to create the dashboards
  • Helps you identify why you are succeeding and where you should shift your focus to.
  • The maps are amazing and they just don’t act as control points rather you can populate various measures on them making it really efficient to understand the business in geographical info graph
Read full review
SAS
  • Provides the flexibility to the end user to slice and dice the data.
  • Anyone can make predictive models with the help of in-built algorithms without the need to write a single line of code or knowledge of what's under the hood of algorithms.
  • The feature to simply ask a question related to data and getting a response in form of text, chart or graph is amazing.
Read full review
Cons
Panorama Software
  • This tool is relatively new to the current competitive BI market. Many organizations or business analyst are not yet aware of it's eye catching features.
  • Need more enhancement for predictive analysis.
  • Publishing reports as email attachment and mail server configuration is a little complicated process.
Read full review
SAS
  • SAS is relatively expensive when compared to other BI tools and requires a large amount of upfront fee which becomes an issue for smaller organizations.
  • UI for the dashboards looks a little date in comparison to competitors like Tableau and Microstrategy.
  • Integration with other open source software like Python needs to be built in.
Read full review
Likelihood to Renew
Panorama Software
Some features are very basic and sometimes you can't add your own SQL query for custom reports. For Macs and Blackberry users this application is not helpful. Non-languages are not supported in info-graphics. They need to improve their forecast analysis. Report sharing is limited among the portal users only
Read full review
SAS
SAS really is the cutting edge in Business Intelligence. That is all they do! They are constantly coming out with new products, product upgrades, and their tech support is second to none. In addition, their support of Education has made our ability to acquire their product possible.
Read full review
Usability
Panorama Software
It provides all the features that are required and some that are not the basic requirements, but they represent a great additional capabilities, not available within the similar products
Read full review
SAS
SAS BI is good for creating reports and dashboards and then sharing it with the users. It also has ability to manage access to the reports and dashboards but somehow with most of the world moving to open source languages R, Python and Julia, SAS BI feels to be archaic in terms of feature set and integrations it allow[s]. Also, comparing it with other Business Intelligence tools like Tableau and Microsoft BI, the functionality of SAS BI is very limited and doesn't justify the pricing.
Read full review
Support Rating
Panorama Software
Support provider are very attentive.
Read full review
SAS
When you call tech support, you are immediately routed to a person who can answer your question. Often they can answer on the spot. However, if they cannot, you are given a track number and then followed up with. There have been times when I have had multiple track numbers open and they will actually TRACK YOU DOWN to ensure that your problem has been resolved. Issues do not fall into black holes with SAS. They are also willing to do a WebEx with you to diagnose the problem by seeing your environment, which is always helpful.
Read full review
Implementation Rating
Panorama Software
Everything went smoothly, we didn't have any unexpected issues
Read full review
SAS
No answers on this topic
Alternatives Considered
Panorama Software
This is the next generation BI tool, which will be very helpful for small and medium businesses to kick start data exploration and visualization of their diverse databases, with less intervention from IT. This tool is more end user centric and gives way more power to the end user to perform data analysis
Read full review
SAS
SAS Business Intelligence is not the cream of the crop for business intelligence applications, but it is not far behind. The software is generally easier to apply than most other business intelligence software. Additionally, SAS Business Intelligence runs smoothly in the background when making real-time updates. With that said, the software is not as efficient of many of the other business intelligence software applications that have been on the market for longer than this one.
Read full review
Return on Investment
Panorama Software
No answers on this topic
SAS
  • SAS Visual Analytics licensing cost should be reduced to enable users to use it in mass scale.
  • More statistical and mathematical equations and theories should be converted into SAS functions for reusing.
  • Because of enriched ETL and reporting capabilities SAS Visual Analytics is most preferred by business users.
Read full review
ScreenShots

Panorama Necto Screenshots

Screenshot of Screenshot of Screenshot of Screenshot of Screenshot of Screenshot of

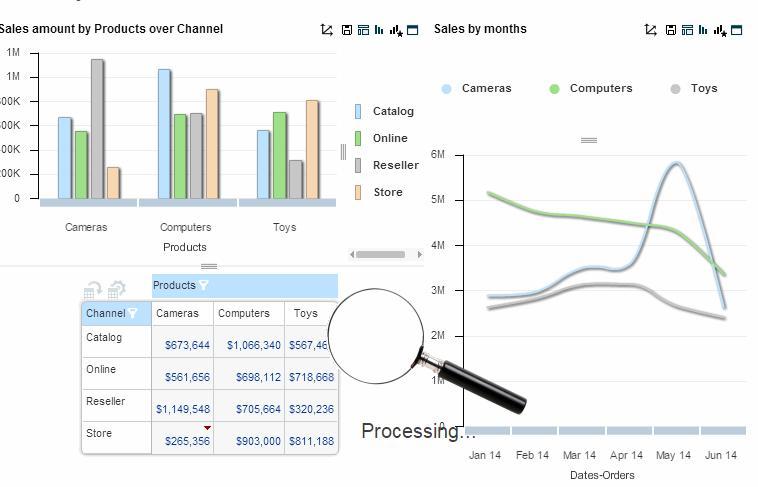
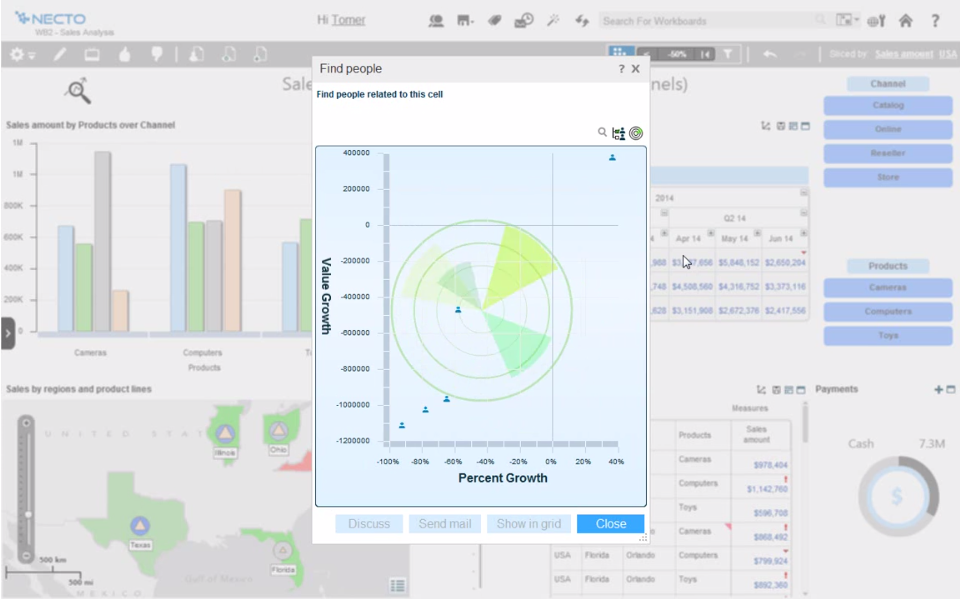
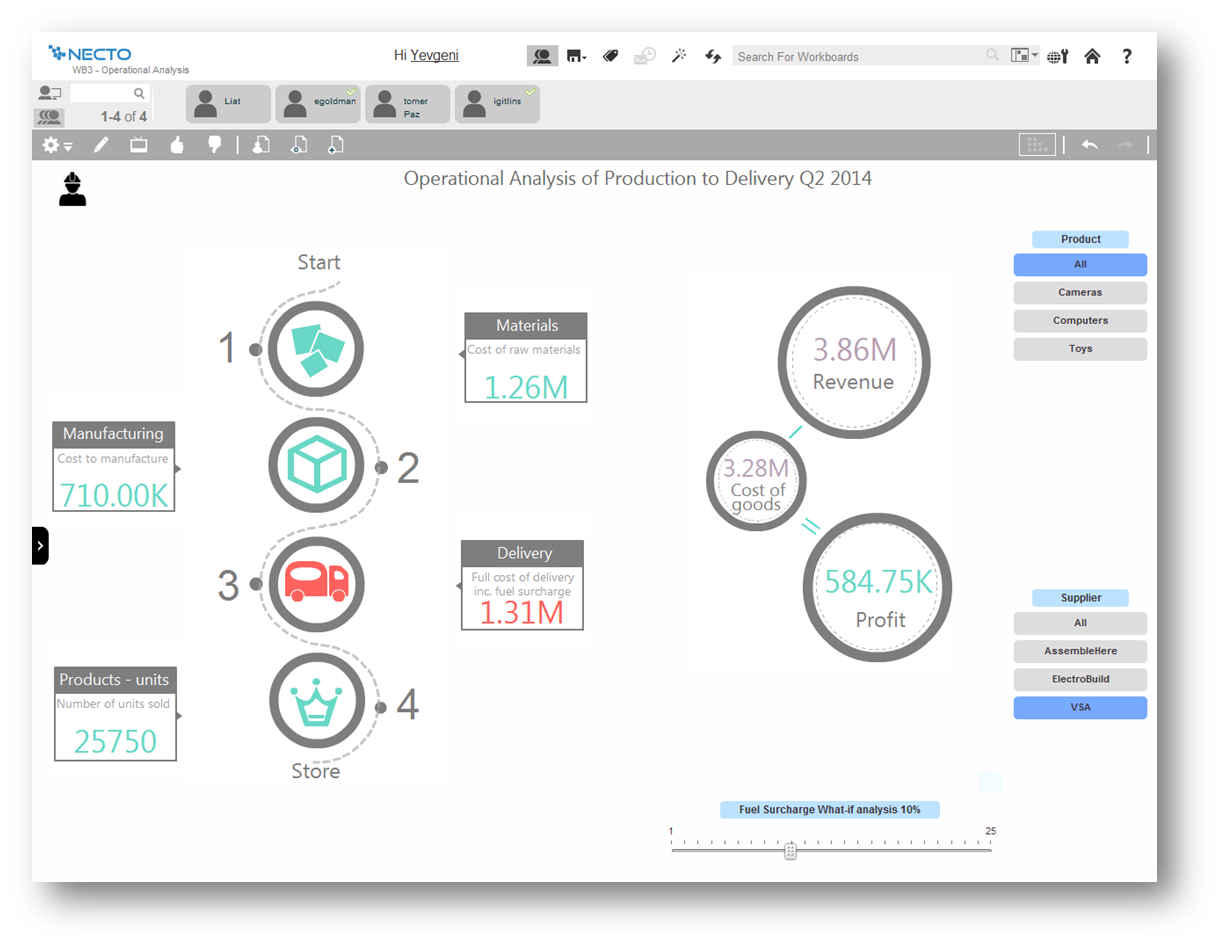
SAS Visual Analytics Screenshots

Screenshot of Explore your data using analytics and interactive data visualizations.