Overview
What is Board?
BOARD is a business decision-making platform for organizations of any size. BOARD hosts several business modeling, planning, and analysis all in one cloud-based platform.
Planning is much better with Board
Board App Review, Highly Recommended for Your Search of CPM & BI tool
Board review
Board really provides tremendous business growth for early-stage startup company’s founders & teams.
Board detailed review.
Best Forecasting and Analytics Tool
Tailored Business Planning & Solutions Provider Application
Board - reporting, budgeting and effective data sharing instantly
Grow Your Organization with Board
Excellent BI Platform for visualising data from variety of Datasources.
Board: Perfect BI and Forecasting Platform with reporting capability.
Great Financial Planning Tool
Simple and efficient BI tool
Great solution for BI and CPM!
Board is just GREAT!
Awards
Products that are considered exceptional by their customers based on a variety of criteria win TrustRadius awards. Learn more about the types of TrustRadius awards to make the best purchase decision. More about TrustRadius Awards
Popular Features
- Report sharing and collaboration (90)7.474%
- Customizable dashboards (94)6.666%
- Drill-down analysis (97)6.666%
- Formatting capabilities (95)5.858%
Reviewer Pros & Cons
Pricing
What is Board?
BOARD is a business decision-making platform for organizations of any size. BOARD hosts several business modeling, planning, and analysis all in one cloud-based platform.
Entry-level set up fee?
- No setup fee
Offerings
- Free Trial
- Free/Freemium Version
- Premium Consulting/Integration Services
Would you like us to let the vendor know that you want pricing?
36 people also want pricing
Alternatives Pricing
What is Budgyt?
Budgyt is a platform made to simplify business budgeting. With built-in functions designed for data integrity, team collaboration, and scenario planning & analysis, Budgyt is presented as an optimized budgeting experience that rids users of complex, error-prone spreadsheets and the time-consuming…
What is Kepion Planning?
Kepion is a cloud planning & analytics software company that connects all organizations' teams under a single view of their business performance. We enable more intelligent decisions to be made by companies about their financial and operational future. Kepion global offices and partners deliver…
Product Demos
State Board Virgin Relaxer Demo and retouch for Cosmetology
Flexure Gripper and Demo Board
3 Best Software's to Create White Board Animation Videos !! Demo
NEW Crayola Ultimate Light Board || Crayola Product Demo
Features
BI Standard Reporting
Standard reporting means pre-built or canned reports available to users without having to create them.
- 6.6Pixel Perfect reports(81) Ratings
Pixel Perfect reports are highly-formatted reports with graphics and ability to preview the report before printing.
- 6.6Customizable dashboards(94) Ratings
Customizable dashboards are dashboards providing the builder some degree of control over the look and feel and display options.
- 6.6Report Formatting Templates(87) Ratings
Ad-hoc Reporting
Ad-Hoc Reports are reports built by the user to meet highly specific requirements.
- 6.6Drill-down analysis(97) Ratings
Drill down analysis is the ability to get to a further level of detail by going deeper into the hierarchy.
- 5.8Formatting capabilities(95) Ratings
Ability to format output e.g. conditional formatting, lines, headers, footers.
- 6.6Integration with R or other statistical packages(67) Ratings
Integration with the open-source R predictive modeling environment.
- 7.4Report sharing and collaboration(90) Ratings
Report sharing and collaboration is the ability to easily share reports with others.
Report Output and Scheduling
Ability to schedule and manager report output.
- 6.6Publish to Web(80) Ratings
- 7.4Publish to PDF(88) Ratings
- 6.6Report Versioning(81) Ratings
Report versioning is the assignment of version numbers to each version of a report to help in tracking.
- 7.4Report Delivery Scheduling(79) Ratings
Report Delivery Schedule is the ability to have reports delivered to a destination at a specific data and time.
Data Discovery and Visualization
Data Discovery and Visualization is the analysis of multiple data sources in a search for patterns and outliers and the ability to represent the data visually.
- 6.6Pre-built visualization formats (heatmaps, scatter plots etc.)(73) Ratings
Pre-built visualization formats are canned visualization types that can be selected to visualize different kinds of data.
- 7.4Location Analytics / Geographic Visualization(67) Ratings
Location analytics is the visualization of geographical or spatial data.
- 7.4Predictive Analytics(65) Ratings
Predictive Analytics is the ability to build forecasting models based on existing data sets.
- 7.3Pattern Recognition and Data Mining(1) Ratings
Pattern recognition and data mining mean the ability to recognize hidden patterns in large quantities of data.
Access Control and Security
Access control means being able to determine who has access to which data.
- 7.4Multi-User Support (named login)(73) Ratings
Named model access means that users have access based on name and password.
- 7.4Role-Based Security Model(70) Ratings
Role-based access means that access to data is determined by job or position in the corporation.
- 6.6Multiple Access Permission Levels (Create, Read, Delete)(73) Ratings
Multiple access permission levels means that different levels of users have different rights.
- 8.1Single Sign-On (SSO)(70) Ratings
Allows users to use one set of login credentials to access multiple applications
Mobile Capabilities
Support for mobile devices like smartphones and tablets.
- 5.8Responsive Design for Web Access(73) Ratings
Web design aimed at producing easy-to-read sites across a range of different devices.
- 5.7Mobile Application(58) Ratings
A dedicated app for iOS and/or Android.
- 5.8Dashboard / Report / Visualization Interactivity on Mobile(69) Ratings
In-app dashboard reports and data visualization.
Budgeting, Planning, and Forecasting
These activities are designed to assist with both data-driven operational, short-term planning and strategic long term planning
- 7.3Long-term financial planning(75) Ratings
3-5 year financial plan with cashflow.
- 7.4Financial budgeting(79) Ratings
Annual budget for revenue and operating expenses, headcount/compensation, capital expenses, projects, etc.
- 6.6Forecasting(76) Ratings
Combining actuals and budgets, rolling forecasts, driver-based models.
- 8.2Scenario modeling(72) Ratings
Financial or operational modeling of alternate future states and planning for each.
- 7.5Management reporting(78) Ratings
Budget vs. actual or forecast, P&L’s, performance over time, between products etc.
Consolidation and Close
Consolidation of data from multiple entities with currency management, reporting and audit trails.
- 8.1Financial data consolidation(71) Ratings
Consolidating data from several entities into a single statement using US GAAP, IFRS or other standards.
- 6.4Journal entries and reports(72) Ratings
Ability to enter journal entry adjustments and produce reports showing all journal entries for a specific period.
- 7.4Multi-currency management(62) Ratings
Ability to handle foreign currency conversions during consolidation.
- 7.4Intercompany Eliminations(63) Ratings
Matching and elimination of intercompany revenue, expenses, and balance sheet accounts.
- 7.4Minority Ownership(57) Ratings
Consolidate financials full or partial ownership of subsidiaries, equity pick-up.
- 6.6Local and consolidated reporting(69) Ratings
Ability to report against individual business entities and the consolidated umbrella entity.
- 6.5Detailed Audit Trails(66) Ratings
Tracing changes to data and processes that were run.
Financial Reporting and Compliance
Financial statements and regulatory filings
- 7.3Financial Statement Reporting(73) Ratings
Creation and production of balance sheets, income statements, cash flows, other schedules
- 6.6Management Reporting(77) Ratings
Tools facilitating creation of internal ad hoc or standard reports.
- 6.6Excel-based Reporting(74) Ratings
Ad hoc or formatted reports using MS Excel.
- 7.4Automated board and financial reporting(71) Ratings
Tools to help automate creation of regulatory reports such as SEC filings and board books.
- 6.5XBRL support for regulatory filing(51) Ratings
Support for the XBRL standard reporting format for exchanging financial data.
Analytics and Reporting
Dashboards and scorecards for KPI monitoring and benchmarking
- 7.4Personalized dashboards(79) Ratings
Create custom dashboards and reports without the help of IT or administrators.
- 7.4Color-coded scorecards(75) Ratings
Track and analyze performances with interactive, color-coded balanced scorecards.
- 6.6KPIs(77) Ratings
Select from a library of more than 6,000 key performance indicators, and incorporate KPIs into your planning process.
- 7.4Cost and profitability analysis(73) Ratings
Cost and profitability analysis provides data for business decision making.
- 7.4Key Performance Indicator setting(72) Ratings
Ability to set key performance indicators for measuring progress towards goals.
- 7.3Benchmarking with external data(63) Ratings
CPI, daily exchange rates, industry KPIs. with scheduled data refreshes.
Integration
Ability to integrate with external applications.
- 7.3Flat file integration(77) Ratings
Integration of flat files like text documents and comma separated files
- 7.4Excel data integration(76) Ratings
Ability to integrate directly with Excel data.
- 7.3Direct links to 3rd-party data sources(72) Ratings
Integration with external applications like ERP, CRM, HCM
Product Details
- About
- Competitors
- Tech Details
- FAQs
What is Board?
Board is a Decision-Making platform that aims to empower people from more than 2,000 companies worldwide to have a transformative impact on
their business by deploying Planning, Predictive Analytics and Business
Intelligence applications on a single unified platform. Board allows companies
to explore and leverage their data to produce a complete view of business information, gain actionable insights, and
achieve full control of performance across the entire organization. With Board,
organizations can manage and control their entire decision-making process from
goal setting down to operational execution through the ability to analyze,
simulate, plan, and predict.
The vendor states that global enterprises such as H&M, BASF, Burberry, Toyota, Coca-Cola, KPMG, and HSBC have deployed end-to-end decision-making applications at a fraction of the time and cost associated with traditional solutions. Board International was founded in 1994 and has now 25 offices around the world and a global reseller network. Board has been implemented in over 100 countries.
Board Features
Budgeting, Planning, and Forecasting Features
- Supported: Long-term financial planning
- Supported: Financial budgeting
- Supported: Forecasting
- Supported: Scenario modeling
- Supported: Management reporting
Consolidation and Close Features
- Supported: Financial data consolidation
- Supported: Journal entries and reports
- Supported: Multi-currency management
- Supported: Intercompany Eliminations
- Supported: Minority Ownership
- Supported: Local and consolidated reporting
- Supported: Detailed Audit Trails
Financial Reporting and Compliance Features
- Supported: Financial Statement Reporting
- Supported: Management Reporting
- Supported: Excel-based Reporting
- Supported: Automated board and financial reporting
- Supported: XBRL support for regulatory filing
Analytics and Reporting Features
- Supported: Personalized dashboards
- Supported: Color-coded scorecards
- Supported: KPIs
- Supported: Cost and profitability analysis
- Supported: Key Performance Indicator setting
- Supported: Benchmarking with external data
Integration Features
- Supported: Flat file integration
- Supported: Excel data integration
- Supported: Direct links to 3rd-party data sources
BI Standard Reporting Features
- Supported: Pixel Perfect reports
- Supported: Customizable dashboards
- Supported: Report Formatting Templates
Ad-hoc Reporting Features
- Supported: Drill-down analysis
- Supported: Formatting capabilities
- Supported: Predictive modeling
- Supported: Integration with R or other statistical packages
- Supported: Report sharing and collaboration
Report Output and Scheduling Features
- Supported: Publish to Web
- Supported: Publish to PDF
- Supported: Report Versioning
- Supported: Report Delivery Scheduling
Data Discovery and Visualization Features
- Supported: Pre-built visualization formats (heatmaps, scatter plots etc.)
- Supported: Location Analytics / Geographic Visualization
- Supported: Predictive Analytics
- Supported: Support for Machine Learning models
- Supported: Pattern Recognition and Data Mining
- Supported: Integration with R or other statistical packages
Access Control and Security Features
- Supported: Multi-User Support (named login)
- Supported: Role-Based Security Model
- Supported: Multiple Access Permission Levels (Create, Read, Delete)
- Supported: Report-Level Access Control
- Supported: Table-Level Access Control (BI-layer)
- Supported: Field-Level Access Control (BI-layer)
- Supported: Single Sign-On (SSO)
Mobile Capabilities Features
- Supported: Responsive Design for Web Access
- Supported: Mobile Application
- Supported: Dashboard / Report / Visualization Interactivity on Mobile
Board Screenshots
Board Video
Board Competitors
Board Technical Details
Deployment Types | On-premise, Software as a Service (SaaS), Cloud, or Web-Based |
---|---|
Operating Systems | Windows, Linux, Mac |
Mobile Application | Apple iOS, Android, Windows Phone |
Supported Countries | Americas, Europe, Middle East, Asia Pacific |
Supported Languages | English, Italian, German, French |
Frequently Asked Questions
Board Customer Size Distribution
Consumers | 0% |
---|---|
Small Businesses (1-50 employees) | 0% |
Mid-Size Companies (51-500 employees) | 30% |
Enterprises (more than 500 employees) | 70% |
Comparisons
Compare with
Reviews and Ratings
(230)Community Insights
- Business Problems Solved
- Pros
- Cons
- Recommendations
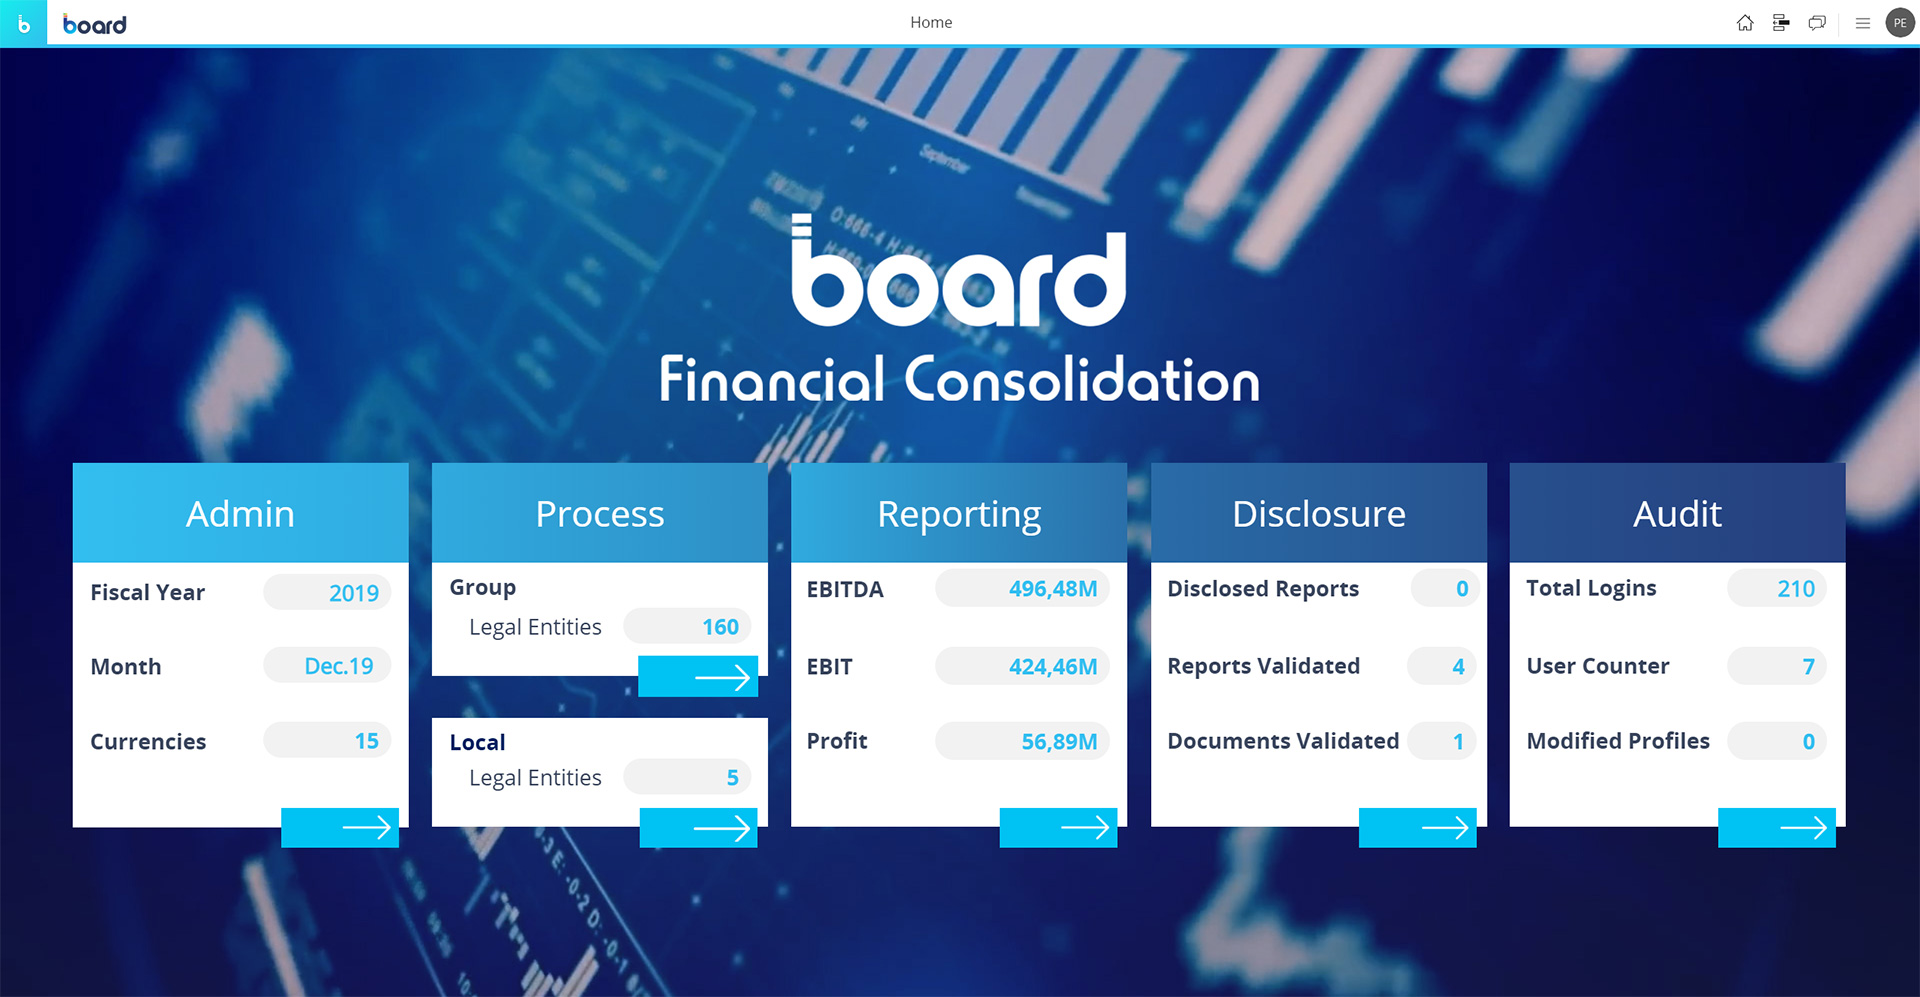
BOARD is a versatile software that has been used by users across various departments and industries to meet their business intelligence, reporting, and planning needs. Users have found BOARD to be a valuable tool for consolidating data, generating reports, and making better-informed business decisions. It has been effective in a range of use cases, such as traditional BI/MI reporting, CPM capabilities, financial calculations, budgeting, forecasting, and sales analysis.
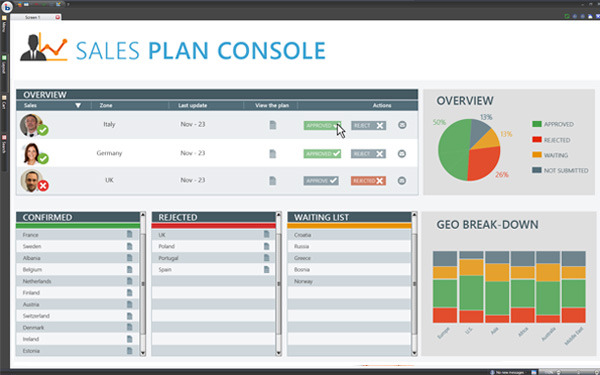
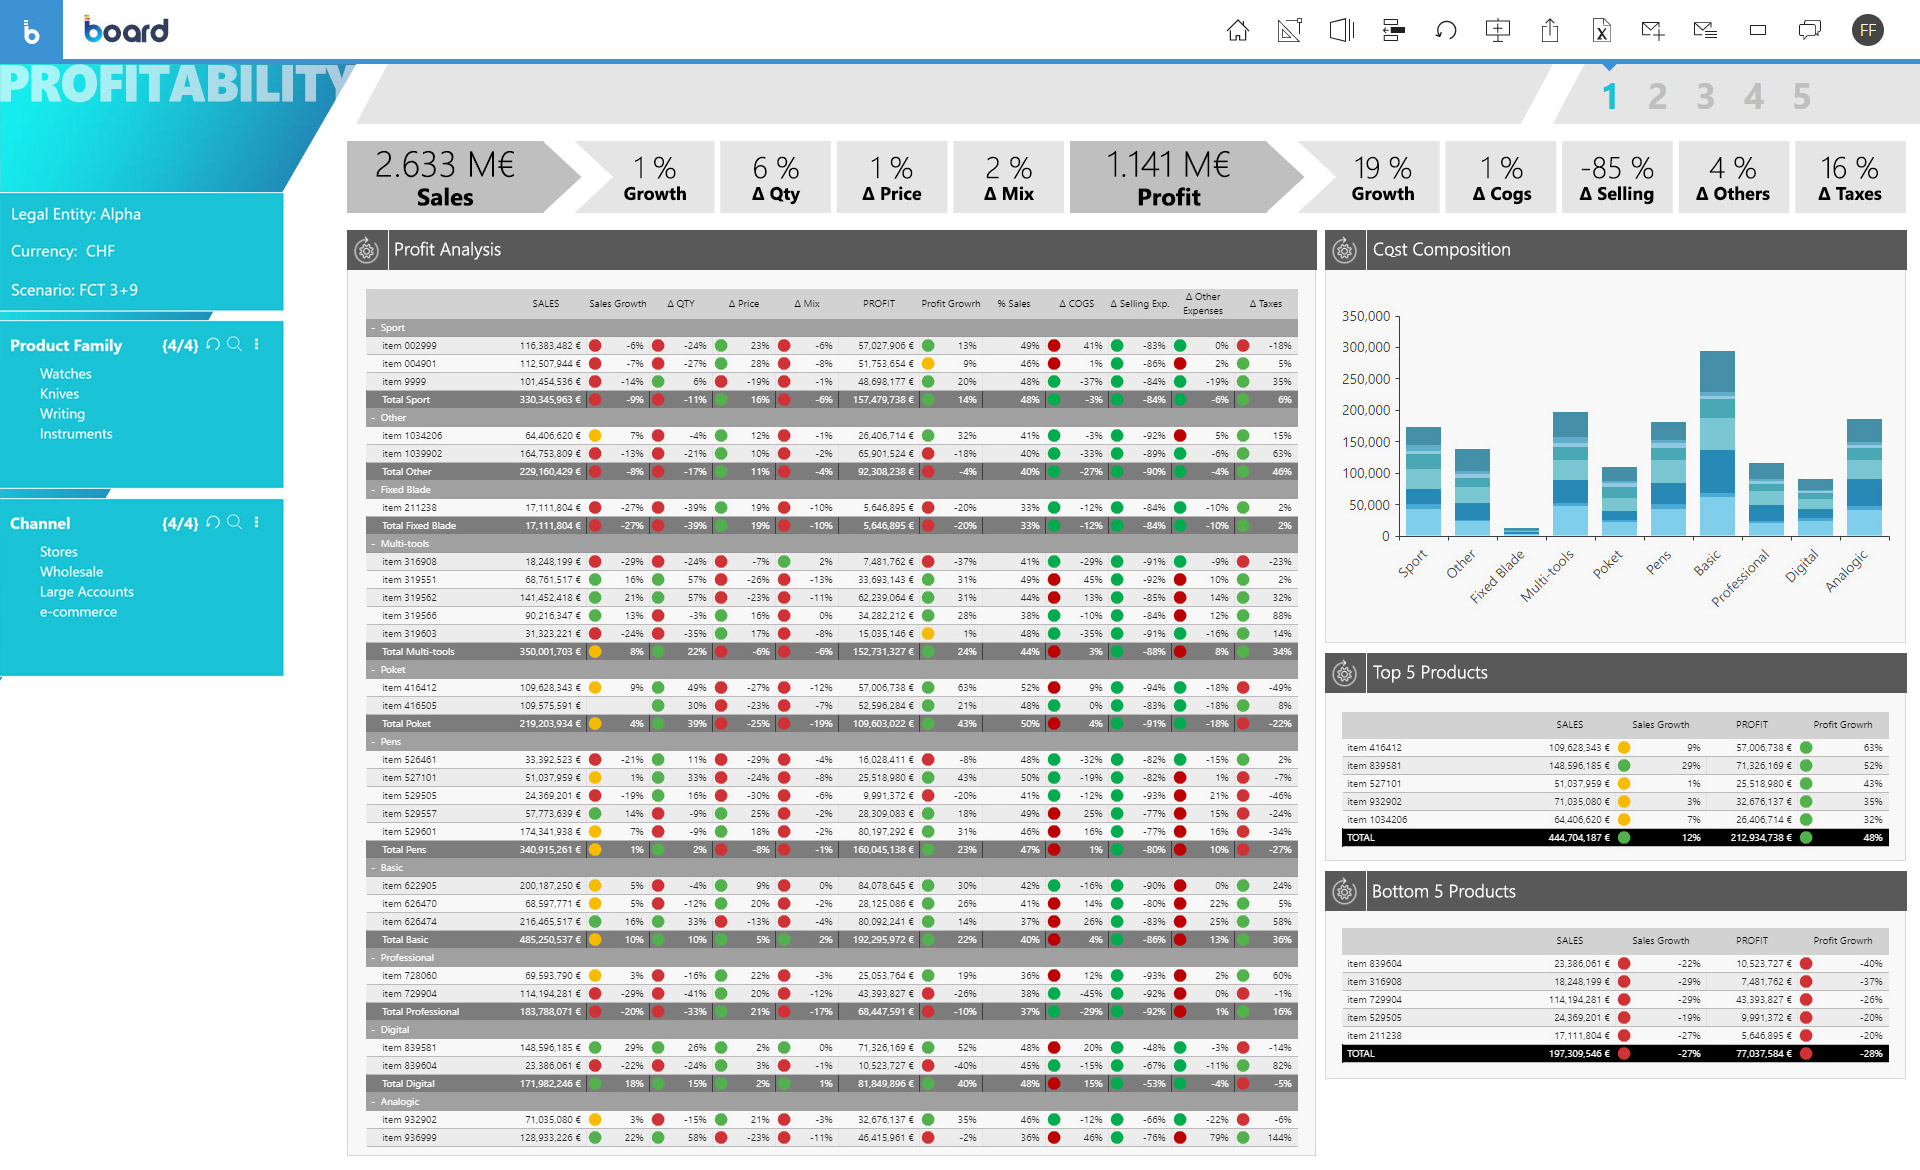
One of the key advantages of BOARD is its ability to import raw data and run insightful analysis, allowing users to generate well-structured reports. This enables teams to build interactive dashboards for a better understanding of the data and cater to non-technical users. The software also offers easy planning around the generated reports, saving time and aiding in better decision-making.
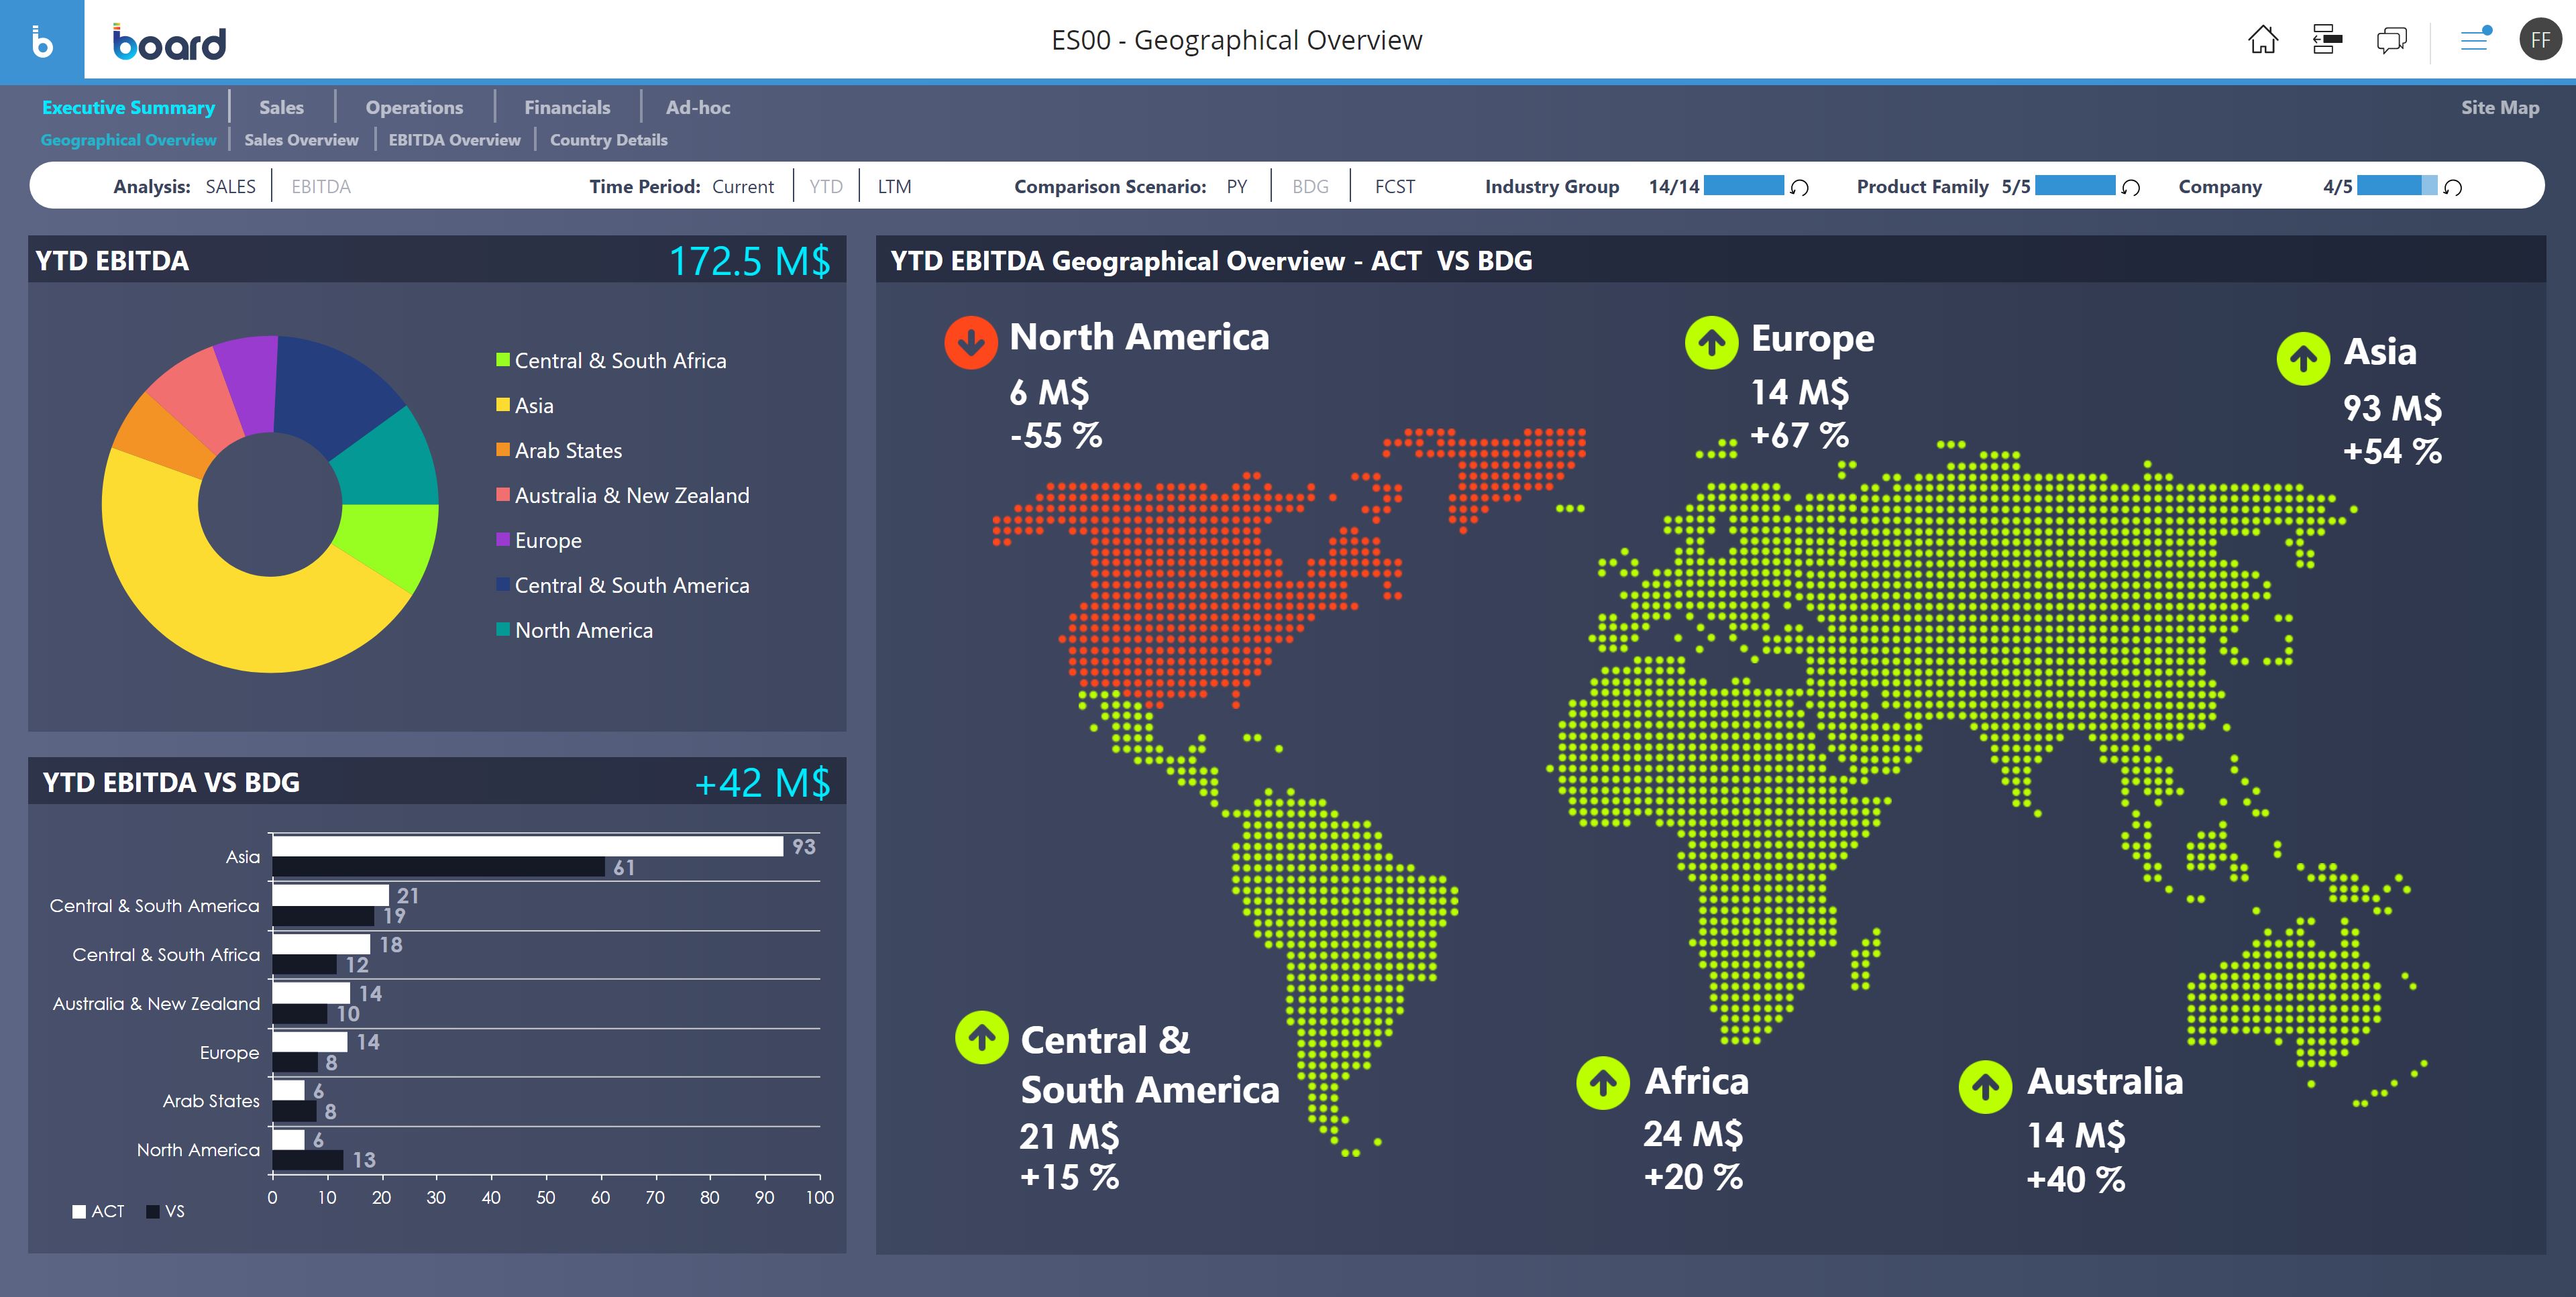
Another notable feature of BOARD is its integration with other marketing platforms, allowing users to collect multiple data insights effortlessly. The powerful data visualization tools offered by BOARD enable users to create visually appealing reports and quantitative analytics easily. Additionally, it serves as a front end for ERP systems and provides reliable analytics combination software.
Users have praised the ease of getting started with BOARD features and its user-friendly interface that simplifies various business operations. The software is highly regarded for its stability and quick workflow in generating visualizations. Its versatility makes it popular among different departments within an organization, including finance, sales, logistics, marketing, customer service, IT management, and human resources.
Overall, BOARD has proven to be an invaluable tool for organizations looking to consolidate their data, analyze performance metrics, create impactful reports and dashboards, streamline financial processes, enhance decision-making capabilities, automate tasks, forecast and budget effectively. With its comprehensive functionalities and user-centric approach, BOARD helps organizations improve productivity, optimize resource allocation, achieve business goals through improved business intelligence strategies.
Easy to Use and Intuitive Interface: Users found the software to be highly intuitive and easy to use, with a user-friendly interface and quick access to reports. Many reviewers stated that the software was straightforward to navigate, making it easy for users of all levels of technical expertise.
Drag and Drop Feature for Data Analysis: The drag and drop feature was highly praised by users for making data analysis easier. Several reviewers mentioned that this feature allowed them to build complex dashboards without the need for extensive programming knowledge or coding skills.
Automation Capabilities: The software's automation capabilities were highly regarded by users as they saved time and improved efficiency. Many reviewers appreciated the automated functions for generating reports, which eliminated the need for manual processes and increased productivity.
Smaller Community: Some users have mentioned that the community for this software is smaller compared to its competition, limiting opportunities for collaboration and support. They have expressed concerns about the availability of resources, forums, and user-generated content specific to this software.
Weak ETL Function: Several reviewers have stated that the ETL function of this software is not as strong as other tools in terms of performance and capabilities. Users have faced challenges in data extraction, transformation, and loading processes. They have reported slower processing times, limited functionality for complex transformations, and difficulties with handling large datasets.
Lack of Regular Updates: Many users have expressed their disappointment with the lack of regular updates from the software provider. This has led to a stagnant feature set and an inability to take advantage of new advancements in technology. Users have mentioned missing out on bug fixes, performance improvements, and new features that could enhance their experience with the software.
Users commonly recommend Board based on their experiences with the platform. Here are the three most common recommendations:
-
Use the self-hosted version of Board instead of the cloud version, as it provides more control and flexibility in managing the platform.
-
Before making a purchase decision, try out the trial version of Board to get acquainted with its features and assess its suitability for your specific needs.
-
To effectively use Board, leverage the available videos and guides provided by the platform to learn how to maximize its functionalities.
Overall, users find Board to be a valuable tool that offers flexibility, functionality, and affordability. They appreciate its ability to centralize data, automate processes, generate reports, and create dashboards that executives find useful. Whether for budgeting, data analysis, or decision-making, Board is recommended by users across a range of industries and company sizes.
Attribute Ratings
- 9.1Likelihood to Renew7 ratings
- 9.1Availability1 rating
- 9.1Performance1 rating
- 7.7Usability5 ratings
- 8Support Rating3 ratings
- 7.3In-Person Training2 ratings
- 7.2Implementation Rating3 ratings
- 9.1Configurability1 rating
- 9.1Product Scalability1 rating
- 9.1Ease of integration1 rating
- 9.1Vendor pre-sale1 rating
- 9.1Vendor post-sale1 rating
- 9Data Visualization1 rating
- 6.6Data Sources98 ratings
- 6.6Data Sharing and Collaboration90 ratings
Reviews
(1-25 of 45)- The Customer service support is exceptional.
- The product understands & adapts your need so quickly.
- Data models for business intelligence can be created quickly and easily with BOARD's BI solution
- Works well for financial budgeting & goals setting
- Works slow with heavy data.
- formatting gets changes while exporting to excel.
You can quickly see results and make a wide variety of reports, tables and graphs with it.
Board really provides tremendous business growth for early-stage startup company’s founders & teams.
- Cloud data analysis services for business & corporate user's maintaining purpose
- Data driving from one format to another format within a minutes without any data analysis experience.
- Financial data validation process, analysis services, making the annual reports are providing according to our business operation demand.
- Board Cloud services have to providing with multiple devices from local & multi Cloud environment zone with Shortest DNS record
- Need to integrate with many other Microsoft 360 services with customaization data Model
- I also missing the 2Mfa authentication security & own server configuration based software data syncing between Board room & AWS cloud services.
Board detailed review.
- DIscussions Threads.
- Notify if you receive response on your question.
- Learning section.
- The UI is really basic and can be improved.
- It is really had to find right threads at times.
- Ability to attach various documents to the threads.
Grow Your Organization with Board
- Due to top-notch customer support and helpful, knowledgeable staff, integration with our databases was smooth
- Using spreadsheets to visualize reports, web-based data entry engines, and clearer insights helped a lot for an effective budgeting process
- Sometimes the software is not so quick during report creation activities. I wish this tool is more flexible and so quick during the creation of reports
- Although we can easily set up a database from scratch, I would like more advanced documentation on database design
- Board can handle huge amounts of data. It provides the cloud database and Premise Database choice to the customers/users.
- Easy connectivity/integration to a variety of data sources like Excel, CSV, Oracle, SQL, etc.
- Variety of Reports and data visualisation capabilities.
- Missing Inbuilt scheduler for tasks. Need to import tasks.
- Should support multiple pricing models as per company size.
- Security/Authentication process and structure is a bit complex to figure out.
- Standardisation of data from various disparate sources.
- Depth of analysis and ability to drill down and up to get a high-level and low-level picture of analyzed data.
- Variety and customisations in Reporting.
- Quite challenging to work and place various different objects, even after using align for report designers.
- Error messages are vague at times requiring additional efforts to find the root cause of the problem.
- Learning curve for someone new to platform.
Simple and efficient BI tool
- Reporting
- Powerfull analysis
- Create your own dashboard
- Customer support
- Connecting to API
Board is just GREAT!
- Consolidation between different sectors of the company.
- Helps us plan for the future with clear data.
- Our HR is using it to report on employee performance.
- The UI could be more up to date.
- Not as fast and smooth as they claim it to be. Still not that bad.
- I don't think its features are as advanced as it claims to be.
Board - A Go-To BI Tool
- It has the ability to handle large amounts of data. Board provides the cloud database which ensures faster deployments and greater security.
- The customers have both the choices either On-Premises or On Cloud since Cloud is more popular nowadays I would recommend Cloud to opt for.
- The users can get along with Board quite easily because of it's easy to use UI and Drag & Drop features.
- The complex calculations of reports is done so easily and quickly with the help of inbuilt functions.
- There is less learning content about Board on free platforms which can be increased just like other products have currently.
- The updates for On-Premise and Cloud should be in sync both should receive updates from time to time.
- It has all the features and functionalities to make it a powerful tool, need to look into the pricing side of it.
Board is a very successful and reliable CPM tool
- Easy to deploy.
- Real time tracking.
- Visualization dashboards.
- Analytics and performance tracking.
- Integration with several CRM and ERP tools.
- Customer service.
- Tutorial for beginners.
- Pricing
Power BI and CPM tool
- Presenting and interpreting data with reports and attractive dashboards.
- UI UX is very good and easy to navigate which makes it easy or user-friendly.
- Fast and stable, the performance of the board i.e. loading time is very smooth.
- The app can be integrated with the web browser.
- Overall customer experience can be improved by making it fast response and more available.
- Data imports from various aggregators is super easy with easy roll-ups.
- The UI is super simplistic and dashborad/report creation is very good.
- Their customer support is really good and it's a Saas Platform with quick and easy deployment.
- Recently we have started using their analytics feature for forecasting and making purchase decision for reservations. So far so good.
- Data modelling is a bit of hassle and more documentation will be helpful.
- It would be great to have actionables configured right of the dashboard. The idea is to look at report and take an action right there (eg: sending email or Slack notification)
- The integration with Office 365 leaves a lot to be desired.
The product doesn't have its own intelligence or recommendation system. Hence if you have a specific use-case for it, you probably would like to consider other standard tools in market which do more than what a BI tool can.
- Predictive analytics and performance tracking
- creating real time tracking and visualization dashboards
- integrate with various CRM tools and ERP applications to upload data into its database
- easy to deploy and install
- low cost of maintenance
- costly for low architectural complexity organizations
- requires training to use model and use of functionality
- connectors requires to connect to various data sources
Crazy powerful in the best ways
- HUGE data loads
- I can throw files directly onto the page without needing to dig through the "open" search window
- Analytics is displayed in great visual graphics
- Initial implementation is tedious (I get its necessary, but still...)
- Layout design is tricky too
- My experience with customer service took forever
- Easy to import and map historical financial data
- Comes with a fast and reliable cloud platform
- Consolidated view of all the financial processes
- Real-time dashboard with insightful visualization and interactive simulation
- Board can improve on its documentation and tutorials for beginners
- It should provide faster support to the tickets
- Not suitable for government offices due to privacy concerns
Powerful Business Intelligence Tool
- Board used for financial budgeting and forecasting of my organization and decision-making process
- Board is used for making decisions on our services, such as student feedback, staff feedback, and how our service needs to be improved, calculated by the features using Board
- Board is used for creating management reports.
- Improve the user interface for more simple way.
- Database designing is a bit hard so it's better to improve this part.
- Better to improve the security features of the product such as role management.
A reliable and powerful BI platform for better financial planning and decision making!
- The user interface is intuitive and easy to navigate
- You don't need programming knowledge to create dashboards which is a great flex for non-technical users
- You can seamlessly convert large, raw, and complex data to meaningful reports to visualize better and plan to act accordingly
- The financial forecasting that Board provides post-analysis is truly reliable
- The support turn-around time for critical issues could be improved a bit. We had to wait a few days for a couple of critical issues to be solved.
- The cost is a little bit on the higher end of the spectrum. This could be a deal-breaker for startups and small companies.
- Apart from a few minor issues, there isn't much to dislike about Board. It's a reliable platform that does the job of enabling better decision-making.
Less Appropriate: I really can't think of a situation where I would not recommend Board to a business that wants to thrive, but as I've mentioned in the dislikes, the cost is a bit high, and that could be a dealbreaker for startups and small companies.
Board has Great Compatibility
- Board adapts quickly to the services that we integrate to our work, so being a software that we can manage through tools such as an API, with which we generally cover integrations with certain services, we get a better quality of work to make specific operations, for example, planning, although this is only with certain services, as it happens to be with Basecamp.
- Board does not have a library that is useful for the administrative management of the work extensions we use, which keeps quite limited the ease with which we can interconnect the work with the work done in other planning services, and at the same time also limits the number of plugins we can use when working, so we emphasize that its ability to connect is very good, as discussed in the previous section, but only with some services.
BI and CPM, best of both worlds
- Generating reports from multiple sources.
- Creating interactive dashboards.
- Planning
- Automating regular task models.
- Should deliver regular updates.
- Needs 3D modelling implemented.
- Faster report generation with bulk data.
- Marketing of multiple content.
- Gathering the effective sales data insights.
- Content migration and predictive data analytics are excellent.
- Professional user is required to deeply configure the Board Cloud functionalities.
- Importing multiple marketing content as a new user.
- Deployment process takes time to complete.
BOARD for MIS and presentations
- Create meaningful graphs.
- Presentation.
- Analysis.
- Backward support for version upgrades.
- Training can be improved to explain the logic behind type of implementation.
- Keep current licensing model.
Board capabilities are unmatched when analyzing the massive datas and presenting it.
- Data analysis
- Data security
- Data presentation
- At a personal level as it is recently implemented no problem has been reported except for the initial setup problem. However, the shortcoming if any will come when it is going to be used rigorously in [the] coming year.
- Easy budgeting on Board capabilities.
- Account access control is well managed through Board.
- Quality data management services via Cloud services.
- Deep manipulation of Board tools is very tricky.
- Full Board configuration may required a full experienced Engineer.
- Data transfer across different websites.
Wonderful Business Reports Distribution and Data Collection Package.
- Its performance management ability is fantastic.
- Simple content management on Cloud services.
- Visualizing of business data is excellent.
- The deployment on Cloud to the new users.
- Learning the advanced Board configurations.
- The processing of large business data.
Modern Forecasting Dashboard
- Best business forecasting solution.
- Very intuitive dashboard which helps reduce 100s of emails to the product team and stakeholders.
- Easy to customize reports.
- Some more user guides that are freely available would be nice.