

TrustRadius Insights
Clear Analytics has gained popularity among users for its ability to integrate multiple data sources and facilitate data analytics. Users …
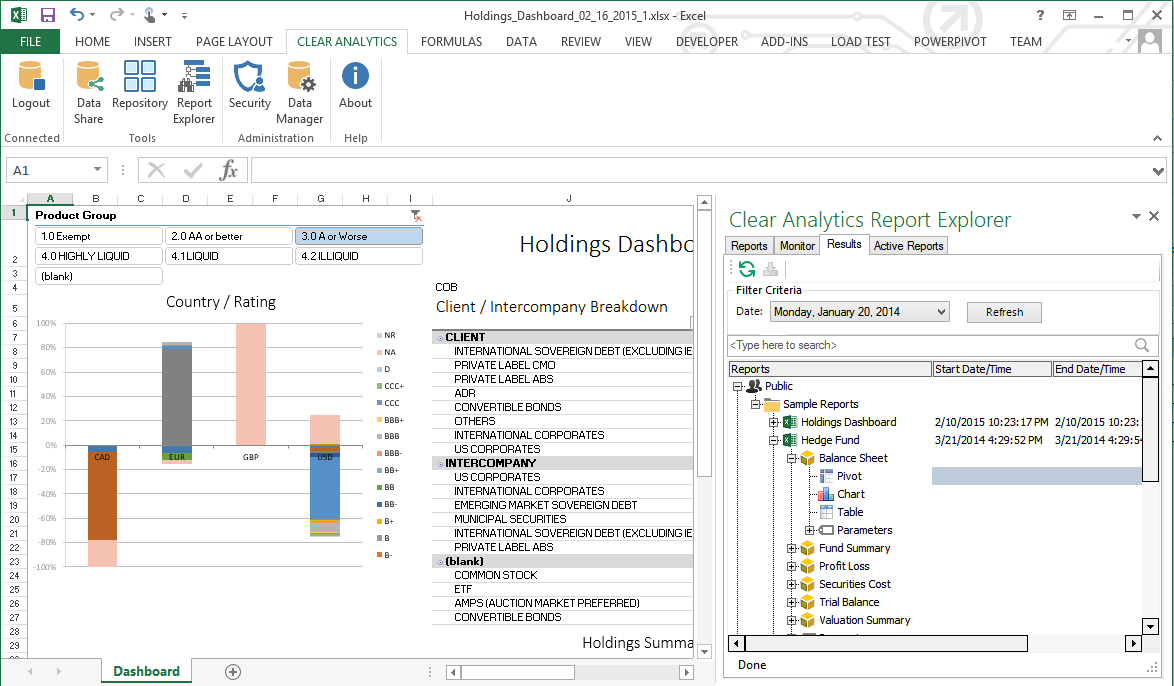
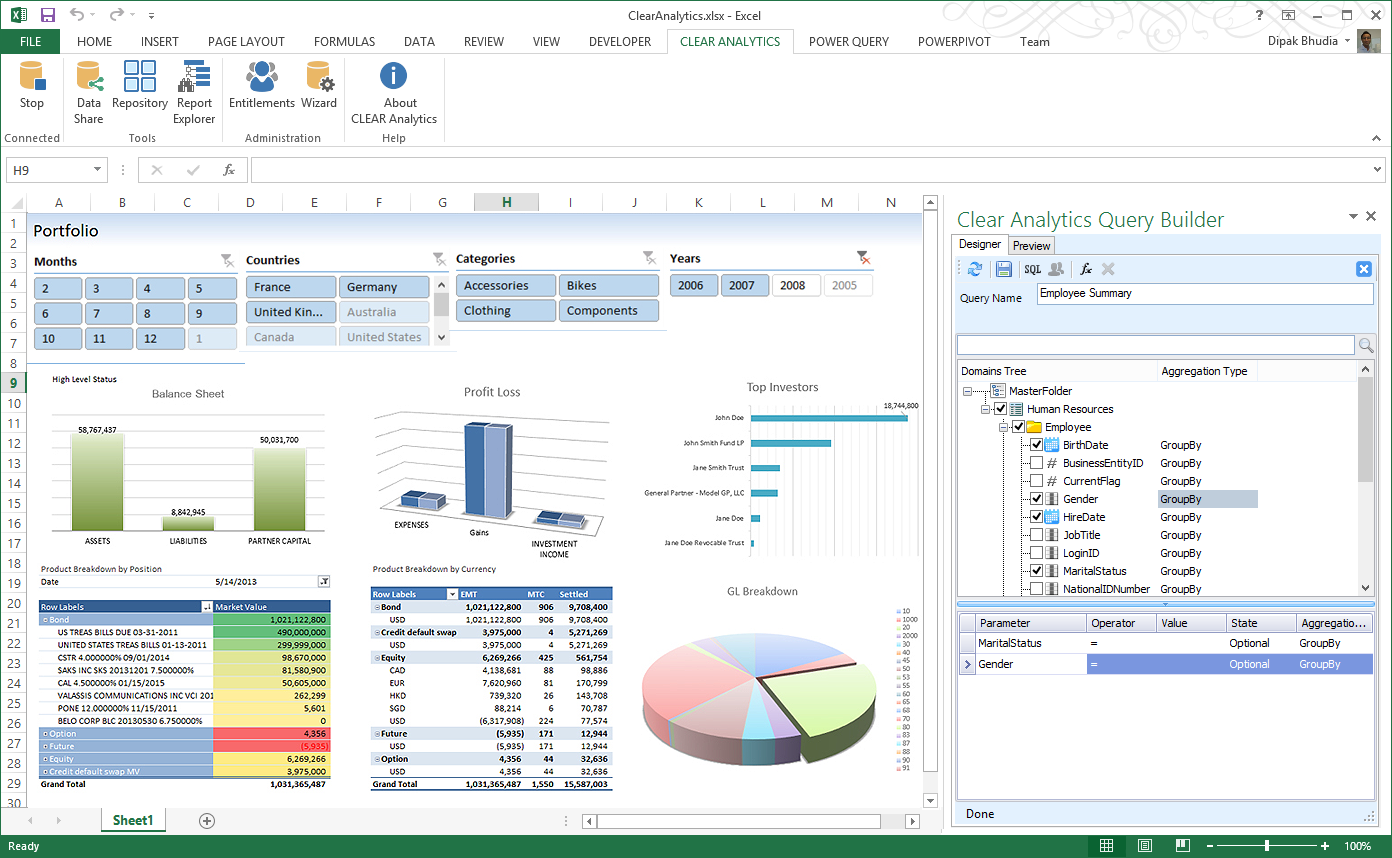
Clear Analytics is a business intelligence solution that enables non technical end users to perform analytics by leveraging existing knowledge of Excel coupled with a built in query builder. Some key features include: Dynamic Data Refresh, Data Share and In-Excel…
Clear Analytics is a business intelligence solution that enables non technical end users to perform analytics by leveraging existing knowledge of Excel coupled with a built in query builder. Some key features include: Dynamic Data Refresh, Data Share and In-Excel Collaboration.


| Deployment Types | On-premise |
|---|---|
| Operating Systems | Windows |
| Mobile Application | Apple iOS, Android, Windows Phone |
| Supported Countries | USA, UK |
| Supported Languages | English |
| Consumers | 10% |
|---|---|
| Small Businesses (1-50 employees) | 30% |
| Mid-Size Companies (51-500 employees) | 30% |
| Enterprises (more than 500 employees) | 30% |
Clear Analytics has gained popularity among users for its ability to integrate multiple data sources and facilitate data analytics. Users have been able to leverage the powerful tools provided by Clear Analytics to organize and extract valuable information from spreadsheets or other platforms. This has allowed them to run custom dashboards on top of existing data sources without the need for data migration, saving time and resources.
One of the key advantages of Clear Analytics is its ability to support simultaneous data analysis and sharing among team members. This feature has proven especially useful for collaborative projects, as it enables team members to work together on analyzing and interpreting data in real-time. Additionally, Clear Analytics supports integration with other development environments, further expanding its usability.
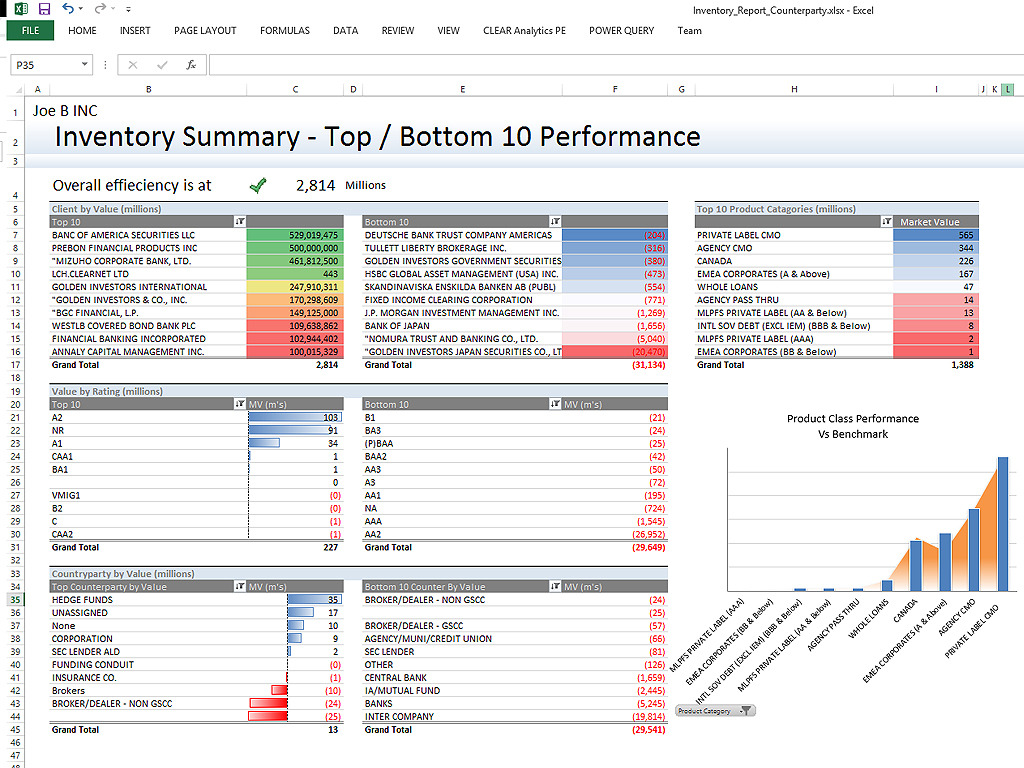
The excel functionality within Clear Analytics has been well-received by users, as it aids in data analysis and monitoring. With Clear Analytics, users can easily monitor behavior across the entire enterprise. This comprehensive view of data allows for process optimization and facilitates better decision-making.
Another notable use case of Clear Analytics is its ability to help users gather and analyze large sets of data for process optimization and better decision-making. By visualizing data through integration with Power BI, users are able to gain valuable insights that can inform their strategic decisions.
Overall, Clear Analytics has proven to be a valuable tool for businesses of all sizes. Its flexibility and range of options make it suitable for smaller businesses, while its powerful analytics capabilities cater to the needs of larger enterprises. By organizing and utilizing data effectively, Clear Analytics streamlines data presentation and enables more efficient analysis.
Strong Data Security Measures: Several users have praised Clear Analytics for its strong data security, governance, and compliance measures. This is important for businesses that handle sensitive information and need to ensure data protection.
Flexibility in Ad-Hoc Reporting: Many reviewers appreciate the flexibility of creating ad-hoc reports in Clear Analytics. This feature allows for customized and on-demand reporting based on specific business needs, providing a level of flexibility and agility in data analysis.
Auto-Refresh Data Capabilities: A number of users find the auto-refresh data capabilities offered by Clear Analytics to be useful. This feature allows users to set up automatic data refreshing at any desired frequency, ensuring that the data is always up-to-date.
Lack of Advanced Data Analytics: Some users have suggested the addition of OLAP and advanced data analytics features, such as predictive and descriptive analysis, in Clear Analytics. These suggestions highlight a desire for more robust analytical capabilities within the platform.
Steep Learning Curve for Beginners: Several reviewers have mentioned that Clear Analytics lacks beginner-friendly guides, resulting in extensive training time for new employees. This indicates a need for clearer onboarding resources to help new users navigate and utilize the software effectively.
Dependence on Excel Knowledge: A number of users have stated that Clear Analytics requires extensive knowledge of Excel prior to use. This suggests that familiarity with Excel functions and formulas is crucial for leveraging the full potential of Clear Analytics.