Overview
What is SAP Crystal?
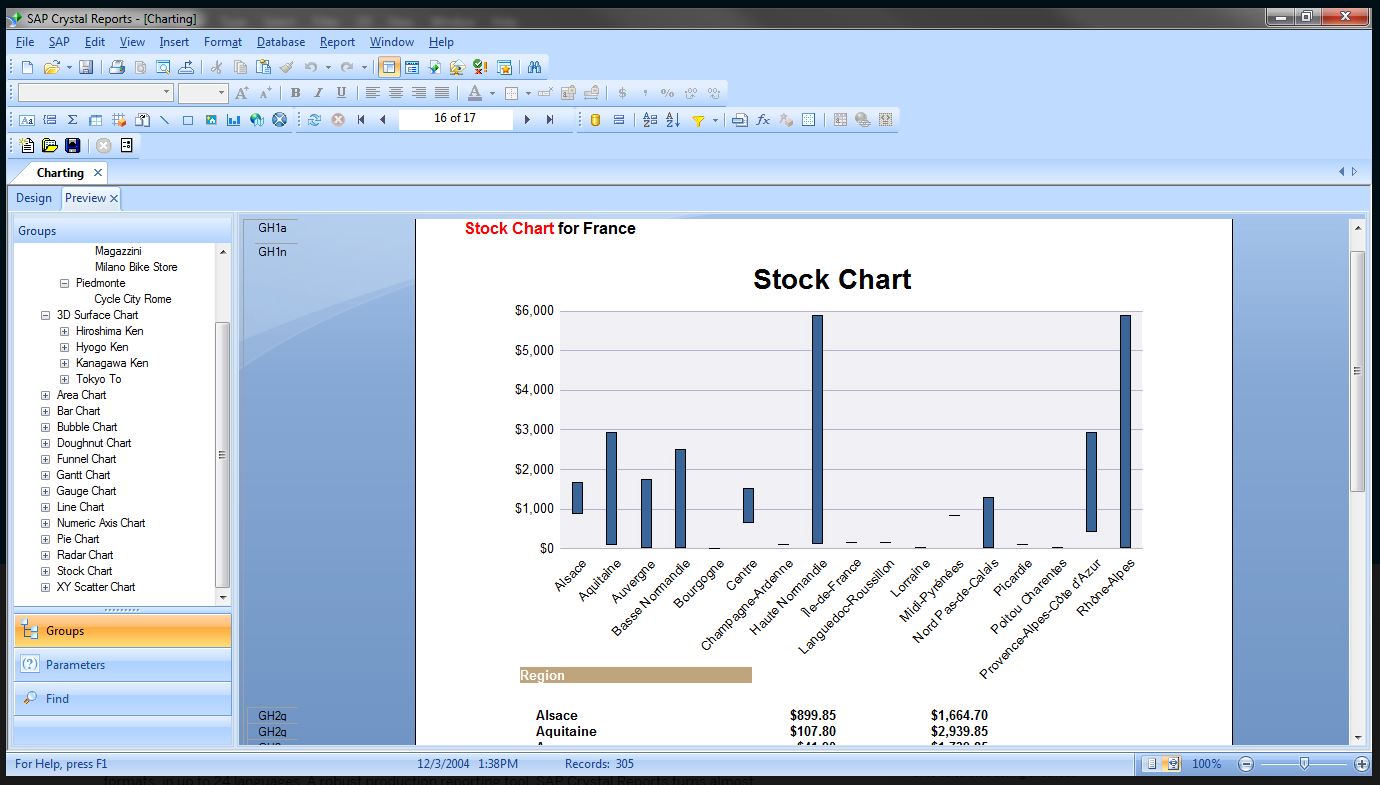
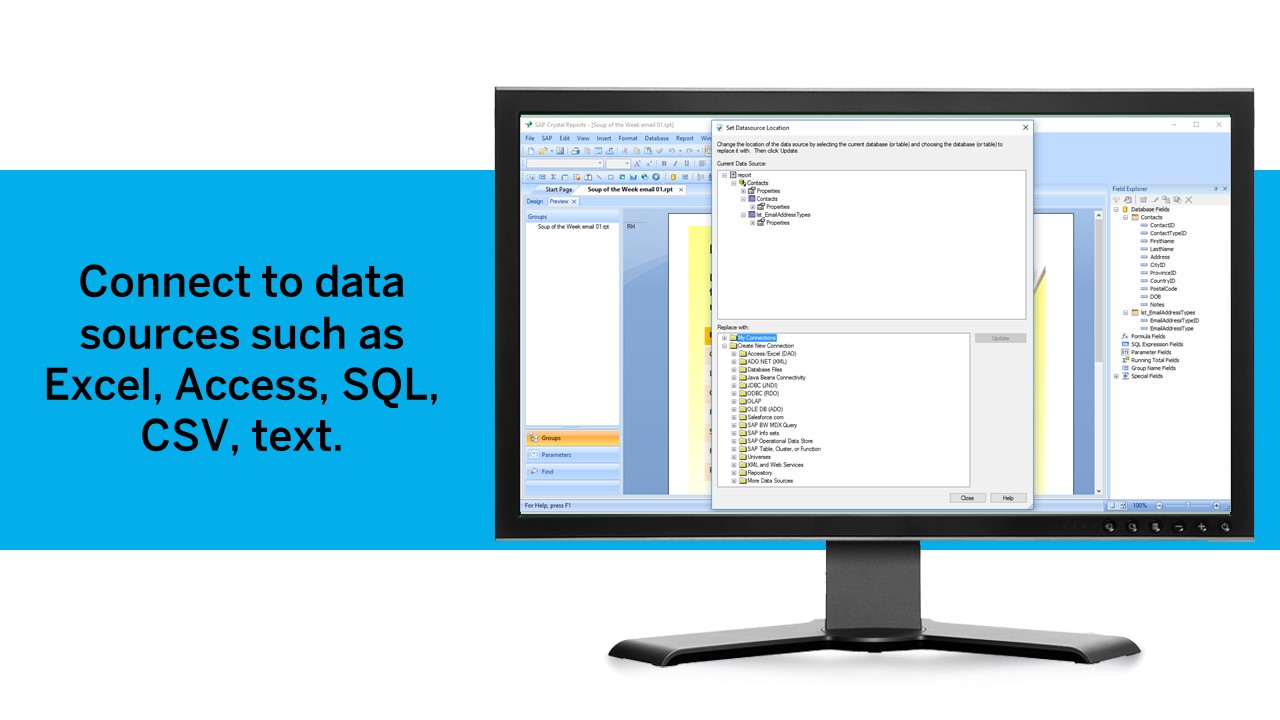
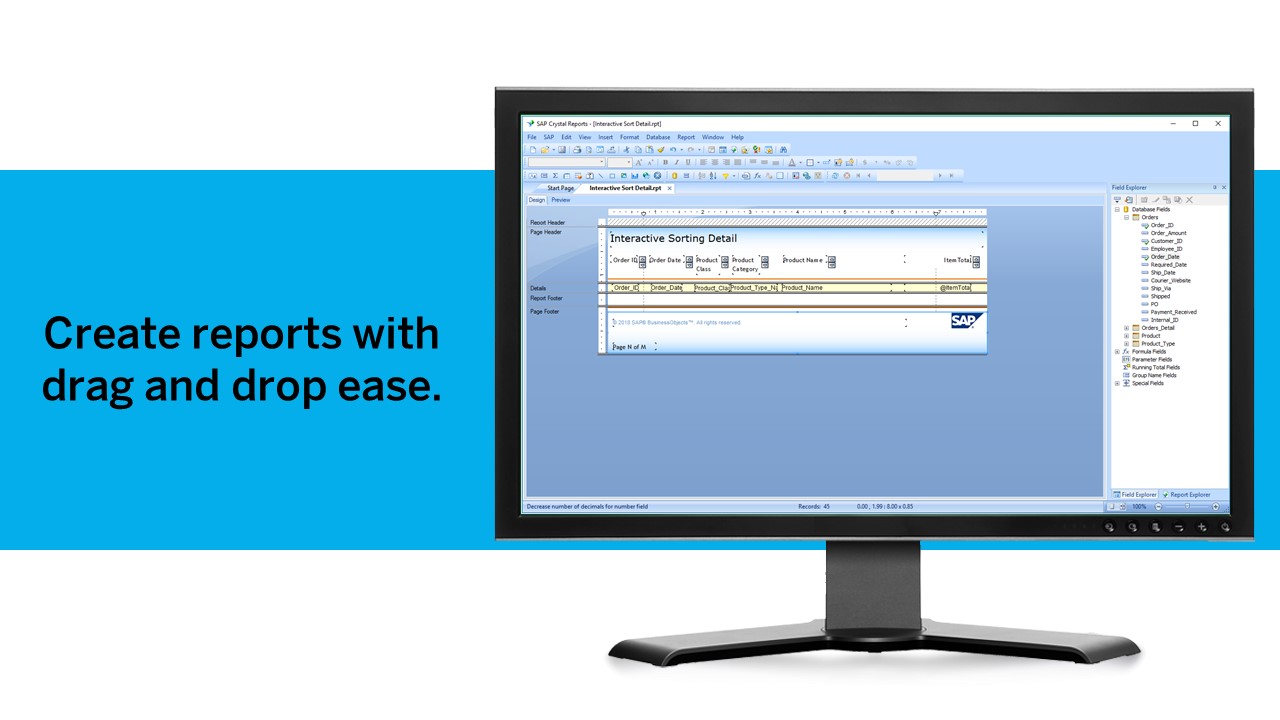
SAP Crystal is an analytics and reporting software solution for SMBs. SAP Crystal comprises Crystal Reports for pixel-perfect reporting, and SAP Crystal Server for automated distribution and self-service access to reports, dashboards and data exploration.
It's a great reporting tool for your business!
A essential tool for accurate report export from SAP
SAP Crystal Report Review
SAP Crystal is excellent for report building and aggregations
Crystal Clear Formatted Reports in Secure environment with sharing/distribution capabilities.
First time caller, long time user.
Effective for financial reporting, which is accurate.
SAP Crystal overall satisfaction
Crystal Delivers Thousands of Reports Per Week
Decent reporting tool
SAP Crystal Reports review
Powerful document and report automation
SAP Crystal Review
One of my top rated reporting systems.
Awards
Products that are considered exceptional by their customers based on a variety of criteria win TrustRadius awards. Learn more about the types of TrustRadius awards to make the best purchase decision. More about TrustRadius Awards
Popular Features
- Publish to PDF (131)10.0100%
- Report sharing and collaboration (118)10.0100%
- Report Formatting Templates (115)10.0100%
- Formatting capabilities (133)10.0100%
Reviewer Pros & Cons
Pricing
Upgrade Version to SAP Crystal Reports 2020
$295
SAP Crystal Reports 2020 64-Bit
$495
SAP Crystal Reports 2016 32-Bit
$495
Entry-level set up fee?
- Setup fee optional
Offerings
- Free Trial
- Free/Freemium Version
- Premium Consulting/Integration Services
Product Demos
Software TRAIL DEMO SAP Crystal Reports 2013
SAP Crystal Dashboard Design - Demo video
Features
BI Standard Reporting
Standard reporting means pre-built or canned reports available to users without having to create them.
- 8Pixel Perfect reports(111) Ratings
Pixel Perfect reports are highly-formatted reports with graphics and ability to preview the report before printing.
- 10Customizable dashboards(97) Ratings
Customizable dashboards are dashboards providing the builder some degree of control over the look and feel and display options.
- 10Report Formatting Templates(115) Ratings
Ad-hoc Reporting
Ad-Hoc Reports are reports built by the user to meet highly specific requirements.
- 10Drill-down analysis(115) Ratings
Drill down analysis is the ability to get to a further level of detail by going deeper into the hierarchy.
- 10Formatting capabilities(133) Ratings
Ability to format output e.g. conditional formatting, lines, headers, footers.
- 8.6Integration with R or other statistical packages(63) Ratings
Integration with the open-source R predictive modeling environment.
- 10Report sharing and collaboration(118) Ratings
Report sharing and collaboration is the ability to easily share reports with others.
Report Output and Scheduling
Ability to schedule and manager report output.
- 9.2Publish to Web(89) Ratings
- 10Publish to PDF(131) Ratings
- 9Report Versioning(93) Ratings
Report versioning is the assignment of version numbers to each version of a report to help in tracking.
- 9Report Delivery Scheduling(96) Ratings
Report Delivery Schedule is the ability to have reports delivered to a destination at a specific data and time.
- 10Delivery to Remote Servers(52) Ratings
Ability to deliver reports to remote servers
Data Discovery and Visualization
Data Discovery and Visualization is the analysis of multiple data sources in a search for patterns and outliers and the ability to represent the data visually.
- 7.6Pre-built visualization formats (heatmaps, scatter plots etc.)(51) Ratings
Pre-built visualization formats are canned visualization types that can be selected to visualize different kinds of data.
- 8.5Location Analytics / Geographic Visualization(75) Ratings
Location analytics is the visualization of geographical or spatial data.
- 7.8Predictive Analytics(41) Ratings
Predictive Analytics is the ability to build forecasting models based on existing data sets.
Access Control and Security
Access control means being able to determine who has access to which data.
- 7.8Multi-User Support (named login)(79) Ratings
Named model access means that users have access based on name and password.
- 7.7Role-Based Security Model(78) Ratings
Role-based access means that access to data is determined by job or position in the corporation.
- 8.4Multiple Access Permission Levels (Create, Read, Delete)(78) Ratings
Multiple access permission levels means that different levels of users have different rights.
- 10Report-Level Access Control(1) Ratings
Report-level access control means that the type of report determines who has access to it.
- 9Single Sign-On (SSO)(38) Ratings
Allows users to use one set of login credentials to access multiple applications
Mobile Capabilities
Support for mobile devices like smartphones and tablets.
- 8.7Responsive Design for Web Access(60) Ratings
Web design aimed at producing easy-to-read sites across a range of different devices.
- 7.6Mobile Application(43) Ratings
A dedicated app for iOS and/or Android.
- 9Dashboard / Report / Visualization Interactivity on Mobile(57) Ratings
In-app dashboard reports and data visualization.
Application Program Interfaces (APIs) / Embedding
APIs are a set of routines, protocols, and tools for used for embedding one application in another
- 7.4REST API(8) Ratings
REST is an architecture style for designing networked applications
- 6Javascript API(35) Ratings
A Javascript API is a type of API
- 7.1iFrames(8) Ratings
An iFrame is an HTML document embedded inside another HTML document on a website
- 6Java API(35) Ratings
A Java application programming interface (API) is a list of all classes that are part of the Java development kit (JDK)
- 8.3Themeable User Interface (UI)(37) Ratings
A themeable user interface means that a specific visual them can be applied to it
- 7Customizable Platform (Open Source)(31) Ratings
A customizable, open source API Gateway is a fast and scalable type of API
Product Details
- About
- Competitors
- Tech Details
- Downloadables
- FAQs
What is SAP Crystal?
SAP Crystal Features
BI Platform Features
- Supported: Administration via Web Interface
- Supported: Live Connection to External Data
- Supported: Snapshot of External Data
- Supported: OLAP (Pre-processed cube representation)
- Supported: ROLAP (SQL-layer querying)
- Supported: Multi-Data Source Reporting (Blending)
- Supported: Data warehouse / dictionary layer
Supported Data Sources Features
- Supported: MS Excel Workbooks
- Supported: Text Files (CSV, etc)
- Supported: Oracle
- Supported: MS SQL Server
- Supported: IBM DB2
- Supported: Postgres
- Supported: MySQL
- Supported: ODBC
- Supported: EMC Greenplum
- Supported: HP Vertica
- Supported: SAP Hana
- Supported: Teradata
- Supported: Salesforce
- Supported: SAP
BI Standard Reporting Features
- Supported: Pixel Perfect reports
- Supported: Customizable dashboards
- Supported: Report Formatting Templates
Ad-hoc Reporting Features
- Supported: Drill-down analysis
- Supported: Formatting capabilities
- Supported: Integration with R or other statistical packages
- Supported: Report sharing and collaboration
Report Output and Scheduling Features
- Supported: Publish to Web
- Supported: Publish to PDF
- Supported: Output Raw Supporting Data
- Supported: Report Versioning
- Supported: Report Delivery Scheduling
- Supported: Delivery to Remote Servers
Data Discovery and Visualization Features
- Supported: Location Analytics / Geographic Visualization
Access Control and Security Features
- Supported: Multi-User Support (named login)
- Supported: Role-Based Security Model
- Supported: Multiple Access Permission Levels (Create, Read, Delete)
- Supported: Report-Level Access Control
- Supported: Table-Level Access Control (BI-layer)
- Supported: Field-Level Access Control (BI-layer)
- Supported: Single Sign-On (SSO)
Mobile Capabilities Features
- Supported: Responsive Design for Web Access
- Supported: Mobile Application
- Supported: Dashboard / Report / Visualization Interactivity on Mobile
Application Program Interfaces (APIs) / Embedding Features
- Supported: Javascript API
- Supported: Java API
- Supported: Themeable User Interface (UI)
- Supported: Customizable Platform (Open Source)
SAP Crystal Screenshots
SAP Crystal Videos
SAP Crystal Competitors
SAP Crystal Technical Details
Deployment Types | On-premise |
---|---|
Operating Systems | Windows, Linux |
Mobile Application | Apple iOS, Android |
Supported Countries | Global |
Supported Languages | English, French, German, Japanese, Spanish, Simplified Chinese, Italian, Dutch, Russian, Korean, Traditional Chinese, Portuguese, Swedish, Polish, Danish, Norwegian, Finnish, Thai, Czech, Hungarian, Slovakian, Turkish, Romanian, Slovenian |
SAP Crystal Downloadables
- Detailed information for SAP Crystal Server 2016’s supported platforms, such as Windows and Linux OS, browser, LDAP and hardware support
- Languages supported with SAP Crystal Reports 2016
- Product features to leverage with SAP Crystal Solutions for the small to midsize business
- Pixel-perfect reports created with SAP Crystal Solutions for small to midsize business
- Business goals to achieve with SAP Crystal Solutions for small to midsize business
- Implementation costs to consider with SAP Crystal Solutions for small to midsize business
- Comparison of features by version for SAP Crystal Reports and SAP Crystal Server software
Frequently Asked Questions
Comparisons
Compare with
Reviews and Ratings
(556)Attribute Ratings
- 10Likelihood to Renew19 ratings
- 8Availability1 rating
- 8Performance1 rating
- 9.4Usability28 ratings
- 8.6Support Rating21 ratings
- 10In-Person Training1 rating
- 8.8Implementation Rating14 ratings
- 8Configurability1 rating
- 7Product Scalability1 rating
- 7Ease of integration1 rating
- 7Vendor pre-sale1 rating
- 8Vendor post-sale1 rating
- 7Data Visualization4 ratings
- 9.2Data Sources130 ratings
- 8.8Data Sharing and Collaboration125 ratings
- 8.5SAP Crystal Pixel-Perfect Reporting5 ratings
Reviews
(26-50 of 156)A tool that cannot be renounced
- Build clear efficient reports in a short time.
- Broad connectivity with diverse data sources.
- Support scalable content delivery.
- The selling price should be lower.
- The performances could be better.
- Assistance could be more available.
SAP Crystal Reports for Your Business
- First of all, its design is very good and easy to use, so it does every task very well like box formatting.
- Its GUI is great and can create graphs in reports of any kind very well. We can also share them with anyone.
- Mobile device compatibility
- Text formatting can be done in all languages by the SAP Crystal reports tool, mainly right to left text formatting. It is very useful as a few of our clients are from other countries and use languages which are written right to left.
- We can use our database and queries with SAP Crystal reports too and save our reports in different formats
- As far as I know, it takes a little more time to learn this tool in the beginning. I personally faced a hard time using for the first time and when I teach other junior staff members they took a lot of time to learn it.
SAP Crystal Review
- It is a great application to see data from different perspective
- It is easy to connect with multiple database simultaneously
- It is easy to format and users can use wide variety of formulas
- It is challenging to use the system at first but once you pass that learning curve then it is easy to maneuver the application based on your needs
- Converting Crystal Reports to Excel can be challenging as the formatting gets distorted
- Overall, there are no major issues and it is a great tool
- Deep integration with our ERP solution which provides the ability for the customers to create their own individualized reports.
- The central management console provides a single place to create, import, modify, etc reports.
- Integration with SQL server that allows for comparison to SSRS reports.
- Complex and involved installation provides a lot of custom features but is not the easiest software to implement.
- Enterprise product which includes enterprise sized licensing costs.
- Integration with the ERP can be simple or as complex as you make it, all depends on the requirements.
Old Reliable, as in 'Works great but showing its age'
- Reliable software
- Constant support
- Def not going anywhere
- Its interface, while it's a workhorse, is not going to win any beauty pageants
- Adding graphics and charts to a report feels cumbersome and VERY antiquated
- It shows its age sometimes
Long-time User of SAP Crystal Reports
1. I answer a lot of questions about Crystal in online forums - the SAP Community forums as well as a few others.
2. I train our clients in how to use Crystal, not only the standard SAP classes, but also one I've created that walks through the most-asked questions from the forums and what their solutions are.
3. I personally use Crystal for a number of different tasks, including analyzing data when I do security reviews of clients' SAP BI Platform and SAP Crystal Reports Server systems.
- In addition to linking together tables and views from the database in order to get data into your report, Crystal allows you to write your own SQL queries using an "Command". This feature allows for the use of very complex queries to get data for your reports.
- Crystal can connect to MANY different types of databases. It has native connections available for a number of them, including Oracle, and will connect to almost anything else using either ODBC or (less common) JDBC.
- Subreports, when used correctly, are a powerful feature for bringing additional data into a report.
- There are SDK's available to integrate reporting into either .NET or Java applications and websites.
- The option to export to Excel is very picky about report format to get a clean export. Once you know the tricks for setting up a report for this export, it's not hard to do, but it can be very tedious if the report has a lot of elements. This is the way it's been for years and SAP has indicated that it's not something that's going to be changed.
- Crystal requires that a user knows how the data they're reporting on is configured in the database - it's not really suited for a "casual" user, but for someone with at least some technical skills in relation to databases. This is not something that can or should necessarily be changed, but it is something that potential users need to be aware of.
- Other than new types of database connections, SAP has indicated that they will not be upgrading any functionality in "classic" Crystal. They instead have chosen to focus on upgrades to Crystal for Enterprise. The problem with that is that it requires the SAP BI Platform - either SAP BusinessObjects or SAP Crystal Reports Server.
- One of the major things that's not being upgraded is the Charting libraries, which were last updated in the early 2000's, before SAP purchased Crystal. So, Crystal doesn't have newer chart types available.
I particularly like being able to write my own queries instead of having Crystal write them for me. With this feature, I've been able to do some very complex reports this way. I could have done most of these reports by linking tables together in Crystal and using Crystal's filter and suppression features, but putting the logic in the query means that Crystal is processing less data so the report is faster.
Crystal is less suited for showing graphs, unless you just need very simple line or bar graphs. It's also not really suited to doing ad-hoc reporting for most users because it is more technical than some other reporting tools.
Power hidden
- Easy to create reports
- Combined with SAP BO security you can access different users with different roles
- Can add easily any comments about your data. Even I think I can use CR for generating infographics
- I recently only use CR for training
Crystal Reports Review
- It is a user-friendly tool just like PowerPoint. For example, there is no need to write code for a button, text field, or database field. A developer just needs to drag and drop in the report.
- For the database part you can do some manual table mapping based on your requirements so there is no need to waste time writing along query. Your query part is done by Crystal Reports.
- You can immediately run a report in the tool and see if you are getting correct data and your report output is the same as the user's requirement.
- When you run a report you can see each data field value there itself so it is easy to verify your data
- Crystal Reports has many built-in functions like date and page so no need to write code for these functions just drag and drop. It will work even makes it easy to add an input parameter.
- It needs improvement in database connectivity. Many times the database connection failure issue happens and you have to reconnect the connection again and again
- If your report has more data it will hang the whole tool itself and it will take so much time to get data and you can not do any other work in the tool.
- It should allow a user to do table mapping in one report from two diffident different databases.
Getting great results from your data with Crystal Reports
- Gathering data from many sources
- Linking tables together on common fields
- Subtotals, running totals, calculations, grand totals
- Charts
- Filters, sorts
- It needs to bring in more data types, and newer data types. For example, it can use XLS Excel files, but not XLSX Excel files.
- More chart types.
- Ease of use
- Flexibility
- Power
Make your reports stand out
- Customization for reports
- Allows multiple users to feed and draw data
- Flexibility
- Expensive
- Hard to setup
SAP Crystal Reports and Crystal Reports Server
- It requires a developer skilled in Crystal Reports’ proprietary language, but one of CR most touted benefits is its flexible, customizable report design.
- Using CR, a developer can create highly formatted, pixel-perfect reports in nearly any layout desired and in up to 24 different languages.
- Like other major business intelligence vendors, SAP typically buys technology instead of innovating it. As a result, a number of interfaces must be used to leverage CR, including a report designer and a dashboard designer.
- Security is built into the report itself, so when you need a report for two different audiences, the developer must modify the security settings for each report- in effect duplicating the report for each person.
Feedback about Crystal
- Very formatted reporting.
- Self service querying tool on SAP
- Governed SOX reporting
Really professional and compatible reports everywhere.
- There are some written exercises based on SAP Crystal Report that facilitate learning.
- The integration with the different IDE of development are optimized
- It is compatible with the most popular database administrators, MYSQL, SQLSERVER, POSTGRESQL. and more...
- The designer of Crystal is fantastic, drag and drop add-ons to create your report.
- I had a lot of problems and spent a lot of time trying to adjust the space between the rows. I hope that in the future, SAP Crystal Report will make it easier.
- Should block the sizes of pre-established and blocked sheets to avoid leaving the margins.
SAP Crystal: still a winner
- Connects to a variety of data sources easily
- Stable product & strong user community for help
- Pixel-perfect reporting at its best
- Still two similar client tools causes some confusion to super users
- Some form of ad-hoc reporting features would help
- UI is little aged so better make it contemporary
Crystal Reports for Routine Reporting & Analysis
- Crystal Reports formulas make it very easy to customize complex reporting requirements. Additionally, Crystal Reports reporting language is easy to learn and use.
- Crystal Reports output of information in a variety of file types makes it easy to consume on any platform meeting a variety of end users' needs from PDFs to spreadsheets to interactive reports with drill capabilities.
- Crystal Reports makes is easy to combine data sets from a variety of sources, and then join the data together in a meaningful way.
- Occasionally, a data source type needs to be changed. This can create an issue when moving the report from one data source to another effectively breaking the link of the fields in one data source as the transition to another occurs. It would be helpful if Crystal Reports created a data migration tool to make the mapping of the old fields to the new more straightforward when data sources need to be changed.
- The ability to drill down on formulas would be an awesome feature, however, I have not seen this ability in any reporting platform.
- We have used some advance BI tools with really slick visualizations, and it would be great to see a similar level of graphical presentations in CR. I have to admit that I have been using CR 2009 until very recently when I upgraded to CR 2016, and I have not had a chance to fully test updated graphics.
Crystal Reports is less appropriately suited for ad-hoc reports due to the level of effort in setting up a report; however, it can work for ad hoc reports if a lot of effort is not required.
Crystal Reports is a great reporting tool
- It allows you to connect to virtually any data source. I have used it to write reports using data from DB2, SQL, Progress, Excel spreadsheets, XML data, Access, and Lotus Notes databases. You can also join different database types together in one report.
- The drag and drop layout makes it easy to design your report and easy to select data fields to add to your report.
- When creating a report the Standard Report Creation Wizard walks you through each step needed to create the report and will layout the report for you.
- There is a wealth of online answers if you have a question about how to do something specific in Crystal Reports.
- It would be nice if there was a way to search your .rpt files for a specific field or table using a normal search engine. There are secondary tools available for purchase but it would be nice if there were a way to do this without additional purchase.
- When I first started using Crystal Reports the learning curve was steep. That being said I had never used a reporting tool before. I think if you are familiar with reporting tools the learning curve would not be as steep.
- If you do happen to get an error message they are sometimes very cryptic and require internet searches to figure out what exactly is wrong.
- The interface is easy to learn and understand, with clear iconography and unambiguous tool names.
- It's easy to connect data from many different sources at once.
- The help section is actually helpful (!) and easy to navigate to find the answers quickly.
- A more powerful search function for where formulas and fields are used in the report, such as being able to see at a glance every instance of {@formula}, be it selection criteria, other formulas or location in the report body.
- Keyboard shortcuts, such as T or Ctrl+T for inserting a text box, S or Ctrl+Shift+S for select expert, etc.
Flexible and Easy to Learn
- Crystal is very flexible. If you have a unique formatting need for a report, it will be easier to implement with Crystal than most other tools.
- Creating run prompts in Crystal is a more straightforward process than in most other tools I've used.
- You don't need to build queries within Crystal while creating a report. That process has confused me when other tools require it.
- Creating a loop with Crystal is more difficult than I would like.
- In the design template pane in Crystal, you sometimes need to cram objects tightly together to get the report appearance you want. It's hard to see/work with these objects later.
- Crystal no longer connects directly to Oracle/PeopleSoft databases, which is our enterprise system.
SAP Crystal Reports Review
- Reports can also be easily delivered through the Crystal Reports Server or BusinessObjects.
- It is a WSIWYG design tool, allowing you to see what you are doing as you do it. You can customize the design with your own ideas and need.
- Flexible Windows and Web application features support development.
- Crystal can also handle very large volumes of data very well as its processing engines are optimized to do so.
- Rules applied to the selection and manipulation of data can have unexpected results, leading to manual troubleshooting of report design and database queries.
- Working with lines and boxes is not as flexible as, say, Microsoft Word.
- New Users needs training to use it effectively.
- A more intuitive interface for linking databases and database tables would be helpful for those that are new to databases and report writing.
SAP report benefits over other software
- Reports can be very specific and highly formatted. It has an intense amount of format options and other ways to present your view and data.
- Very powerful. Very competent.
- It allows us to create exactly what is needed to support our operations. Crystal Reports allows us to do anything where more user-friendly software fails.
- Crystal Reports takes a great degree of skill, experience to use it. New users should learn first how to use it. An expert's tool.
- There are a lot of updates, versions and a number of features and it is hard to keep track of new updates.
- You need to purchase new feature as you want and you'll realize that you're spending more than you thought.
Crystal Reports review
- SAP Crystal lets us integrate different systems, databases and helps generate better reports.
- SAP has a good UI/Graphical interface that is very presentable.
- It has API's for several other programs and functions to improve efficiency.
- It has limited GIS functionality.
- GIS is one area which can be improved.
- A business user cannot leverage CR; it takes the skill of an experienced CR developer- which drives up the cost.
- Security is built into the report itself, so when you need a report for two different audiences, the developer must modify the security settings for each report. This results in work duplication.
A situation where it is not suitable is when a business user is trying to use Crystal Reports. It requires a developer/tester to work on this. It cannot be used directly by a business user.
- The integration using the connection as ODBC, Microsoft Access, Microsoft Excel, etc.
- Price is relatively inexpensive compared to other tools on the market.
- Create complicated reports with the ability to adjust display and format to the level of detail that only financial experts can easily manage and get the most of those reports.
- Not intuitive – takes a skilled developer to write a complex report, so be aware to manage several consults or even the basic structure of financial report development.
- Microsoft Updates, .NET updates my cause crashes in the reporting services so many times and it takes days to correct the issues, that you have to read carefully before you apply updates this can turn things against you.
- The learning curve is considerable small, but if you don't know SQL and understand the basics of relational databases you'll have to dig into a proper training that is fair to manage a large range reporting tool.
Not the Cadillac, but still Very Nice.
- The UI is done very well and easy to grasp for not tech people.
- The available charting functions are easy to configure.
- Some aspects of building a report are not very intuitive. I don't have a specific example off-hand, but I know when I first started with the software I was using Google and user forums a lot to figure things out.
- When the platform changed the infrastructure of the reports making backward compatibility a problem it put stress on us to upgrade to meet supported versions with a vendor.
- Allows us to generate custom formulas to present complex data in an accurate format.
- Provides a comprehensive means to modify font types, sizes, and formats to present to internal and external customers.
- Allows us to present data from multiple SQL database tables and views, and allows us to customize formulas if data is not stored in the SQL database.
- Formatting of fields and text boxes allows consistency among sections.
- Would like even more flexibility in exporting reports to Excel, although I understand Microsoft has some control over this.
- Still difficult sometimes to line up boxes/fields vertically across multiple report sections.
- Drawing lines sometimes present issues when spanning multiple sections.
It does a lot, but it can take a long time to do it
- Detailed invoices calculating shipping, installation and delivery
- A central point for developers to generate templates for end users
- Flexible range of output
- The way you design templates is kind of hodge podge
- Unpredictable output from time to time
- A bit confusing for non-technical people, requires a lot of trial and error