Overview
What is SAP Lumira Discovery?
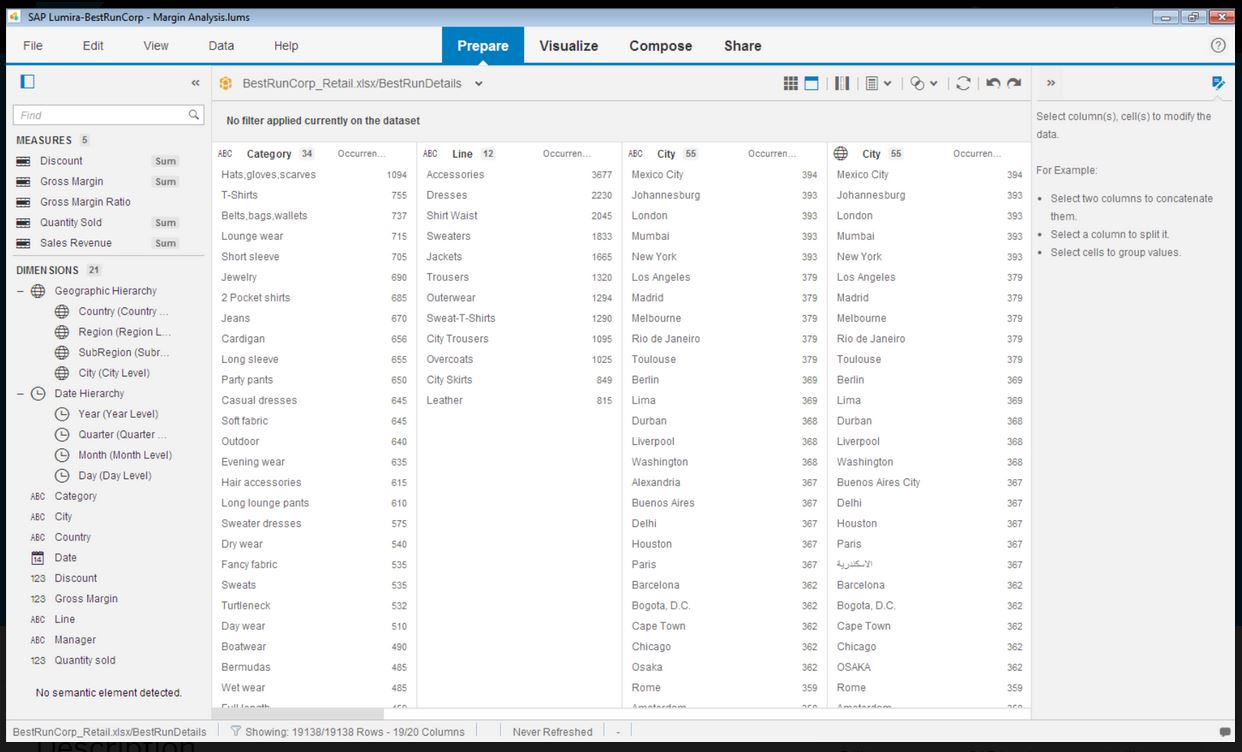
SAP Lumira Discovery is SAP’s data visualization and discovery application. It facilitates data discovery, visualization, and analysis by assisting users with creation of dashboards, infographics, presentations, data facets, tag clouds, and more.
An Excellent Business Intelligence Tool
Lumira Pilot
Data Visualization tool for big data
SAP Lumira is powerful analytical tool, however being overshadowed by SAP SAC as goto tool
Lumira is Good but NOT Great
SAP Lumira Discovery is top of its class
Best Self-Service BI solution for SAP customers who cannot use SAP Analytics Cloud
Positiveness and Negativeness in SAP Lumira Discovery
Easy Business Planning and Effective on Predictive Data Analytics Production SAP Package.
SAP Lumira - the new version is totally amazing for self-service BI and making the most out of your data!
Great product
Lumira
SAP Lumira Software
Take the scariness out of Big Data and put it to work for you!
Awards
Products that are considered exceptional by their customers based on a variety of criteria win TrustRadius awards. Learn more about the types of TrustRadius awards to make the best purchase decision. More about TrustRadius Awards
Popular Features
- Pre-built visualization formats (heatmaps, scatter plots etc.) (101)8.282%
- Formatting capabilities (102)7.979%
- Drill-down analysis (99)7.777%
- Report sharing and collaboration (97)7.474%
Pricing
SAP Lumira, standard edition
$185
Entry-level set up fee?
- No setup fee
Offerings
- Free Trial
- Free/Freemium Version
- Premium Consulting/Integration Services
Features
BI Standard Reporting
Standard reporting means pre-built or canned reports available to users without having to create them.
- 7.5Customizable dashboards(96) Ratings
Customizable dashboards are dashboards providing the builder some degree of control over the look and feel and display options.
Ad-hoc Reporting
Ad-Hoc Reports are reports built by the user to meet highly specific requirements.
- 7.7Drill-down analysis(99) Ratings
Drill down analysis is the ability to get to a further level of detail by going deeper into the hierarchy.
- 7.9Formatting capabilities(102) Ratings
Ability to format output e.g. conditional formatting, lines, headers, footers.
- 7.4Report sharing and collaboration(97) Ratings
Report sharing and collaboration is the ability to easily share reports with others.
Report Output and Scheduling
Ability to schedule and manager report output.
- 7.7Publish to Web(81) Ratings
- 7.6Publish to PDF(93) Ratings
- 6.3Report Delivery Scheduling(55) Ratings
Report Delivery Schedule is the ability to have reports delivered to a destination at a specific data and time.
Data Discovery and Visualization
Data Discovery and Visualization is the analysis of multiple data sources in a search for patterns and outliers and the ability to represent the data visually.
- 8.2Pre-built visualization formats (heatmaps, scatter plots etc.)(101) Ratings
Pre-built visualization formats are canned visualization types that can be selected to visualize different kinds of data.
- 6.7Location Analytics / Geographic Visualization(94) Ratings
Location analytics is the visualization of geographical or spatial data.
- 2Predictive Analytics(72) Ratings
Predictive Analytics is the ability to build forecasting models based on existing data sets.
Product Details
- About
- Competitors
- Tech Details
- FAQs
What is SAP Lumira Discovery?
SAP Lumira Discovery Features
BI Platform Features
- Supported: Live Connection to External Data
- Supported: Snapshot of External Data
- Supported: OLAP (Pre-processed cube representation)
- Supported: ROLAP (SQL-layer querying)
- Supported: Multi-Data Source Reporting (Blending)
Supported Data Sources Features
- Supported: MS Excel Workbooks
- Supported: Text Files (CSV, etc)
- Supported: Oracle
- Supported: MS SQL Server
- Supported: IBM DB2
- Supported: Postgres
- Supported: MySQL
- Supported: ODBC
- Supported: Hortonworks Hadoop
- Supported: IBM Netezza
- Supported: HP Vertica
- Supported: SAP Hana
- Supported: Teradata
- Supported: Salesforce
- Supported: SAP
BI Standard Reporting Features
- Supported: Customizable dashboards
Ad-hoc Reporting Features
- Supported: Drill-down analysis
- Supported: Formatting capabilities
- Supported: Report sharing and collaboration
Report Output and Scheduling Features
- Supported: Publish to Web
- Supported: Publish to PDF
Data Discovery and Visualization Features
- Supported: Pre-built visualization formats (heatmaps, scatter plots etc.)
- Supported: Location Analytics / Geographic Visualization
Additional Features
- Supported: Acquire and enrich data, big and small, from any source
- Supported: Visualize and explore any amount of data in real time without sacrificing performance or security
- Supported: Export reports, dashboards, presentations and infographics to pdf format for easy sharing
SAP Lumira Discovery Screenshots
SAP Lumira Discovery Video
SAP Lumira Discovery Competitors
SAP Lumira Discovery Technical Details
Deployment Types | On-premise |
---|---|
Operating Systems | Windows |
Mobile Application | No |
Supported Languages | Chinese (Simplified), Czech, English, French, German, Hungarian, Japanese, Korean, Polish, Portuguese, Russian, Spanish, Turkish. |
Frequently Asked Questions
Comparisons
Compare with
Reviews and Ratings
(499)Attribute Ratings
- 9Availability1 rating
- 7Performance1 rating
- 7.8Usability14 ratings
- 7Support Rating11 ratings
- 6Online Training1 rating
- 6In-Person Training1 rating
- 10Implementation Rating3 ratings
- 2Configurability1 rating
- 6Product Scalability1 rating
- 5Ease of integration1 rating
- 8Vendor pre-sale1 rating
- 8Vendor post-sale1 rating
- 10Data Sources89 ratings
- 2Data Sharing and Collaboration83 ratings
Reviews
(76-100 of 104)Lumira trial thoughts
- It's good as a data visualisation and investigation tool.
- Very simple and intuitive to use.
- It is far better than using products like Microsoft Excel for this purpose.
- There are constraints on the mechanisms used to import the data. For example, I was importing data from a .CSV file containing separate numeric and text representations of the date associated with the other data in the row. Lumira was unable to directly interpret these data as time & date fields without splitting the text information into individual columns.
- The data manipulation functionality for imported data could be improved, particularly the ability to create sub-columns derived from data already in the source table
Lumira beginners review
- Strengths are ease of use and no prior experience is necessary.
- Supports various data extensions such as Excel, CSV, etc.
- Some features were missing that I wanted.
- Filtering was not so easy.
Easy to use, resourceful resource!
- Very user friendly and easy to understand.
- Great interface.
- Very high functionality; useful for any business seeking any information about their business or others.
- The names of some features were fairly similar and took some time to differentiate and get used to.
Easy to use and powerful business intelligence tool
- Able to access live data from servers
- Ability to generate reports instantly
- Variety of reports are available
- Application is heavy and requires more space
SAP Lumira from SAP HANA for RightOn
- Strong charts and graphs but also visualizations such as heat maps
- Ability to add calculated measures, KPIs, and conditional formating
- Ease in linking to HANA
- Ability to create standard reports and presentations than can be easily refreshed
- More ability to share with Non-Lumira users outside of creating PDFs
Updated tool in Data Visualization
- Easy to consume formats such as charts, bars, graphs.
- Drill down functionality to granular details.
- Able to merge the data from different sources and able to easily visualize it.
- The ability to derive the data by users themselves with little knowledge.
- I think SAP Business Objects LUMIRA needs improvement while connecting to the Universe Design Tool or UDT. At this moment I am converting UDT universe to IDT then creating the visualizations.
Standalone Lumira as a BI tool
- Lumira is easy to install and configure.
- The extension technology works well, and it is easy to add new visualizations.
- Lumira's joining capability seems weak, but perhaps that is because I am used to MicroStrategy which is very strong in this department.
- Lumira can be unstable and crash from time to time.
- Lumira's performance sometimes feels slow.
Quick and Dirty Reports made easy with Lumira
- Self service reporting made easy. This is a fact and not just a slogan. We can get answers and truly follow the data down to the root cause in a manageable way.
- Quick. The reports are very quick to run.
- Great opportunities to slice and dice and get real insight that normally would have taken lots of work in Excel.
- Standard views should always have the description of objects as well. It is great to have the customer number but without the customer description it is harder to get all the value. It feels like we stopped when we could have gone the extra mile.
- Publishing a link to a SharePoint or other place where users can then easily access the data instead of first having to log into Lumira.
- % Share functionality.
- For quick and dirty query access it is a great tool.
- For more formatted reporting it is not the best.
- For quick answers and "throw away" queries it is fantastic.
Excellent so far!
- You can combine and seamlessly present inputs from flat files, Excel, SQL, BI, and other sources.
- I didn't take a class or read a tutorial, and had a quality, working visualization in a couple hours!
- It would be wonderful if this tool could publish to a native web format.
Project management Lumira
- Easy setup
- Good visualization functions
- Share concept
- Sample dashboards
I've come from from an area of data analysis and consumption that was heavily utilizing Excel spreadsheets to create dashboards and reports. These reports were manually configured week by week, month by month. I utilized formulas and entered raw data obtained through various database sources.
Lumira, changed all that. Lumira allowed me to tap into various data sources, create report templates and set scheduled refreshes so I never have to monkey around with reports on a weekly basis. I've saved hundreds of hours that were spent massaging and cleansing data. That is now being used to do what my job requires of me - making meaningful analysis happen, while putting the things I learned to use.
SAP Lumira has enabled me to take raw data, create meaningful reports, and obtain key information pieces to act upon and drive change. It's been a while since SAP made data analysis easy, but thanks to their hard work - we're finally there.
- Analysis - Dynamic charts, filters and drill downs of data from a budget or cost measure.
- Plotting data on various charts, including geographical data via ARC GIS data on Esri Online.
- Simple GUI interface - No SQL or programming required.
- Sort columns/dimensions in visualizations (e.g. custom sort on dates, months, years)
Students love it!
- There are so many types of charts available and it can't be easier to switch from one to another.
- The interface is simple and user friendly.
- The charts are beautiful.
- Should make it available to a 32 bit computer as well.
- Should require at least 2 GB, not 4 GB.
- Add option to either show or hide captions of the chart types.
SAP Lumira from a User Prespective
- Merging of data sources
- Ease of creating dashboards on the fly by users
- Less control on charts for remaining and placement of data labels and titles
- More Direct access to SAP BW data
An Attractive Analytics and Presentation Tool
- It allows you to pull together data from various sources in a reasonably intuitive manner.
- A plethora of charting options are available making it easy to match the visualization to the data for maximum impact.
- The user interface isn't 100% intuitive; so it's hard to use right out of the box, but if someone who knows it gives you a tour, you will pick it up right away. We have one person in our reporting department who designed a great, multi-page presentation, and when I asked him how long he'd been working with SAP, he said: "Two weeks".
- The very modern UI is somewhat sparse in the area of tooltips. It's akin to the first time one tries to use Windows 8. But once you figure them out, it's smooth sailing.
- I don't like that the Edit Data Source/Universe Query Panel is completely modal, making it impossible to access anything underneath it.
Intuitive and great visuals (albeit not that flexible!)
- Ease of creating visualizations (drag and drop); also prompts you to use the right measures/dimensions in the right axes (making it intuitive for non-it/non-analysts).
- Intuitive nature of the interface - if you know Excel, or more advanced software, getting to grips with Lumira is a breeze.
- Sharing/publishing outputs.
- As it runs on your machine, restrictions on data consumption are quite limiting.
- Flexibility - would be nice to be able to have more flexibility/customization (scripting etc. like Design Studio); I understand that there are some add-ons available but these are not publicized very widely.
- Unless using an analyst PC, it is extremely slow.
Use of SAP Lumira with ERP Simulation Software
- Easy to generate graphs
- Can change variables displayed/measured
- Integrates well with SAP
- Easy-to-use interface
- Neat, professional-looking graphs
- More flexibility for choosing variables
- Make it easier to link to SAP
- Support multiple views/graphs at once (tabs, multiple pages, etc.)
Lumira Review
- It is very intuitive to use.
- Visualizations allow the user to drill-down.
- No gauge visualization present in the default standard version.
- Takes very long to load. It is a memory hog.
- It needs to recommend the best chart for the available data.
- Intuitive
- Simple
- Complete
- Optimize mobile fuctionality
- A less complex version (designed for business owners/managers)
- More detailed graphics (in some cases)
Beginning with SAP Lumira
- Easy implementation of reports not only for developers
- Many available data sources
- Easy map integration
- Table visualization and drilldown
- Graphic objects management
- Calculated measures enchantments
Lumira will glow & grow
- Good way to connect to SAP HANA database.
- Easy to bring reporting based on HANA
- Like Sharing option on Lumira visualization. Also bundle option for dataset, story & visualization
- Not found yet as we are in early stage of testing.
Visualization at its nicest
- Ability to create multiple charts
- The share component of Lumira is a great function which we currently use.
- The UI is extremely user friendly, easy to use and understand
- The ability to load existing data sets so you don't have to always build reports from the ground up if you already have some created.
- It takes a minute or two to fully load, I feel that is too long of a delay.
SAP Lumira evaluation pre-buy
- Their Map capability and flexibility
- The powerful engine
- Ease-of-use
- Not often an aligned Company strategy to go with SAP (at least not in Sweden)
- The UI is not standard in the business, but fairly easy to learn anyway
SAP Lumira Review by Staff Con
- Visualization
- Click and drag
- User friendly
- Custom sorting
- Merge dimensions of separate data sources
- Elemental linking instead of just user input controls
BRAVO !!
- Create mapping visualizations. As communication is important, this software achieves it with brio !
- Manage massive amount of data. As we use a good amount of data, it's nice to have a software that is able to manage it, use it and filter it
- Sharing. As we work as a team, we always exchange our results. The sharing feature is very useful
- Maybe more documentation about the software itself, how it works, some modeling of the software, its composition in term of structure
- More tutorials
Still much work to do
- Upload from SAP-BW
- Still not very user-friendly