Overview
What is ScienceLogic SL1?
ScienceLogic is a system and application monitoring and performance management platform. ScienceLogic collects and aggregates data across and IT ecosystems and contextualizes it for actionable insights with the SL1 product offering.
SL1 in a Managed IT Services Environment
Monitoring Suite that lags way behind for Modern Use Cases
Apart from …
Sl1 Review
Feedback on ScienceLogic
***Wonders of SL1***
One-Stop Solution - ScienceLogic SL1
SL1 has been stronger partner to work with
ScienceLogic SL1 in my views
Insights of ScienceLogic monitoring tool
Science Logic : Journey from Better to Best
ScienceLogic SL1 Top Notch Monitoring Platform
ScienceLogic SL1
How ScienceLogic SL1 Differs From Its Competitors
Impact on Infrastructure Visibility
Using ScienceLogic to Support New Business
ScienceLogic Integration
Impact on Infrastructure Visibility
Using ScienceLogic to Support New Business
ScienceLogic Integration
Impact on Infrastructure Visibility
Using ScienceLogic to Support New Business
ScienceLogic Integration
Impact on Infrastructure Visibility
Using ScienceLogic to Support New Business
ScienceLogic Integration
Impact on Infrastructure Visibility
ScienceLogic Integration
Impact on Infrastructure Visibility
ScienceLogic Integration
Impact on Infrastructure Visibility
Using ScienceLogic to Support New Business
ScienceLogic Integration
Impact on Infrastructure Visibility
Impact on Infrastructure Visibility
Using ScienceLogic to Support New Business
ScienceLogic Integration
Impact on Infrastructure Visibility
Using ScienceLogic to Support New Business
ScienceLogic Integration
Impact on Infrastructure Visibility
Using ScienceLogic to Support New Business
Being an MSP means we have to be able to support a wide range of components that our clients have in their infrastructure.
Usually, these requirements have to be addressed quickly, so us being able …
ScienceLogic Integration
This integration automates the addition of newly discovered devices to a scheduled backup, and allows for generating EM7 events when, for instance, backups are failed. The …
Impact on Infrastructure Visibility
Using ScienceLogic to Support New Business
ScienceLogic Integration
Impact on Infrastructure Visibility
Using ScienceLogic to Support New Business
ScienceLogic Integration
Impact on Infrastructure Visibility
Using ScienceLogic to Support New Business
ScienceLogic Integration
Impact on Infrastructure Visibility
Using ScienceLogic to Support New Business
ScienceLogic Integration
Impact on Infrastructure Visibility
ScienceLogic Integration
Impact on Infrastructure Visibility
Using ScienceLogic to Support New Business
ScienceLogic Integration
Impact on Infrastructure Visibility
Using ScienceLogic to Support New Business
ScienceLogic Integration
Impact on Infrastructure Visibility
Using ScienceLogic to Support New Business
ScienceLogic Integration
Impact on Infrastructure Visibility
ScienceLogic Integration
Using ScienceLogic to Support New Business
ScienceLogic Integration
Impact on Infrastructure Visibility
Using ScienceLogic to Support New Business
ScienceLogic Integration
Impact on Infrastructure Visibility
Using ScienceLogic to Support New Business
ScienceLogic Integration
Impact on Infrastructure Visibility
Using ScienceLogic to Support New Business
Impact on Infrastructure Visibility
Using ScienceLogic to Support New Business
ScienceLogic Integration
Awards
Products that are considered exceptional by their customers based on a variety of criteria win TrustRadius awards. Learn more about the types of TrustRadius awards to make the best purchase decision. More about TrustRadius Awards
Reviewer Pros & Cons
Video Reviews
1 video
Pricing
Entry-level set up fee?
- Setup fee required
Offerings
- Free Trial
- Free/Freemium Version
- Premium Consulting/Integration Services
Starting price (does not include set up fee)
- $7.50 per month per node
Product Details
- About
- Integrations
- Competitors
- Tech Details
- Downloadables
- FAQs
What is ScienceLogic SL1?
The ScienceLogic SL1 platform aims to enable companies to digitally transform themselves by removing the difficulty of managing complex, distributed IT services. SL1 uses patented discovery techniques to find everything in a network, so users get visibility across all technologies and vendors running anywhere in data centers or clouds. The vendor states the advantage of SL1 is that it collects and analyzes millions of data points across an IT universe (made up of infrastructure, network, applications, and business services), to help users make sense of it all, share data, and automate IT processes.
With SL1, the user can:
- See everything across cloud and distributed architectures. Discover all IT components—–across physical, virtual, and cloud. Collect, merge, and store a variety of data in a clean, normalized data lake.
- Contextualize data through relationship mapping and machine learning (ML) for actionable insights. Use this context to understand the impact of infrastructure and applications on business service health and risk, accelerate root cause analysis, and execute recommended actions.
- Act on data that is shared across technologies and IT ecosystem in real time. Apply multi-directional integrations to automate workflows at cloud scale.
ScienceLogic SL1 Features
- Supported: Infrastructure Monitoring (Cloud, Container, Server, Storage, Agent-Based, Network, Application, Database, UC/Video, Synthetic)
- Supported: Closed-Loop Automations (Digital Experience Monitoring, CMDB & Inventory, Incident & Notifications, NetFlow, Configuration and Change Management, Troubleshooting & Remediation
- Supported: Topology-Driven Event Correlation
- Supported: Full-Stack Topology Mapping
- Supported: Business Service Monitoring
- Supported: Behavioral Correlation (Events, Changes, Anomalies, Topology)
- Supported: Analytics - ML-Based Anomaly Detection
- Supported: Incident Automation - Event Forwarding & Email
- Supported: Dynamic Baselining Analytics
- Supported: Manage Workflow Health & Endpoints
- Supported: Dashboards and Reporting
- Supported: Log Collection
- Supported: 400+ Pre-Built Monitoring Integrations
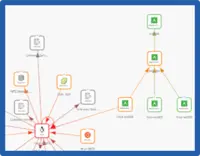
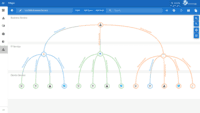
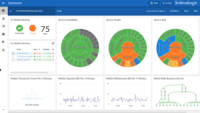
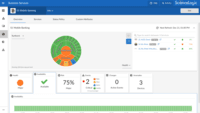
ScienceLogic SL1 Screenshots
ScienceLogic SL1 Videos
Watch Eliminating Visibility Gaps While Driving Tool Consolidation
Watch Diagnosing and Resolving Service Impacting Issues with Behavioral Correlation
Watch Automating Troubleshooting for Faster Root Cause Analysis
Watch CMDB Accuracy With Real-time Synchronization of Monitored Environment
Watch Understanding Infrastructure Impact on Apps with AppDynamics
ScienceLogic SL1 Integrations
- Kubernetes
- Cisco HyperFlex
- Nimble
- Hyper-V
- MySQL
- Dynatrace
- New Relic
- Cloud -AWS
- Azure
- Google Cloud
- IBM Cloud
- Aliyun
- CloudStack
- OpenStack
- etc.
- Cloud Services – Amazon EKS
- ECS
- Fargate; Azure AKS; etc.
- Containers – Docker
- etc.
- Software-defined Networks/WAN – Cisco
- VMware
- etc.
- Network - Cisco
- F5
- Juniper
- Meraki
- Riverbed
- Aruba
- Avaya
- Fortinet
- HP
- etc.
- Storage - Dell EMC
- NetApp
- HPE
- Hitachi
- Nutanix
- Pure Storage
- etc.
- Hypervisors – VMware
- Xen
- KVM
- etc.
- Operating Systems - Unix
- Windows
- Linux
- Business Applications
- Databases - Microsoft
- SAP
- Office 365
- MS SQL Server
- Oracle
- IBM DB2
- etc.
- APM - AppDynamics
- etc.
- etc.
- Storage - Dell EMC
- NetApp
- Pure
- HP/Nimble
- etc.
- Cloud -AWS
- Azure
- IBM
- Aliyun
- Openstack
- etc.
- Applications -Microsoft
- SAP
- etc.
- Compute -VMWare
- Microsoft Hyper-V
- KVM
- Linux
- Unix
- Converged -Nutanix
- Unified Communications and video - Cisco
- Polycom
- Tandberg
ScienceLogic SL1 Competitors
ScienceLogic SL1 Technical Details
| Deployment Types | On-premise, Software as a Service (SaaS), Cloud, or Web-Based |
|---|---|
| Operating Systems | Windows, Linux, Mac, UNIX |
| Mobile Application | No |
| Supported Countries | Americas, EMEA, APAC |
| Supported Languages | English |
ScienceLogic SL1 Downloadables
Frequently Asked Questions
ScienceLogic SL1 Customer Size Distribution
| Consumers | 0% |
|---|---|
| Small Businesses (1-50 employees) | 0% |
| Mid-Size Companies (51-500 employees) | 0% |
| Enterprises (more than 500 employees) | 100% |
Comparisons
Compare with
Reviews and Ratings
(380)Attribute Ratings
- 9.2Likelihood to Renew19 ratings
- 9.9Availability13 ratings
- 8Performance13 ratings
- 9Usability13 ratings
- 6.4Support Rating18 ratings
- 8.6Online Training5 ratings
- 8.3In-Person Training5 ratings
- 8.1Implementation Rating78 ratings
- 10Configurability7 ratings
- 8Product Scalability1 rating
- 7.8Ease of integration14 ratings
- 7.7Vendor pre-sale4 ratings
- 8.5Vendor post-sale5 ratings
- 8.5ScienceLogic Infrastructure Visibility Rating68 ratings
Reviews
(76-100 of 207)Just the beginning
- Increased speed and efficiency of onboarding new environments.
- Contextual troubleshooting with IT and Business Services.
- Consolidation of toolsets.
- Requires deep knowledge of the product, time to upskill.
- Do not assume everything works straight out of box, be prepared to develop code.
- Business resistance to change and expenditure.
SciLo
- You can integrate automation.
- Monitoring devices for outages.
- Scheduling for device maintenance window.
- Modernized display or GUI.
- Additional tools for monitoring.
- Device logging.
ScienceLogic SL1's Benefits with the environment
- The automation of monitoring
- The integration to ticketing tools
- Can change schedules and automate the maintenance schedule of the device to prevent alerts
- For now, I can't see any problem with ScienceLogic SL1, however, I think it's good to put an option or settings with the TimeZone, since our office is in AU but we're working in the PH.
Good tool, not excellent
- Agentless monitoring
- Capacity monitoring
- Cloud capacity monitoring
- General integration through snippets/api/RBA
- Development documentation is still required.
- Out of the box integration with event management tools.
My ScienceLogic Review
- Dynamic Applications: Able to build custom applications which makes us more scalable.
- CMDB population: Automatic CI population of assets and attributes provides excellent inventory reporting and helps with billing.
- Dashboards: Excellent ways to build custom views of devices and graphs helps to get a good view of the health of a customer's system.
- Upgrades: Looking forward to the new Yum deployment.
- Interface management: I want to be able to disable/not discover certain interfaces. Filters by type, device class, ifDescr, org, etc. would be lovely.
Just a try
- Correlation
- Incident reduction
- P1 Outage handling
- Dashboards
- On your website, please include a doc for the offline upgrade if it is not there, as I didn't find one.
- ITSM testing with ServiceNow.
- PerconaCluster.
ScienceLogic SL1 review and why you should use it
ScienceLogic helps solve a number of problems:
- Monitoring of status and performance of assets and services.
- Displays and views via dashboards and Business Service views of the overall health/risk and performance of key higher-level services.
- Event-based automation. ScienceLogic is a great platform to launch automated actions from. It comes with a large number of pre-build infrastructure specific scripts, which are easy to customize (with basic knowledge of Python).
- Integration with other IT deliver tools such as ITSM tooling & CMDB.
- Auto-generation of network maps that show asset dependency.
- Status and performance monitoring with great de-duplication of events.
- Event-based automation.
- Easy integration with ITSM tools for CMDB, Incident Management and Change Enablement.
- Dashboards and Business Service views.
- Network dependency mapping.
- One of the strengths of ScienceLogic is its investment in the roadmap and development.
- SL always listen to ideas on how we think we can improve the product.
When applied with the 'correct philosophy' it can deliver a great reduction in effort and efficiency in supporting an IT environment. The SL marketing material makes some bold claims about the efficiency and reduction in MTTR that can be achieved. I agree that these efficiencies can be achieved in the real world when applied looking at the whole IT Support processes.
We use ScienceLogic across the organization to monitor both our infrastructure and the health endpoints of services, and have found it gives us great visibility of system health. We are currently exploring moving away from competent level dashboarding and moving to dashboarding that will display the business services and show the impact a component failure has on that service as well as any other services dependent or linked to it.
In 2020 we carried out a migration to ScienceLogic’s SaaS platform to remove the requirement of both hosting and managing onsite DBs and this has also opened up new opportunities we are exploring within ScienceLogic.
- Easy to install and configure.
- Good level of detail/information captured from the monitoring.
- Great engagement from account managers, CSM’s and support teams.
- Reduce the time it takes to fix support requests.
We have a great relationship with ScienceLogic and always find them very helpful and engaging if we are faced with an issue or require assistance with a problem.
We have recently started testing ScienceLogic’s automated restart features which so far have proved [to be] a great feature and fits in with our automation vision.
ScienceLogic - Enterprise Considerations
- Deep monitoring across infrastructure components and with 8.12 across application layers
- Device discovery which builds infrastructure components
- ServiceNow Integration for CMDB driven device discovery as well as event-to-incident integration and automation
- Runbook Automation controlling notification as well as leading to remediation capabilities
- Event richness enabling detection of leading events which occur prior to a failure
- 12 introduces #multitenancy support which enables Enterprise with many Organizations to share (read-only) properties and performance data across Organizations without compromising credentials with inappropriate access. This is the first release of this feature and we are only now evaluating the well-communicated delivery against our requirements. This has been communicated as only being applicable via the new UI.
- Monitor thyself. We have found data gappiness issues which stem from incomprehensible / non-actionable system messages. The system is unable to communicate SIGTERM when used as a timeout (implying capacity issues) and SIGTERM when actually used as a fault (implying something non-actionable). The advisory services team is going to help, but this needs to be productized and shipped rather than be made available by customer success manager engagement. Things that SHOULD have results but do not should throw a under-collected event by the type of collection which is under reported. This should have a dynamic part of the event giving specific numbers not bland / generic statements that have to be interpreted. The platform team should immediately recognize the fault because the numbers are relevant. These events should be actionable, either referencing KB articles or some other specific remediation plan.
- Data collector load v. capacity planning in both a vertical (cpu, memory, disk) and horizontal (more collectors). The data collector specs are very stale. 4x24G is recommended for 1000 devices but customers frequently view that as individual devices, not the DCM trees found during discovery. Those tend to be my expect N (<= 1000) devices + M (which are barely understood records and which are typically treated as zero, when in fact these devices are what blow through the assumed 4x24G capacity spec). Need a horizontal-infra-scaling event as well as a vertical-capacity-limit event to be thrown when more collectors are needed.
- Actionable events. My end users barely understand the events. Referencing a KB article by URL might help users and admins in remediation. If you already understand the events they are obvious. If you don't, such as timeouts, having an article which helps people identify standard remediation steps will help close outages faster. Most events are contextual. Pointing users at that context will help.
SL1 - review
- Flexible
- Expandable
- Service provider level
- Very detailed
- Complicated
- Lack of support from SL1
- Support sucks
- PS team sucks
- No SLa on support, it’s a joke
ScienceLogic SL1 Review
- Server monitoring
- Network monitoring
- Application URL monitoring
- Database monitoring
- Dashboard customization process needs to be improved
- Reporting part requires improvement
- Agent-based monitoring needs to be improved
Solid Monitoring
- SNMP Monitoring
- MIB Importing
- OID Mapping
- WMI Monitoring
- RBAC
- Dashboards
- Device Mapping
- Monitor the large set of network devices very well.
- Gives a detailed analysis of system performance in terms of graphs which makes it easy to read and understand.
- Nice GUI to facilitate all the required options in the front without missing the deep dive options in case if someone wants to look into details.
- Placement of the options are in such a way that it is very convenient for the engineers to look into the information they are seeking.
- Taking the auto backup of the devices will be one feature I would like to see in it.
- Running the script on the devices feature will be very useful.
- Firing the command on set of devices will be an added advantage.
ScienceLogic is a Logical Choice
- Versatile
- Integrated with our existing environment
- Customize
- Expensive
- No standard template
My ScienceLogic Review
- Network Discovery: It is able to discover devices based on a plethora of mechanisms (SNMP, API, Netconf, etc.) with little effort.
- Event processing: It includes event policies for a massive number of technology-specific events with a granular severity classification schema.
- Dynamic modeling: It is highly accurate in determining which collections (performance, faults, etc.) are aligned to each network node or component based on the discovered device class.
- Reporting: The reporting engine embedded in ScienceLogic is not really robust and does not provide a development framework that provides the level of sophistication demanded by certain technologies.
- Scalability: ScienceLogic DB does not scale very well for large networks or, at least, the sizing criteria are not clearly defined.
- Integration with ITSM systems.
Initial thoughts on ScienceLogic SL1
- User friendly
- SNMP monitoring
- Powerpacks
- Dynamic applications features
- BGP monitoring
- Improve Windows monitoring
Flexibility, performance, and capability. Ideal platform to do more than you expect from a single product.
- Flexibility and coverage for the full spectrum of device types and use cases.
- Robust automation and event management interaction.
- Ability to write custom snippets for various actions/collections creates high customization ceiling for solving problems.
- HA/DR requires dedicated physical hardware to my knowledge.
Very good, not wonderful
- Agentless solution minimizes the time we spend patching for security needs.
- Report and Dashboard are easy to create and use
- Price
- Easy customization
- Runbook automation
- The data collectors/database required hardware is way more complex than the documentation indicates. When you use more "heavy" collections (such as PowerShell), achieving 5k devices or more you will need some hundreds of RAM for your database and some dozens of RAM for your collections.
- There are several powerpacks that need to be enhanced (some are really bad). We had to develop several snippets on our own.
- If you want to use the tool a little bit deeper you should program in python and know what is being monitored.
- Not a good solution to monitor logs (agentless solution that requires an agent to monitor logs)
Powerful but complicated.
- Flexibility through scripting.
- Easy installation and upgrade.
- Wide community on the internet.
- Unwanted automation that causes rework like the auto alignment monitoring.
- Database monitoring on a full spectrum.
- Old GUI still connected with Nagios.
SL1 Datacenter Monitoring
- Discovery of different types of devices in one session using multiple credential types
- Very custom dashboards
- granular roles and rights
- Support could be more responsive
SiLo prevents silo's
- Discovery and Monitoring
- Contextual Analytics
- Integrations to ServiceNow
- Dashboards
- Reporting
- Training
In a world of shiny objects and hip new projects, ScienceLogic is a blast from the past.
- The platform has been relatively stable. As far as I know no outages outside of upgrades.
- The platform has good out of the box support for common enterprise platforms like VMWare and Pure Storage.
- It provides a nice event viewer for a single page displaying all events happening in your environment.
- The point in time nature of the data points can be misleading. The data would be more valuable in some cases if the 5 minute polling interval was an average value of the previous 5 minutes, not point in time when the collection happens.
- Container and Kubernetes monitoring is poor. Granted we are a few months behind of upgrades, so haven't been able to try out the latest versions.
- Snippet development within the platform is not ideal. There really needs to be a way to source snippets from Git repositories, so code can be versioned and tested outside of the platform.
- Testing snippets outside of the platform can be challenging. We would really like to have some mock test framework we could pull into our testing suite so unit testing complex snippets is easier.
ScienceLogic SL1 Review
- Auto-scanning for inventory registration
- Write your own powerpack and can use in all similar environments
- No agent installation required to perform monitoring
- Need Python skill
- Remote connection method for monitoring may be blocked by security compliance control
- Each server or monitoring target will require credentials stored in SL1. If different devices use different credentials, they may cause trouble.
It's less appropriate for the more complicated and less standard (customized) environment, each monitoring target will require different customized environment. It will need to customize in SL1 and cost us lots of monitoring implementation schedule.
SL1 allows you to monitor more, with less noise.
- Event correlation.
- Solid architecture.
- IT Service monitoring.
- Complex.
- Steep learning curve.
- Dated UI.
The tool that keeps on evolving
- Customization
- Support
- Pricing
- Clarity around alerting
- Roadmap for alerting and technologies
- GUI and ease of use
- Reporting


