TrustRadius
Sigma

Sigma

Overview

What is Sigma?

Sigma Computing headquartered in San Francisco provides a suite of data services such as code free data modeling, data search and explorating, and related BI and data visualization services.

Read more
Recent Reviews

Sigma Recommended.

8 out of 10
February 19, 2024
Incentivized
We use it to embed onto our website for client-facing reporting and internal reporting for our teams that need to see our Sigma data but …
Continue reading

Sigma Rolling Out.

9 out of 10
February 16, 2024
Incentivized
We use Sigma all day everyday to achieve our production goals and monitor current progress at just a glance. It aids us in planning and …
Continue reading

My Sigma Review

10 out of 10
February 13, 2024
Incentivized
Used for KPI dashboards, monthly/quarterly financial reporting, tracking data sets, and manipulating data. I have used Sigma to make …
Continue reading

Sigma Review

10 out of 10
February 08, 2024
Incentivized
I use Sigma Computing to find patterns in my data and create dashboards to strategize business decisions based on my analysis. I enjoy …
Continue reading

Love Sigma

9 out of 10
January 10, 2024
Incentivized
I create analytics reporting for many stakeholders. I make customer data available on a variety of dashboards to our account managers, I …
Continue reading

Sales Ops Usage

7 out of 10
August 30, 2023
Incentivized
Key sales KPIs, stack-ranking sales people on activity and conversion. We also use it for executive reporting, distilling the health of …
Continue reading
Read all reviews

Awards

Products that are considered exceptional by their customers based on a variety of criteria win TrustRadius awards. Learn more about the types of TrustRadius awards to make the best purchase decision. More about TrustRadius Awards

Popular Features

View all 15 features
  • Drill-down analysis (150)
    8.5
    85%
  • Report sharing and collaboration (156)
    8.2
    82%
  • Customizable dashboards (155)
    7.7
    77%
  • Formatting capabilities (157)
    7.3
    73%

Reviewer Pros & Cons

View all pros & cons
Return to navigation

Pricing

View all pricing
N/A
Unavailable

What is Sigma?

Sigma Computing headquartered in San Francisco provides a suite of data services such as code free data modeling, data search and explorating, and related BI and data visualization services.

Entry-level set up fee?

  • Setup fee optional

Offerings

  • Free Trial
  • Free/Freemium Version
  • Premium Consulting/Integration Services

Would you like us to let the vendor know that you want pricing?

153 people also want pricing

Alternatives Pricing

What is Microsoft Power BI?

Microsoft Power BI is a visualization and data discovery tool from Microsoft. It allows users to convert data into visuals and graphics, visually explore and analyze data, collaborate on interactive dashboards and reports, and scale across their organization with built-in governance and security.

What is Tableau Desktop?

Tableau Desktop is a data visualization product from Tableau. It connects to a variety of data sources for combining disparate data sources without coding. It provides tools for discovering patterns and insights, data calculations, forecasts, and statistical summaries and visual storytelling.

Return to navigation

Features

BI Standard Reporting

Standard reporting means pre-built or canned reports available to users without having to create them.

7.2
Avg 8.2

Ad-hoc Reporting

Ad-Hoc Reports are reports built by the user to meet highly specific requirements.

7.8
Avg 8.1

Report Output and Scheduling

Ability to schedule and manager report output.

8.8
Avg 8.4

Data Discovery and Visualization

Data Discovery and Visualization is the analysis of multiple data sources in a search for patterns and outliers and the ability to represent the data visually.

6.4
Avg 8.1
Return to navigation

Product Details

What is Sigma?

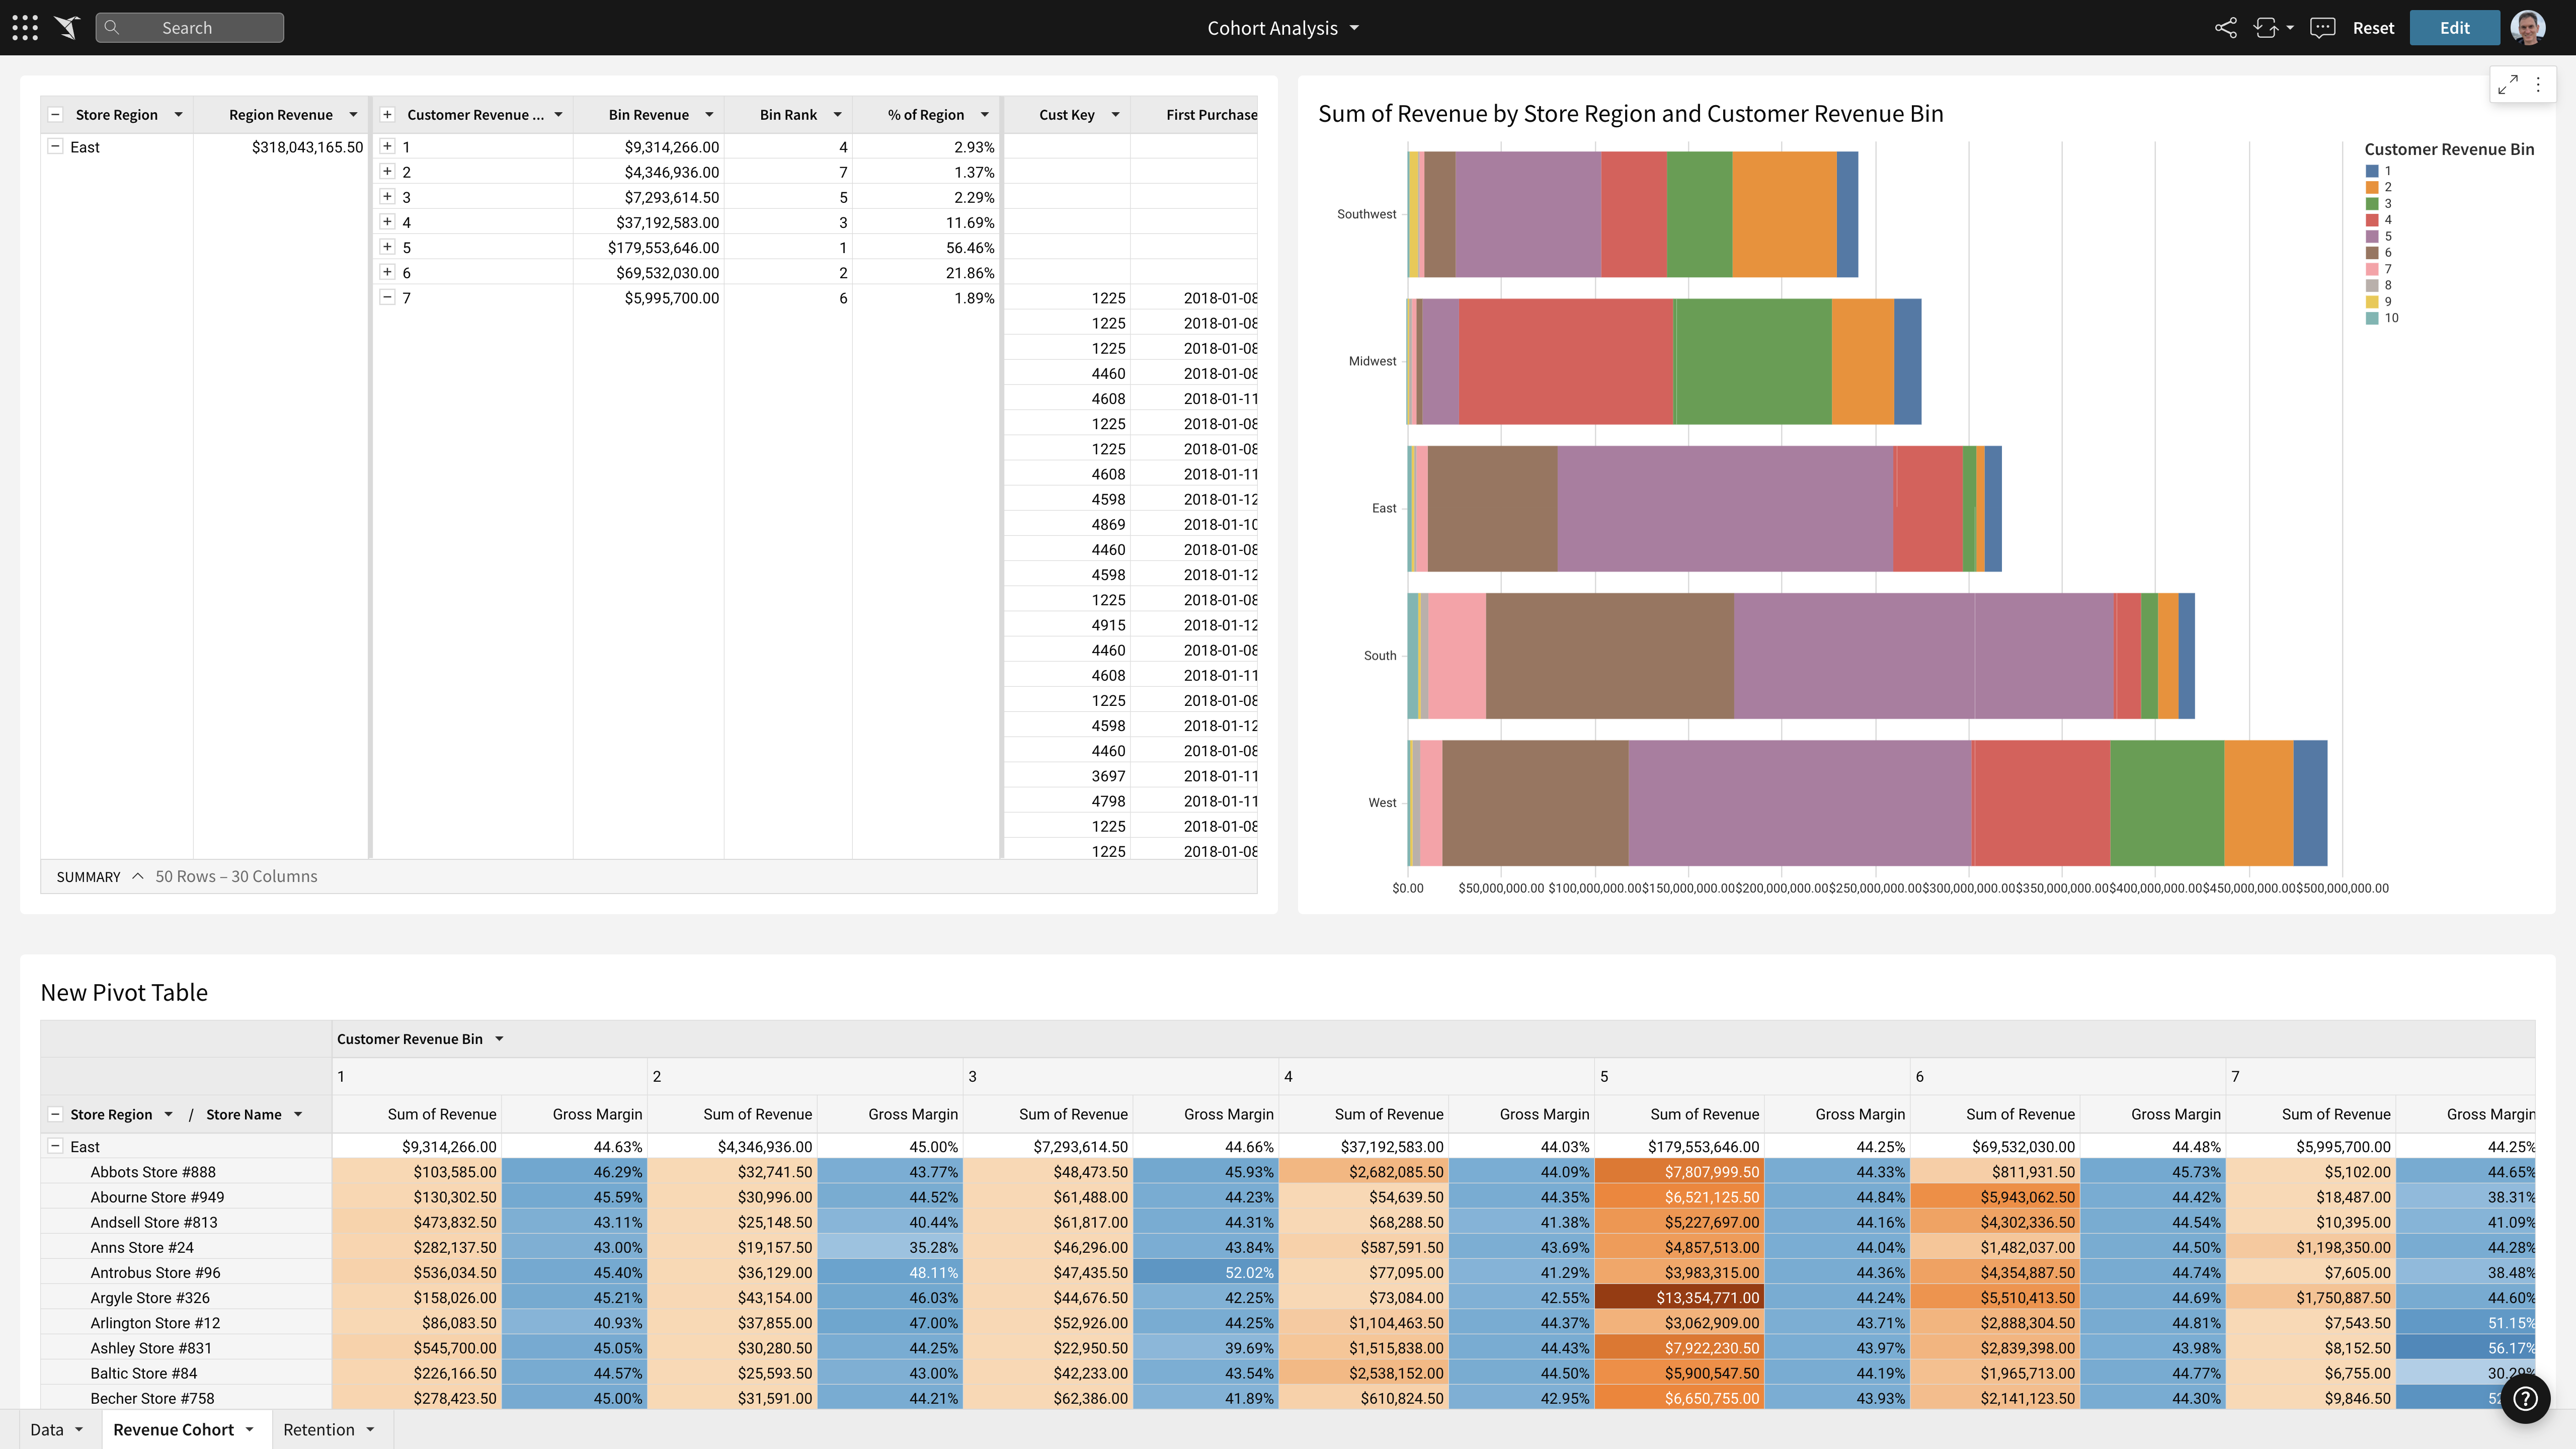
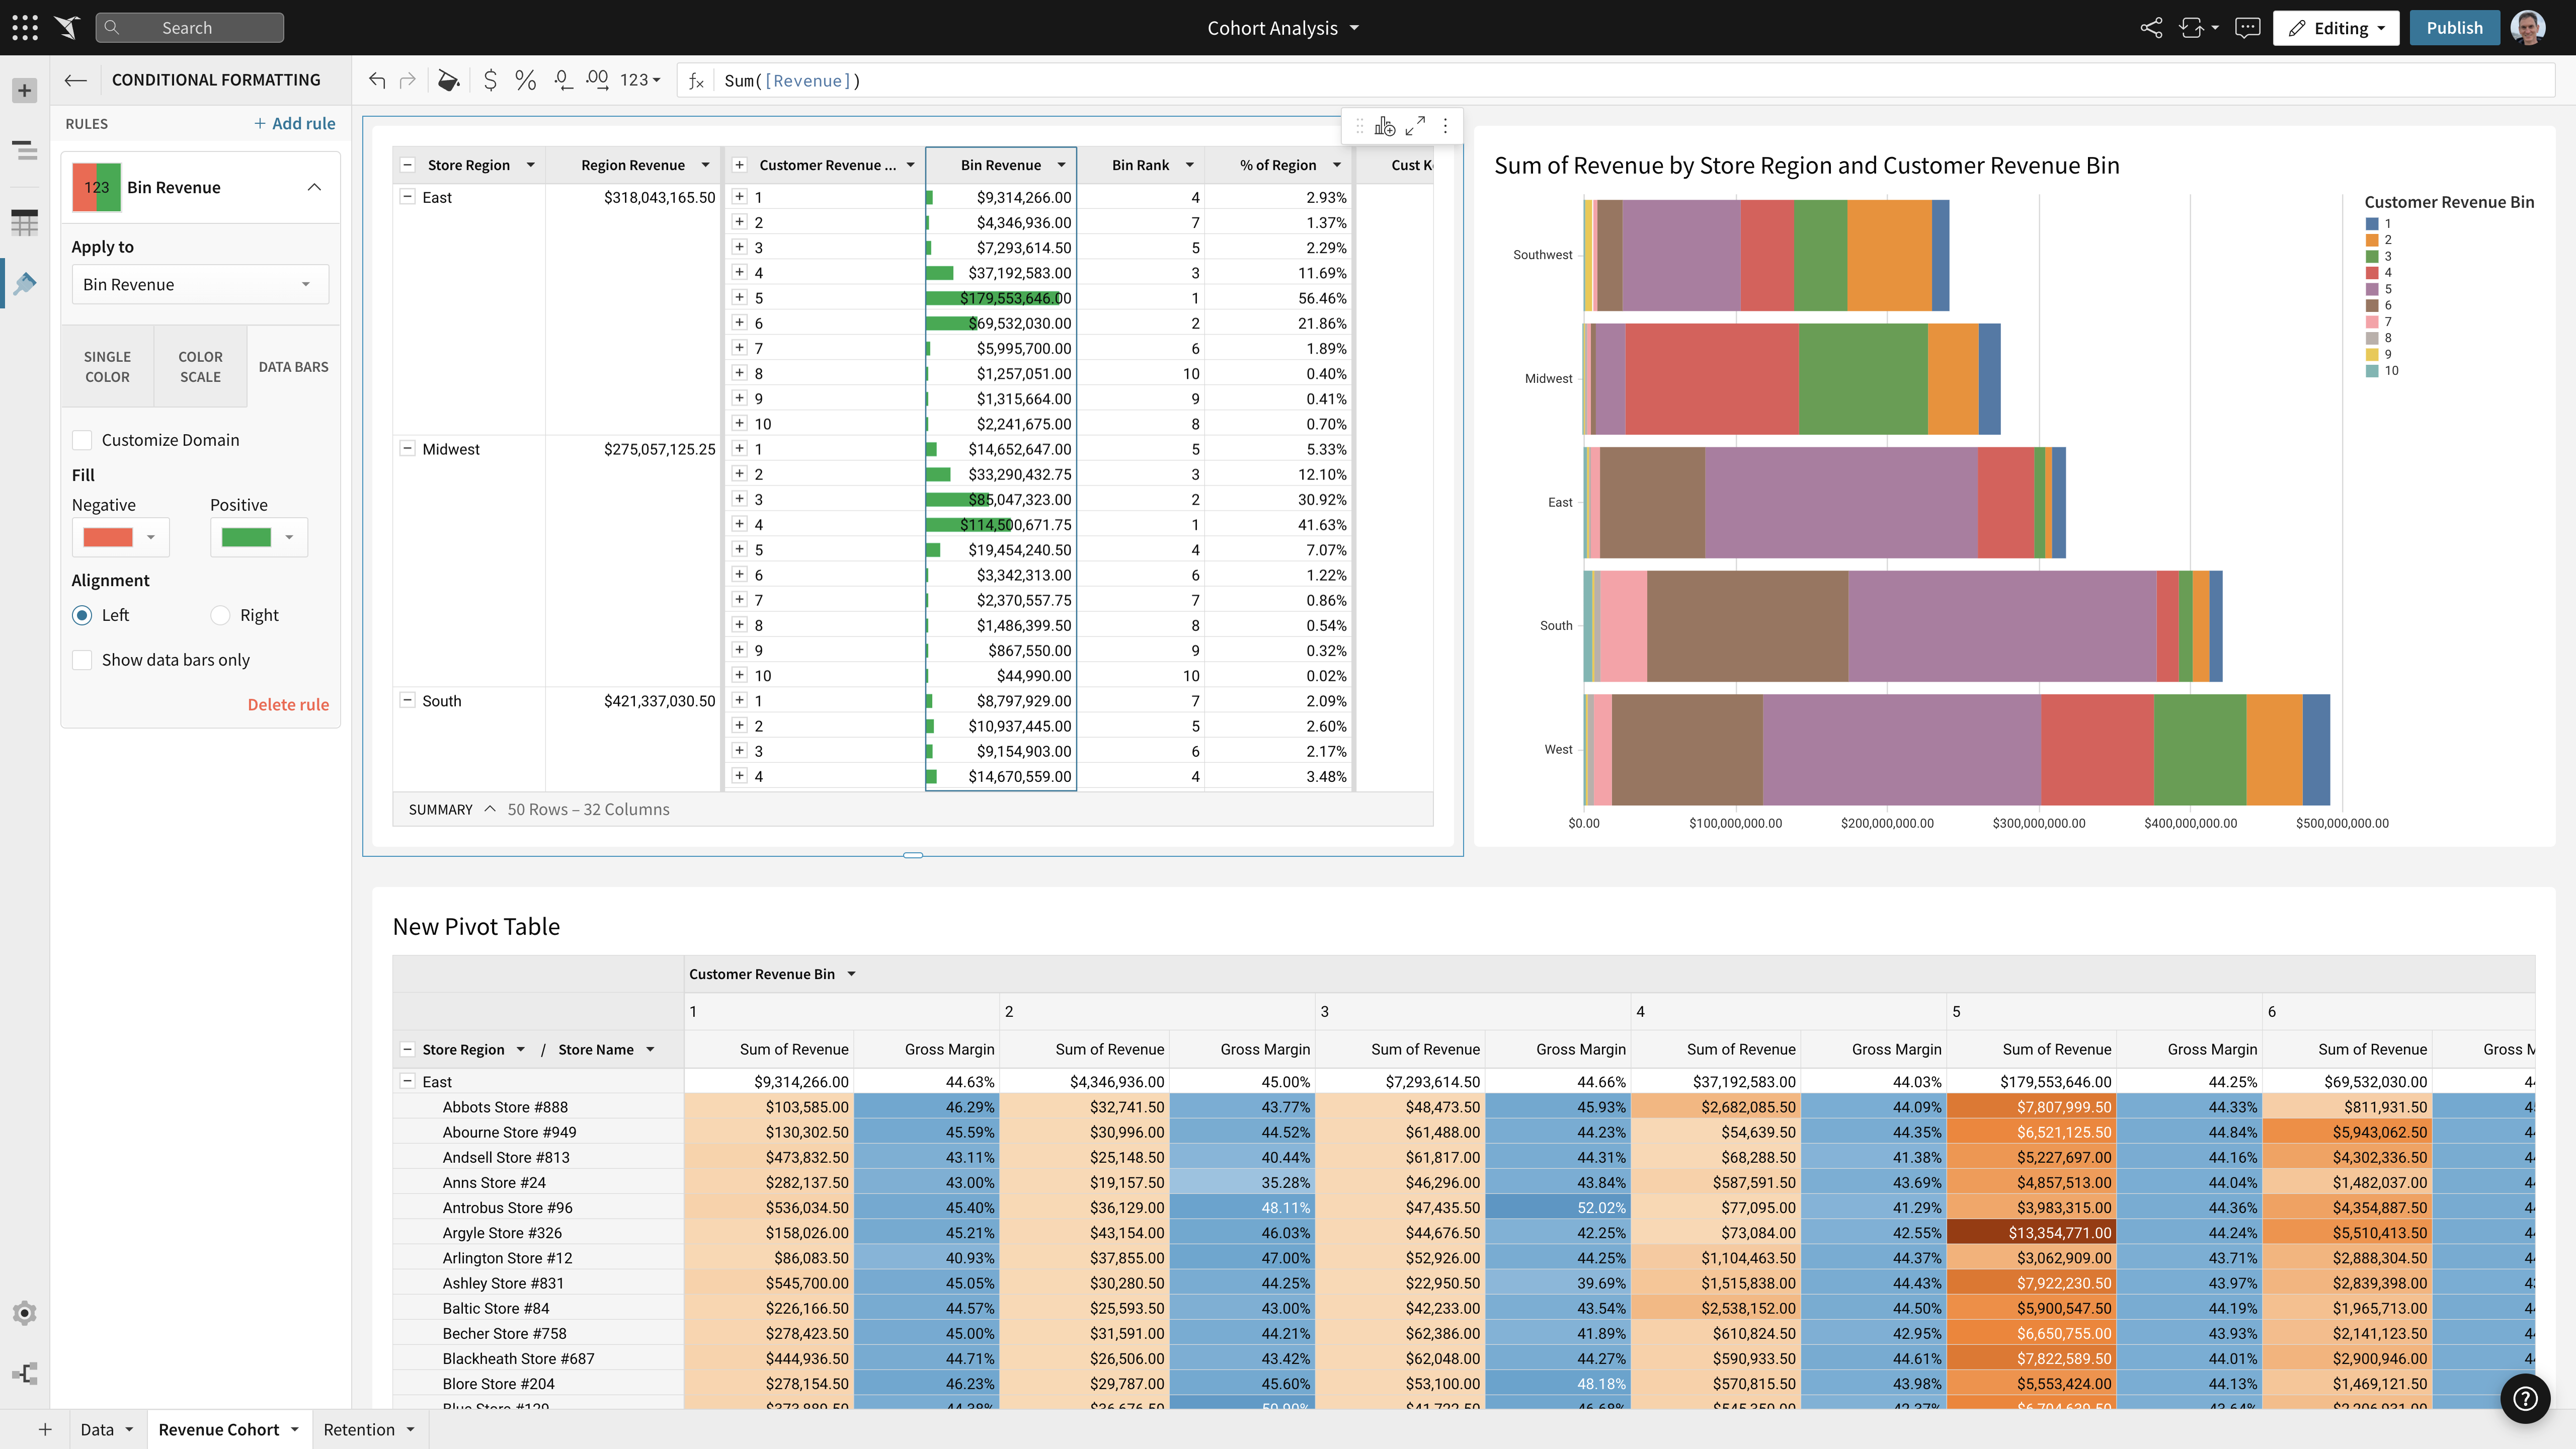
Sigma is a business intelligence (BI) and analytics platform purpose-built for the cloud. With Sigma, anyone can use the spreadsheet functions and formulas they already know to explore live data at cloud scale, down to the lowest grain of detail. Its familiar spreadsheet-like interface delivers SQL into the hands of any user while keeping data fresh and secure within cloud data warehouses.


Data-first companies can use Sigma to empower their employees, customers, and partners to break free from the confines of the dashboard and explore data for themselves to make better, faster decisions. The software was built to capitalize on the performance power of cloud data warehouses to combine data sources and analyze billions of rows of data instantly – no coding required.

Sigma Features

BI Standard Reporting Features

  • Supported: Pixel Perfect reports
  • Supported: Customizable dashboards
  • Supported: Report Formatting Templates

Ad-hoc Reporting Features

  • Supported: Drill-down analysis
  • Supported: Formatting capabilities
  • Supported: Predictive modeling
  • Supported: Report sharing and collaboration

Report Output and Scheduling Features

  • Supported: Publish to Web
  • Supported: Publish to PDF
  • Supported: Output Raw Supporting Data
  • Supported: Report Versioning
  • Supported: Report Delivery Scheduling
  • Supported: Delivery to Remote Servers

Data Discovery and Visualization Features

  • Supported: Pre-built visualization formats (heatmaps, scatter plots etc.)

Sigma Screenshots

Screenshot of Custom calculations that can be added to tables and visualizations – no SQL skills necessary.Screenshot of Visualization tableScreenshot of Custom bins to drive complex cohort analysis built without SQL code.Screenshot of Complex cohort analyses built without code.Screenshot of Lookups provide familiar spreadsheet functionality to business users.Screenshot of A Sigma Workbook, that brings together spreadsheets, charts, and data narratives onto a live, collaborative canvas.Screenshot of Visualizations, that can be sorted, filtered, and drilled into, to the unconstrained underlying data.Screenshot of Spreadsheet formulas, that can be used to add calculated fields to pivot tables without coding.

Sigma Videos

What is Sigma?
Cohort analysis with Sigma
Sigma for Sales Teams Demo
Rapid Data Prototyping with Sigma
Building Pivot Tables with Sigma
Embedded Analytics with Sigma
Parsing JSON in seconds with Sigma
Sigma Demo at Snowflake Summit

Sigma Technical Details

Deployment TypesSoftware as a Service (SaaS), Cloud, or Web-Based
Operating SystemsUnspecified
Mobile ApplicationMobile Web
Supported CountriesUnited States, Canada

Frequently Asked Questions

Sigma Computing headquartered in San Francisco provides a suite of data services such as code free data modeling, data search and explorating, and related BI and data visualization services.

Tableau Desktop, Tableau Cloud, and Looker are common alternatives for Sigma.

Reviewers rate Report Versioning highest, with a score of 9.4.

The most common users of Sigma are from Mid-sized Companies (51-1,000 employees).
Return to navigation

Comparisons

View all alternatives
Return to navigation

Reviews and Ratings

(287)

Attribute Ratings

Reviews

(1-25 of 110)
Companies can't remove reviews or game the system. Here's why
Randall Hidajat | TrustRadius Reviewer
Score 7 out of 10
Vetted Review
Verified User
Incentivized
Because there is still a learning curve, there are not that many people in our organization that can utilize Sigma to build out their own reporting. We still have many different blockers regarding ad hoc analyses or why something happened in order to make decisions.

We are currently only at a point where we can at a high level determine success or not. We are not able to currently dive a little deeper to understand where those opportunities are.
February 16, 2024

Sigma Rolling Out.

Score 9 out of 10
Vetted Review
Verified User
Incentivized
The live reports helps us see and address any changes that occur. Be it new inventory or why a unit may not be moving. We are able to see it and be reactive or proactive and plan ahead.
February 13, 2024

My Sigma Review

Score 10 out of 10
Vetted Review
Verified User
Incentivized
This has helped me dig into my Snowflake data sets to identify problems in how our data has been pushed, or problems in our pipeline between table creation. We have data coming from many sources that is connected in Snowflake, and it is easier to comb through tables in Sigma rather than write a lot of queries in Snowflake to find answers.
February 08, 2024

Sigma Review

Score 10 out of 10
Vetted Review
Verified User
Incentivized
Control filters have allowed me to analyzebig chunks of data and find hidden patterns within it. I am
able to turn a filter on and off to compare different results based on different categories. This has been immensely helpful when comparing different products and their analyzing their efficiency. I also leverage control filters to group certain groups of users together and compare and contrast their behaviors.
Score 8 out of 10
Vetted Review
Verified User
Incentivized
Sigma's table and dataset creation capabilities make it easy to create time-series based reporting to understand not only why something happened, but the history behind when it happened. We use this functionality in many of our reports. Having the ability to join tables created in Sigma, back to warehouse tables, or other Sigma components, makes this very fluid and easy to understand what is happening in the data.
Score 9 out of 10
Vetted Review
Verified User
Incentivized
Personally, my role does more building out the reports for stakeholders to use and to create data pipelines to make it feasible to make that happen. However, sometimes more for personal edification of better understanding certain trends in the business I look into the data.
Score 9 out of 10
Vetted Review
Verified User
Incentivized
Sigma allows for datasets to be quickly and easily ported from our database management software, Snowflake. In other words, a sample dataset can easily be published in Snowflake and copied to Sigma for small scale, adhoc analysis that needs to be performed quickly. Alternatively, our team can also choose to more thoroughly vet and automate a dataset to refresh in Sigma on whatever cadence we choose if we know ongoing analysis and monitoring is required. In other words, Sigma allows us to handle all relevant use cases for data analysis that we typically encounter.
Score 9 out of 10
Vetted Review
Verified User
Since creating Sigma content is quite quick and easy, our analysts can create Sigma content to answer ad-hoc questions, if the user thinks they'll need the data more than once. We can easily revert back to earlier versions of dashboards to see what the state of the data would have been in a previous iteration.
Jose F. Gomez | TrustRadius Reviewer
Score 10 out of 10
Vetted Review
Verified User
Incentivized
Sigma has helped us by getting intertwined deeply in our weekly processes so that we are able to continuously visualize business behavior by looking at the data. It helps us understand and identify trends early and react to potential impacts, it lets us prepare for a negative outcome and come out stronger than if we didn’t have it.
August 30, 2023

Sales Ops Usage

Score 7 out of 10
Vetted Review
Verified User
Incentivized
I pull data from sigma into gSheets still. Sigma is helpful for structuring the data into a table and making it easily accessible. However, I’m not quick enough in sigma to do the actual analysis and look for correlations all the time so i still will do a lot of the analysis in gSheets
Score 9 out of 10
Vetted Review
Verified User
Incentivized
Sigma Computing is easier to use and help our team to streamline our analysis on pricing gap from our third party pricing vendors. Also, we can quickly identify where and what exactly had gaps in the pricing coverage. We can also use graphs to quickly show case our result to senior management to reach conclusions.
Tyler Lawson | TrustRadius Reviewer
Score 10 out of 10
Vetted Review
Verified User
Incentivized
Because Sigma is so easy to use it's really easy to create quick reports on questions I may have about my data and get answers into the hands of stakeholders via easy sharing. Because of it's spreadsheet like interface it's really easy to drill down into charts to see the underlaying data and understand what may be pulling a metric one way or another.
Score 10 out of 10
Vetted Review
Verified User
Incentivized
the load time for dashboard helped user to utilize dashboards more often and improved user experience compare to Tableau. The easy way to export underlying data to google sheet allow business user to do more in-depth Analysis without reaching out to data team

for some more technical user, we can just give them prepared dataset, and they can explore by themselves.
Return to navigation