TrustRadius
Splunk Infrastructure Monitoring

Splunk Infrastructure Monitoring
Formerly SignalFx

Overview

What is Splunk Infrastructure Monitoring?

SignalFX is Real-Time Cloud Monitoring and Observability for Infrastructure, Microservices and Applications. SignalFX was acquired by Splunk in August 2019. SignalFX Infrastructure Monitoring provides real-time cloud monitoring and observability platform for infrastructure, microservices and DevOps. A new SignalFX product, SignalFx…

Read more
Recent Reviews

TrustRadius Insights

Splunk Infrastructure Monitoring, formerly known as SignalFx, has been widely used across organizations for continuous monitoring of cloud …
Continue reading

observability

10 out of 10
June 17, 2022
Incentivized
To gain observability over a distributed higher education environment is so important - and this product helps build that infostructure …
Continue reading

Splunk review

8 out of 10
March 25, 2022
Incentivized
I use Splunk Monitoring as a primary monitoring tool in our Cloud Infrastructure. The data is pushed from the agent to Splunk Server. We …
Continue reading
Read all reviews

Awards

Products that are considered exceptional by their customers based on a variety of criteria win TrustRadius awards. Learn more about the types of TrustRadius awards to make the best purchase decision. More about TrustRadius Awards

Reviewer Pros & Cons

View all pros & cons
Return to navigation

Pricing

View all pricing

Entry-level set up fee?

  • No setup fee
For the latest information on pricing, visithttps://www.splunk.com/en_us/products/p…

Offerings

  • Free Trial
  • Free/Freemium Version
  • Premium Consulting/Integration Services

Starting price (does not include set up fee)

  • $15 per month
Return to navigation

Product Details

What is Splunk Infrastructure Monitoring?

Splunk Infrastructure Monitoring aims to enable faster innovation, operational agility, and better customer experience through real-time AI-driven streaming analytics allowing accurate alerts in seconds. Splunk Infrastructure Monitoring is designed to shorten MTTD and MTTR by providing real-time visibility into cloud infrastructure and services. These benefits are built on Open-Source frameworks, eliminating vendor lock-in and built for cloud-native enterprise scale to support even the largest of environments.

Splunk Infrastructure Monitoring Screenshots

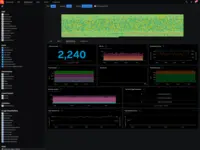
Screenshot of Real-time monitoring for public, private and hybrid cloud

Splunk Infrastructure Monitoring Competitors

Splunk Infrastructure Monitoring Technical Details

Deployment TypesSoftware as a Service (SaaS), Cloud, or Web-Based
Operating SystemsUnspecified
Mobile ApplicationApple iOS

Frequently Asked Questions

SignalFX is Real-Time Cloud Monitoring and Observability for Infrastructure, Microservices and Applications. SignalFX was acquired by Splunk in August 2019. SignalFX Infrastructure Monitoring provides real-time cloud monitoring and observability platform for infrastructure, microservices and DevOps. A new SignalFX product, SignalFx Microservices APM, was released March 2020 to detect issues, provide real-time app troubleshooting, and future-proof expectations.

Splunk Infrastructure Monitoring starts at $15.

Datadog, Prometheus, and New Relic are common alternatives for Splunk Infrastructure Monitoring.

The most common users of Splunk Infrastructure Monitoring are from Enterprises (1,001+ employees).
Return to navigation

Comparisons

View all alternatives
Return to navigation

Reviews and Ratings

(87)

Community Insights

TrustRadius Insights are summaries of user sentiment data from TrustRadius reviews and, when necessary, 3rd-party data sources. Have feedback on this content? Let us know!

Splunk Infrastructure Monitoring, formerly known as SignalFx, has been widely used across organizations for continuous monitoring of cloud resources and application statuses. Users have relied on Splunk Infrastructure Monitoring to aggregate data from various areas and correlate them to pinpoint problem areas. Different applications within organizations have used Splunk to monitor core infrastructure, back-end app servers, front-end servers, databases, and other parts of the application. Splunk Infrastructure Monitoring has helped track hundreds of device endpoints, providing visibility into each device and the ability to customize the data received from them.

The monitoring capabilities of Splunk Infrastructure Monitoring have helped detect device problems and automatically remediate them in some cases. Users have determined custom logs to capture, noted their locations and hosts, and gathered sample log files for Splunk ingest. Splunk Infrastructure Monitoring has been used to monitor AWS infrastructure, troubleshoot issues, and provide visualizations of different data types. It has also been used to monitor Azure and on-prem resources, as well as application health. The product has served as the primary monitoring and alerting solution for infrastructure and application metrics, helping maintain uptime on systems and address business problems related to system monitoring.

Splunk Infrastructure Monitoring has delivered real-time monitoring and troubleshooting across various platforms, enabling instant visualization, alerts, insights, and troubleshooting steps. It has provided observability over a distributed higher education environment and helped build an infrastructure map for steering decisions. The product has been used for incident detection and prevention, monitoring logs, and saving logs for all necessary cases. Splunk Infrastructure Monitoring has been used as a primary monitoring tool in Cloud Infrastructure, managing dashboards and incidents. It has offered deep insights into system and network activities, monitored applications, and alerted when applications go down. The product has helped monitor service health, diagnose issues, and show data in a manner that exposes the desired information. It has been used to monitor infrastructure and services, set baselines, and analyze logs for trends, issues, improvements, and reporting.

Customers have found value in the proactive monitoring features of Splunk Infrastructure Monitoring, allowing them to take action based on metrics like CPU utilization and disk space. Reviewers have praised the product's ability to alert users about system issues and take proactive measures to maintain system uptime. Overall, Splunk Infrastructure Monitoring has proven instrumental in monitoring different environments, including production, UAT, development, Linux virtual machines, AWS infrastructure, Azure resources, on-prem resources, and application health. By providing real-time insights, visualizations, and alerts, Splunk Infrastructure Monitoring empowers organizations to make informed decisions and address business problems related to system monitoring effectively.

Attribute Ratings

Reviews

(1-24 of 24)
Companies can't remove reviews or game the system. Here's why
Score 9 out of 10
Vetted Review
Verified User
Incentivized
We monitor our campus firewall , for auditing, troubleshooting, and changes with 3rd party vendors infra.
We also collect logs from our servers and analyze it for trends, issues, improvements, as well as reporting.
Ruben Martinez | TrustRadius Reviewer
Score 10 out of 10
Vetted Review
Verified User
Incentivized
1. Determine what custom logs you wish to capture. 2. Note and document the paths that the logs are located. 3. Note and document the hosts that contain those logs (IP, short hostname, FQDN) 4. Gather sample log files 5. Check for application guidance for Splunk ingest (i.e. iis logs require a specific configuration so that logs are readable inside Splunk, some application can utilize http event collector, etc.)
Brennan Fuller | TrustRadius Reviewer
Score 10 out of 10
Vetted Review
Verified User
Incentivized
All logs are sent to Splunk. Different applications may use Splunk more than others, but some apps are monitoring core infrastructure, back end app servers, front end servers, databases and many other parts of the application. Most applications have alerting set up through Splunk. Anytime a search condition is triggered an alert is sent into service now through our Splunk integration.
Score 8 out of 10
Vetted Review
Verified User
Incentivized
As the engineering team, we use Splunk Infrastructure Monitoring mainly to monitor the application usage and system load (DevOps) together. We do share some metrics with other teams within the organization (marketing, BizDev, Product, and so on) mainly to understand our user usage and main flow.
Score 7 out of 10
Vetted Review
Verified User
Incentivized
Describe how you use Splunk Infrastructure Monitoring in your organization? This product helps our team maintain uptime on systems. What are the business problems the product addresses and what is the scope of your use case? by monitoring the systems that we have in all our environments we rarely lose sight of the information we are trying to keep. The scope of our use case would be considered large.
Score 10 out of 10
Vetted Review
Verified User
Incentivized
We use Splunk Infrastructure Monitoring to deliver real-time monitoring and troubleshooting across our many platforms. Real-time streaming analytics gives us instant visualization, alerts, as well as insights, and troubleshooting steps. Being able to see our infrastructure in real-time allows us to troubleshoot possible performance issues cutting down on the turnaround time or any effects on the customers.
David Williams | TrustRadius Reviewer
Score 8 out of 10
Vetted Review
Verified User
Incentivized
I aid other organisations in setting the direction and infrastructure for their cloud transformation work and in achieving their goals. As part of this, a big part is getting good monitoring going to protect against failures and, importantly, to prevent them or remediate them before customers experience them. Splunk Infrastructure Monitoring has always been my top recommendation because of the value it offers in aggregating data from many different areas and allowing them to be correlated to pinpoint exactly where a problem is happening.
Score 10 out of 10
Vetted Review
Verified User
Incentivized
We use SO to monitor Azure and on-prem resources. We also leverage APM to monitor application health. We host a variety of products from an API Gateway to Claims Engines. SO enables us to proactively monitor issues across our micro-services hosted in a hybrid infrastructure.
Kendal Droddy | TrustRadius Reviewer
Score 10 out of 10
Vetted Review
Verified User
Incentivized
We use Splunk Infrastructure Monitoring to keep track of hundreds and hundreds of device endpoints. With the Universal Forwarder deployed to these endpoints, my team gains visibility into each of these devices that we have never had in the past. We can also customize the exact data we receive from each device or group of devices. The monitoring helps to detect the exact instance a device has a problem, and in some cases automatically remediate the issue.
June 17, 2022

observability

Score 10 out of 10
Vetted Review
Verified User
Incentivized
To gain observability over a distributed higher education environment is so important - and this product helps build that infostructure map that the organization requires to keep the lights on and make steering decisions.
Score 8 out of 10
Vetted Review
Verified User
Incentivized
All our alerts are from our Network. All our applications point to Splunk Infrastructure Monitoring for alerts and logs. Very useful and productive application and a must-have for all organizations. Very granular and powerful tool that can be used by the air department to monitor and save logs for all cases needed.
Score 9 out of 10
Vetted Review
Verified User
Incentivized
We use for a leading financial services client to monitor the on Prem servers - their health, thresholds, and alerts and come up with risk mitigation and backup strategies. Without this product, there were multiple teams performing manual operations and they were often silos of data. Splunk centralized the whole monitoring and management part
March 25, 2022

Splunk review

Score 8 out of 10
Vetted Review
Verified User
Incentivized
I use Splunk Monitoring as a primary monitoring tool in our Cloud Infrastructure. The data is pushed from the agent to Splunk Server. We manage all of the Dashboard in the Splunk UI. Also for Incident management, we use detectors from Splunk and some custom-made detectors. Also, alerts are pushed as incidents to Pagerduty and ServiceNow.
Ahmed Mujeeb | TrustRadius Reviewer
Score 6 out of 10
Vetted Review
Verified User
Incentivized
Their visualizations of all different kinds of data are great. has been very useful for more complex charts. This helps me choosing what metrics I report and how often. They are growing and looking to provide more and more features. We plan on using many of these new features as they are released.
Score 9 out of 10
Vetted Review
Verified User
Incentivized
Our company decided to implement Splunk within all business units couple of years back. I have found Splunk Infrastructure Monitoring to be incredibly useful in giving us deep insights into what is happening within our systems and our network. The metric interface is intuitive and powerful and the agent was very easy to configure, package and deploy.
Score 9 out of 10
Vetted Review
Verified User
Incentivized
We use Splunk Infrastructure Monitoring across enterprises as a standard infrastructure monitoring solution for various mission-critical business application systems. We had set up pub/sub architecture to collect streaming analytical data. We mostly use it for on-premises devices. Operations teams rely on its alerting capabilities to ensure system uptime and act on some proactive metrics like CPU utilization and disk spaces full, etc.
Score 8 out of 10
Vetted Review
Verified User
Incentivized
Our team has used Splunk Infrastructure Monitoring for a BFSI client to do monitoring of all the production, UAT, and development environments. Also, we have used it for monitoring the Linux virtual machines. We are able to run automated scripts on all the servers to monitor the usage patterns and heavy load time throughout the day.
Score 8 out of 10
Vetted Review
Verified User
Incentivized
We are using Splunk Infrastructure Monitoring (formerly SignalFx) in our R&D department to monitor our infrastructure and services. We configured a baseline of parameters and set an alert if it changes.
Score 8 out of 10
Vetted Review
Verified User
Incentivized
We’re using Splunk [Infrastructure Monitoring (formerly SignalFx)] to report real-time metrics when the number/percentage of a specific event is important. For example, we use it to detect error cases or monitor real-time throughout of the system. We also use the detectors to get alerts when the condition is met. It’s widely used by almost all engineering teams
May 02, 2021

Great product

Score 9 out of 10
Vetted Review
Verified User
Incentivized
We [are] using [Splunk Infrastructure Monitoring (formerly SignalFx)] in order to help us monitor our service health and diagnose issues that big data can help with.
This is one of the most advanced tools I've used for the matter, I was always able to find a way to show the data I need in a manner that will expose the info I'm looking for, adding alerts based on this is a killer feature. The only drawback I find is that you might have a [steep] learning curve in order to control this tool.
Imnet Worku Edossa | TrustRadius Reviewer
Score 10 out of 10
Vetted Review
Verified User
Incentivized
[Splunk Infrastructure Monitoring (formerly SignalFx)] is being used across the entire organization for many purposes such as continuous monitoring of cloud resources and application statuses. It addresses business problems that require us to get timely notifications for events occurring within our infrastructure and address them accordingly. In my own department, our continuous monitoring tools rely on SFX reports.
Return to navigation