Overview
What is SolarWinds Database Performance Analyzer?
SolarWinds Database Performance Analyzer (DPA) enables deep visibility into database performance and expert advice for performance optimization and tuning.What can you monitor with DPA? OracleOracle ExadataOracle EBSMicrosoft SQL Server Azure SQL DatabaseAzure SQL Database Managed InstanceMySQLDB2 SAP ASE AuroraMariaDBDPA monitors…
Easy to use and provides more details on the queries
DPA Delivers Tremendous Value
Hands Down: SolarWinds Database Performance Analyzer Beats SQL Profile and Database Engine Tuning Advisor
SolarWinds Database Performance Analyzer is a great addition to your DBA and Development toolkit
SolarWinds DPA - covers all/most of your SQL monitoring needs
Top of Class Database Performance Monitoring and Tuning Advisor!
SolarWinds Database Performance Analyzer - Recommended
DPA is hell lot of a Business for Database world
SolarWinds DPA should be on every DBA's wishlist.
SolarWinds DPA is a constant companion making sense of database performance
Awesome Tool for SQL Performance Tuning
SolarWinds DPA is a great product to visually see the health of the databases and make a proactive monitoring and root cause analysis
DPA: FTW.
SolarWinds DPA saves the day every time
SolarWinds Database Performanc Analyzer - DPA Saves The Day!
Awards
Products that are considered exceptional by their customers based on a variety of criteria win TrustRadius awards. Learn more about the types of TrustRadius awards to make the best purchase decision. More about TrustRadius Awards
Reviewer Pros & Cons
Pricing
What is SolarWinds Database Performance Analyzer?
SolarWinds Database Performance Analyzer (DPA) enables deep visibility into database performance and expert advice for performance optimization and tuning. What can you monitor with DPA? Oracle Oracle Exadata Oracle EBS Microsoft…
Entry-level set up fee?
- Setup fee optional
Offerings
- Free Trial
- Free/Freemium Version
- Premium Consulting/Integration Services
Would you like us to let the vendor know that you want pricing?
27 people also want pricing
Alternatives Pricing
What is SolarWinds SQL Sentry?
SolarWinds SQL Sentry is designed to help data professionals optimize SQL Server database performance in physical, virtual, and cloud environments. SQL Sentry delivers metrics to help users find and fix database performance problems and provides scalability, boasting demonstrated success monitoring…
What is dbForge Studio (Edge)?
dbForge Studio is provided by Devart and is a universal front-end client for database management, administration and development. Devart's GUI tool provides utilities to compare, synchronize, and back up databases (e.g. MySQL, Oracle, SQL Server, PostgreSQL, etc.) with scheduling, and includes the…
Product Details
- About
- Integrations
- Competitors
- Tech Details
- Downloadables
- FAQs
What is SolarWinds Database Performance Analyzer?
- Oracle
- Oracle Exadata
- Oracle EBS
- Microsoft SQL Server
- Azure SQL Database
- Azure SQL Database Managed Instance
- MySQL
- DB2
- SAP ASE
- Aurora
- MariaDB
What makes DPA stand out:
- Quick, easy, and reliable performance
troubleshooting available in real time and historically
- Machine learning anomaly analysis to bring intelligence to go beyond traditional threshold based analysis
- Find inefficient workloads, aggregated by table, for indexing opportunities—an “X marks the spot” tuning analysis
- Cross-platform database support for a single-pane-of-glass view into your environment
- Blocking analysis: what is blocking and a hierarchy of what is being blocked, plus overall impact
- PerfStack™ integration with other SolarWinds products for more complete visibility (applications, servers, storage, hypervisor, network, and more)
- Agent-less architecture with the ability to scale from a few instances to thousands, low 1% average overhead
SolarWinds Database Performance Analyzer Features
- Supported: Database monitoring
- Supported: Tuning advisors for queries, workload, and indexes aggregated at the table level
- Supported: Correlated resource metrics for easy diagnosis of hardware constraint impacts on end-users
- Supported: Detailed blocking analysis for contention bottlenecks
- Supported: I/O activity tracking at the drive/mount and file level
- Supported: Alerts and reports
- Supported: DPA Central to manage large and/or distributed environments
- Supported: Always On Availability Group and RAC insights
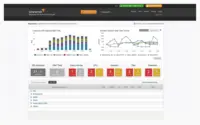
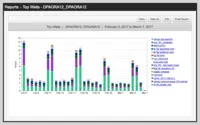
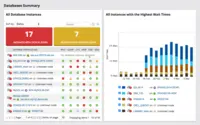
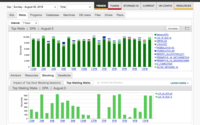
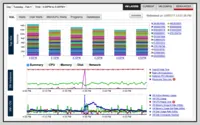
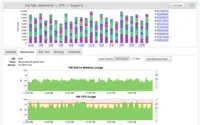
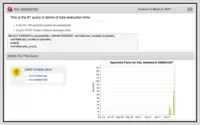
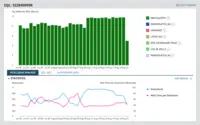
SolarWinds Database Performance Analyzer Screenshots
SolarWinds Database Performance Analyzer Videos
Watch Product Overview
SolarWinds Database Performance Analyzer Integrations
- SolarWinds Server & Application Monitor
- SolarWinds Virtualization Manager (VMAN)
- SolarWinds Storage Resource Monitor (SRM)
- SolarWinds Network Performance Monitor (NPM)
- SolarWinds NetFlow Traffic Analyzer (NTA)
- SolarWinds Network Configuration Manager (NCM)
- SolarWinds IP Address Manager (IPAM)
- SolarWinds VoIP & Network Quality Manager (VNQM)
- SolarWinds Web Performance Monitor (WPM)
- SolarWinds User Device Tracker
SolarWinds Database Performance Analyzer Competitors
SolarWinds Database Performance Analyzer Technical Details
| Deployment Types | On-premise, Software as a Service (SaaS), Cloud, or Web-Based |
|---|---|
| Operating Systems | Windows, AWS Marketplace app |
| Mobile Application | No |
SolarWinds Database Performance Analyzer Downloadables
Frequently Asked Questions
Comparisons
Compare with
Reviews and Ratings
(227)Community Insights
- Pros
- Cons
- Recommendations
User-Friendly Interface: Users appreciate the SolarWinds Database Performance Analyzer for its straightforward and easy-to-understand interface. They find it intuitive and user-friendly, even for new users with minimal training.
Real-Time Analysis and Support: The tool's real-time analysis capabilities and support services are highly valued by users. They mention that it helps them promptly identify and resolve performance issues in SQL databases, such as errors, long-running queries, or system-blocking problems.
Wide Range of Supported Databases: Users find the extensive range of supported databases to be a valuable feature of the tool. It allows them to monitor and analyze the performance of multiple databases from one centralized interface.
Dated and Confusing User Interface: Several users have expressed frustration with the user interface, describing it as dated, confusing, and difficult to navigate. They suggest that the user interface could be more user-friendly and have a reduced learning curve. Some users also mentioned that the navigation can be unintuitive and sometimes tough, and that some items can be confusing to find again. Overall, improvements in the cosmetic aspects of the user interface are needed.
Lack of Reporting Flexibility: According to some users, there is a lack of flexibility in both dashboard customization and reporting capabilities. They feel that the reporting feature needs improvement to provide more options for customization and analysis. This limitation hinders users' ability to obtain meaningful insights from their data.
High Cost: The cost of the software has been a major complaint among some users, particularly when it comes to adding additional instances. These users mention that the licensing timeline needs improvement as adding new instances becomes cost-prohibitive during certain periods of the year. The high cost associated with using this software can limit its accessibility for businesses operating on tight budgets.
Users highly recommend trying the free trial and evaluating SolarWinds DPA before purchasing. They suggest taking advantage of the free demo and training resources provided by SolarWinds. Users advise implementing SolarWinds DPA for monitoring and analyzing databases, especially for those who are just learning. The software is also recommended for DBAs in small to medium businesses and for integrating with other SolarWinds products for better data analysis. Additionally, users suggest comparing it with Idera offerings for SQL performance monitoring and highlighting it to DBAs as they will likely find value in it.
Attribute Ratings
- 8.6Likelihood to Renew4 ratings
- 9.1Availability1 rating
- 9.1Performance1 rating
- 9Usability6 ratings
- 9.3Support Rating6 ratings
- 7.3Implementation Rating2 ratings
- 7.3Configurability1 rating
- 8.2Product Scalability1 rating
- 8.2Ease of integration1 rating
- 9.1Vendor pre-sale1 rating
- 9.1Vendor post-sale1 rating
- 10Solarwinds Premier Support Rating10 ratings
- 7.3SolarWinds Smart Start Support Rating1 rating
Reviews
(51-75 of 113)SolarWinds DPA review
- Deep queries analyses, provides good advice for performance improvements.
- Allows us to create our own custom alerts and reports.
- Has a very intuitive and well-explained interface. It is split up for different objectives to analyse or monitor as trends, tunning, current activities and resources.
- None identified
DPA: Great web application for wait stats and trends. Not the tool for those needing actionable alerts.
- Capturing wait statistics is a great way to monitor performance on a SQL Server instance. This is the main source of info for DPA.
- Web app: no client install required. Easy to login from a web browser, share info and manage everything from a browser tab.
- Drill-downs from one time interval to seconds to see database activity is intuitive and easy to use.
- Alerts seem to be lacking in DPA compared to competitor's tools. They can be setup but are not quite as easy or as helpful as some other tools I have used.
- Grooming/pruning the repository database isn't very easy. We don't manage a lot of instances but our repo DB has grown pretty significantly.
- At times when I am drilled-down to a chart, it can be difficult to navigate around from that point to another time range/query/metric.
Life saver!
- Index recommendation.
- Tuning advisor.
- Wait events.
- Always-on monitoring.
Happy customers, much time saved
- Detecting blocking
- Showing missing index information
- Highlighting the most expensive queries being run in your system
- Giving a daily summary of issues
- Showing performance history over a long period of time
- The GUI is a little clunky, could do with updating and make it responsive
- A mobile app would be great, to keep an eye on things on the go
- Perhaps a cut-down version, as sometimes there's just TOO much information!
NCTradeToolReview
- Ability to drill down to wait for the issue and have a clear path as to what may be causing the issue.
- Ability to quickly add a new target and the ease of installation and upgrades.
- Reporting features to group my most troublesome customers into a daily report in one email.
- Excellent customer support on any issues I can't immediately solve.
- At this time it solves all my needs, and it appears that your folks have the pulse of this tool as the releases always give me something better to use.
DPA -- The Wait stats king
- The best tool for wait analysis.
- A simple, intuitive web interface.
- A quality product that is improving over time.
- The wait analysis at the statement level has it's pros/cons. I would like to see higher level stored procedure.
- It's a good performance monitoring tool, but not good for monitoring health -- backups, log shipping etc.
- The query plan viewer in the web is only good for simple query plans. It's easy to download the plan to view in SSMS, Plan Explorer, etc. though.
DPA is a performance monitoring tool, and it's good at this task. It doesn't monitor things like backups, log shipping, etc.
SolarWinds Database Performance Analyzer
- Easy to use.
- Flexible.
- A good tool to analyze DB performance.
- Needs a more alert setup
- Needs 24/7 support.
Great alternative for Oracle Enterprise Manager
- monitoring our Oracle RAC performance
- searching for performance bottlenecks
- analyzing historical data and trends
- solving developers problems
- It's super helpful when hunting down problems with performance.
- It's easy to install and configure.
- It doesn't require crazy computation power or tons of memory.
- DBA-friendly.
- GUI/UI could be more modern.
- Pricing: it's reasonable but not cheap.
- Deep integration with AWS managed databases would be really nice.
My DPA-review
DPA makes it possible for me to be proactive. I find the DPA-GUI to be very user-friendly and easy to understand even without reading the manual.
- SQL-tuning advice. It's easy to locate the most inefficient SQL-staements as they are all graded. You just click and drill-down to see both the SQL-statements and statistics. That info will most likely give you enough knowledge to solve the issue, for example by adding an extra index.
- The monitoring of the database by setting up your own alerts in all kind of categories. For example, alerts when tablespaces are running full or when disk/CPU load are too high or if the server becomes unavailable.
- The possibilty to browse the repository and see trends. You can see exactly when problems are starting and see if the changes you make has an effect in the time to come.
- The license-management seems difficult to use, and I always find that I need to contact SolarWinds when upgrading server, etc.
Useful database monitoring tool
- We use this software to identify real-time performance problems such as errors, long-running queries or problems that are blocking the system.
- We use this software to review previous SQL Server queries/performance.
- When there is an issue with any Server and I need to quickly narrow down to the right place of the root cause, this is a tool that allows me to focus on the right places and remove all sorts of noise from our data.
- Cannot easily find a query using a "text search" without detailed knowledge of the underlying SQL database "repository" that is used to display the data in each product.
- On the ad-hoc plan tab, for any given plan we have to drill down each SQL manually one by one. It would be goOd to have some kind of summary popup/tool-tip when we hover over the plan in DPA.
Great tool for a DBA
- Shows the database status in a single page.
- Enables simple drilling into different database problem areas (CPU, ram, disks, sessions, etc.).
- Regularly finds top queries that can be improved.
- It would be nice if it could work with Oracle's SQL Tuning Advisor.
Awesome Database Best Practice
- Maintainability and accommodating Support service and easy to follow Release Notes/Documentation.
- The relevance of the pre-defined Reports and Checks.
- Simplicity of the tool. Easy to use and understand.
- Resiliency of the Monitoring checks after the server underwent maintenance reboot. My experience is the monitor (Action) needs to be started manually. If possible it can automatically detect service/server then start to monitor again when system is back up.
- Much lighter UI.
- Granularity up to minutes.
Best product for tuning performance issues
- Ease of use.
- Graphical presentation of load and system information.
- You can edit, rename, and customize the SQL queries that are run often to facilitate identifying them later.
- It would be great if it has a pulse page that summarizes the state of the environment as a whole.
- If it can be integrated with other applications like OEM.
- If it can monitor replication as well.
A must have for critical SQL workloads
- Very easy to deploy with a negligible performance overhead.
- Excellent perspective on overall performance metrics.
- Good alerting system for performance or events.
- API based alerting.
Network Sherlock Holmes
- Detailed minute by minute performance data.
- It gives a detailed performance insight at the server and application-level.
- Analytics and problem alerting.
- None that I can think of at the moment. It has what I expected out of a monitoring tool.
- Problem categorization.
- Problem identification.
- Serious trending analysis.
- When presenting possible sources of issues, it may be better to first give a list overview, and then proceed to drill down into the details.
DPA is a helpful monitoring and analytical tool
- Predict performance across all databases
- Predict unexpected behavior
- Make a correct forecast about how much memory and CPU could be needed for a particular job
- The agent usually consumes a lot of memory
- High cost, since it is charged per instance.
- An efficient and intelligent search feature would be helpful.
- Multiple database real-time performance/status in single windows with an easy illustration using graphs.
- Query analyzer and identify plan text.
- Overall database status monitoring and reporting.
- Plan hash and plan adviser.
- DB color and grouping for interdependent query's relation.
- Point the users and identify single users for multiple DB Access Scenarios.
Well suited for database real-time status and performance monitoring and reporting, an easy illustration of a query in graphs for user understanding, interdependency and query identification and a single glass view for multiple different databases.
Not as good for failed jobs status for a database, identifying a single user while it's using multiple database correlations or logging into multiple databases. The Adviser plan and suggestions are not always helpful to the administrator in relation to the alerts or abnormal behavior.
DPA was the perfect choice
- Very easy to use user interface. Also very handy for new users with a short time of introduction.
- Very good overview on all servers added. You can see in one sight which servers are busy.
- Well created metrics, a good starting point for adapting them.
- Alert system is very useful.
- No possibility to create overview groups to bundle SQL servers in more than one group.
- If an agent has an error there should be the possibility to send an alert.
- No support for by-products.
- Simple and intuitive to navigate.
- Provides Top queries and makes good recommendations that are accurate.
- Good reporting use for C-Level colleagues who don't understand the techincal side of Databases.
- Having a search bar to search for particular SQL code would be useful, Especically when attempting to find a new SQL Hash name on a fixed stored proc
SolarWinds - we understand the network better
- Monitor performance
- Check for errors
- Give a clear view of the DB
- Simple GUI
- No Support for SAP HANA
- Allow alerts to SMS
- Search feature
- It helps to monitor the amount of wait time on the SQL instance.
- It helps to find poor performing queries.
- It provided a very good dashboard to monitor ourSQL box.
- There are not many issue I can find yet.
- Clear, Concise Performance Information
- Server Alerts are quick and easy to setup
- DPA could allow longer custom names, and reuse of names
- DPA could allow easier location of all executions of a query matching a certain pattern
- Quickly points out what is slowing down our SQL server
- Provides daily statistics on most ran queries and their wait time
- Operates flawlessly with no maintenance
- Sometimes it cannot tell the SQL query text - I believe its when Entity Framework SQL is being ran
- Email notification when a SQL statement starts "killing" the whole server
- Full text search of specific SQL termS in all of the SQL code that it has captured
- Excellent at being able to key in quickly on pain-point queries.
- Very clear and easy to understand user interface.
- Nice availability groups dashboard that shows how far behind each database is from synchronization.
- Email alerts are pretty much a DIY proposition. The canned email alerts are a mixed bag. Some work, while others don't.
- The usual Windows performance counters (CPU, Memory, etc.) are on the main dashboard. It would be nice to see IO counters there as well.
- Most drill-down query screens are displayed vertically, but a few are displayed horizontally. It would be nice if they were all displayed vertically.

