Overview
What is SolarWinds Database Performance Analyzer?
SolarWinds Database Performance Analyzer (DPA) enables deep visibility into database performance and expert advice for performance optimization and tuning.What can you monitor with DPA? OracleOracle ExadataOracle EBSMicrosoft SQL Server Azure SQL DatabaseAzure SQL Database Managed InstanceMySQLDB2 SAP ASE AuroraMariaDBDPA monitors…
Easy to use and provides more details on the queries
DPA Delivers Tremendous Value
Hands Down: SolarWinds Database Performance Analyzer Beats SQL Profile and Database Engine Tuning Advisor
SolarWinds Database Performance Analyzer is a great addition to your DBA and Development toolkit
SolarWinds DPA - covers all/most of your SQL monitoring needs
Top of Class Database Performance Monitoring and Tuning Advisor!
SolarWinds Database Performance Analyzer - Recommended
DPA is hell lot of a Business for Database world
SolarWinds DPA should be on every DBA's wishlist.
SolarWinds DPA is a constant companion making sense of database performance
Awesome Tool for SQL Performance Tuning
SolarWinds DPA is a great product to visually see the health of the databases and make a proactive monitoring and root cause analysis
DPA: FTW.
SolarWinds DPA saves the day every time
SolarWinds Database Performanc Analyzer - DPA Saves The Day!
Awards
Products that are considered exceptional by their customers based on a variety of criteria win TrustRadius awards. Learn more about the types of TrustRadius awards to make the best purchase decision. More about TrustRadius Awards
Reviewer Pros & Cons
Pricing
What is SolarWinds Database Performance Analyzer?
SolarWinds Database Performance Analyzer (DPA) enables deep visibility into database performance and expert advice for performance optimization and tuning. What can you monitor with DPA? Oracle Oracle Exadata Oracle EBS Microsoft…
Entry-level set up fee?
- Setup fee optional
Offerings
- Free Trial
- Free/Freemium Version
- Premium Consulting/Integration Services
Would you like us to let the vendor know that you want pricing?
27 people also want pricing
Alternatives Pricing
What is SolarWinds SQL Sentry?
SolarWinds SQL Sentry is designed to help data professionals optimize SQL Server database performance in physical, virtual, and cloud environments. SQL Sentry delivers metrics to help users find and fix database performance problems and provides scalability, boasting demonstrated success monitoring…
What is dbForge Studio (Edge)?
dbForge Studio is provided by Devart and is a universal front-end client for database management, administration and development. Devart's GUI tool provides utilities to compare, synchronize, and back up databases (e.g. MySQL, Oracle, SQL Server, PostgreSQL, etc.) with scheduling, and includes the…
Product Details
- About
- Integrations
- Competitors
- Tech Details
- Downloadables
- FAQs
What is SolarWinds Database Performance Analyzer?
- Oracle
- Oracle Exadata
- Oracle EBS
- Microsoft SQL Server
- Azure SQL Database
- Azure SQL Database Managed Instance
- MySQL
- DB2
- SAP ASE
- Aurora
- MariaDB
What makes DPA stand out:
- Quick, easy, and reliable performance
troubleshooting available in real time and historically
- Machine learning anomaly analysis to bring intelligence to go beyond traditional threshold based analysis
- Find inefficient workloads, aggregated by table, for indexing opportunities—an “X marks the spot” tuning analysis
- Cross-platform database support for a single-pane-of-glass view into your environment
- Blocking analysis: what is blocking and a hierarchy of what is being blocked, plus overall impact
- PerfStack™ integration with other SolarWinds products for more complete visibility (applications, servers, storage, hypervisor, network, and more)
- Agent-less architecture with the ability to scale from a few instances to thousands, low 1% average overhead
SolarWinds Database Performance Analyzer Features
- Supported: Database monitoring
- Supported: Tuning advisors for queries, workload, and indexes aggregated at the table level
- Supported: Correlated resource metrics for easy diagnosis of hardware constraint impacts on end-users
- Supported: Detailed blocking analysis for contention bottlenecks
- Supported: I/O activity tracking at the drive/mount and file level
- Supported: Alerts and reports
- Supported: DPA Central to manage large and/or distributed environments
- Supported: Always On Availability Group and RAC insights
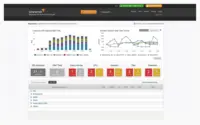
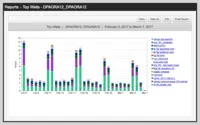
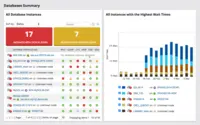
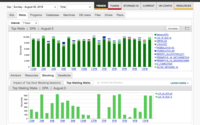
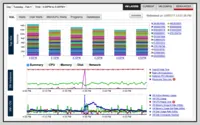
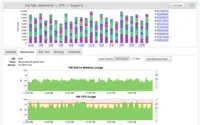
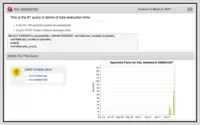
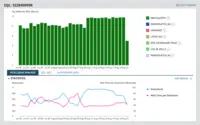
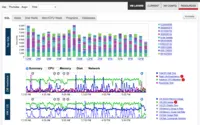
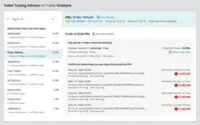
SolarWinds Database Performance Analyzer Screenshots
SolarWinds Database Performance Analyzer Videos
Watch Product Overview
SolarWinds Database Performance Analyzer Integrations
- SolarWinds Server & Application Monitor
- SolarWinds Virtualization Manager (VMAN)
- SolarWinds Storage Resource Monitor (SRM)
- SolarWinds Network Performance Monitor (NPM)
- SolarWinds NetFlow Traffic Analyzer (NTA)
- SolarWinds Network Configuration Manager (NCM)
- SolarWinds IP Address Manager (IPAM)
- SolarWinds VoIP & Network Quality Manager (VNQM)
- SolarWinds Web Performance Monitor (WPM)
- SolarWinds User Device Tracker
SolarWinds Database Performance Analyzer Competitors
SolarWinds Database Performance Analyzer Technical Details
| Deployment Types | On-premise, Software as a Service (SaaS), Cloud, or Web-Based |
|---|---|
| Operating Systems | Windows, AWS Marketplace app |
| Mobile Application | No |
SolarWinds Database Performance Analyzer Downloadables
Frequently Asked Questions
Comparisons
Compare with
Reviews and Ratings
(227)Community Insights
- Pros
- Cons
- Recommendations
User-Friendly Interface: Users appreciate the SolarWinds Database Performance Analyzer for its straightforward and easy-to-understand interface. They find it intuitive and user-friendly, even for new users with minimal training.
Real-Time Analysis and Support: The tool's real-time analysis capabilities and support services are highly valued by users. They mention that it helps them promptly identify and resolve performance issues in SQL databases, such as errors, long-running queries, or system-blocking problems.
Wide Range of Supported Databases: Users find the extensive range of supported databases to be a valuable feature of the tool. It allows them to monitor and analyze the performance of multiple databases from one centralized interface.
Dated and Confusing User Interface: Several users have expressed frustration with the user interface, describing it as dated, confusing, and difficult to navigate. They suggest that the user interface could be more user-friendly and have a reduced learning curve. Some users also mentioned that the navigation can be unintuitive and sometimes tough, and that some items can be confusing to find again. Overall, improvements in the cosmetic aspects of the user interface are needed.
Lack of Reporting Flexibility: According to some users, there is a lack of flexibility in both dashboard customization and reporting capabilities. They feel that the reporting feature needs improvement to provide more options for customization and analysis. This limitation hinders users' ability to obtain meaningful insights from their data.
High Cost: The cost of the software has been a major complaint among some users, particularly when it comes to adding additional instances. These users mention that the licensing timeline needs improvement as adding new instances becomes cost-prohibitive during certain periods of the year. The high cost associated with using this software can limit its accessibility for businesses operating on tight budgets.
Users highly recommend trying the free trial and evaluating SolarWinds DPA before purchasing. They suggest taking advantage of the free demo and training resources provided by SolarWinds. Users advise implementing SolarWinds DPA for monitoring and analyzing databases, especially for those who are just learning. The software is also recommended for DBAs in small to medium businesses and for integrating with other SolarWinds products for better data analysis. Additionally, users suggest comparing it with Idera offerings for SQL performance monitoring and highlighting it to DBAs as they will likely find value in it.
Attribute Ratings
- 8.6Likelihood to Renew4 ratings
- 9.1Availability1 rating
- 9.1Performance1 rating
- 9Usability6 ratings
- 9.3Support Rating6 ratings
- 7.3Implementation Rating2 ratings
- 7.3Configurability1 rating
- 8.2Product Scalability1 rating
- 8.2Ease of integration1 rating
- 9.1Vendor pre-sale1 rating
- 9.1Vendor post-sale1 rating
- 10Solarwinds Premier Support Rating10 ratings
- 7.3SolarWinds Smart Start Support Rating1 rating
Reviews
(76-100 of 113)I am ineffective without DPA
- I have used it to demonstrate disk issues to server admins by showing them the drastic increase in DB Commit times which turned out to be a failed NIC.
- I routinely use it to identify blocking sessions to verify ETL job issues.
- I use the waits and the top SQL to monitor system performance issues.
- I would like to have some visibility into the alert log in DPA.
- I would like to have tablespace/datafiles information regarding space and items contained in them.
SolarWinds DPA Review
Over the years DPA has helped us to resolve a lot of issues with blocking, locking, and excessive CPU utilization. We have done this both in real-time, during outages, and as part of our development pipeline.
- Real-time viewing into wait statistics, blocking and locking.
- Valuable query and table tuning advice.
- Historical tracking of wait times.
- The drill down usability is cumbersome.
- It's sometimes difficult to navigate exactly to where you want to be.
- Could use more information around parameters.
Great tool that works for you, not against you
- Catches long-running queries that would normally have to sit and watch to catch.
- Ensures the resources on the server are adequate if not gives you a birds-eye view on when it gets bad and returns to normal. For example, maybe in the middle of the night when you are asleep, knowing the CPU is maxing wouldn't be an issue, as you would see this in the Hx information.
- If you have long-running queries and are aware of them, you can mark those with a name, either keep them on the Hx chart or set them aside to focus on new issues.
- There is not a lot, but one thing I would suggest is when SolarWinds gives you reported information— for example, this query has run 1500 times, for a total of 56 million reads—It doesn't have a way to break it down and show me all queries that have read 500K or larger. Much like a SQL profiler would.
DPA: Would not be able to do my job well without it!
- The tuning advisor quickly guides me to where the biggest performance issues are.
- There's a lot of built-in "help," definitions and possible actions to take.
- Alerts and trending information are very helpful.
- I have to frequently and repeatedly click the "Dismiss" button on banner messages that appear at the top of the screen. They're just annoying.
SolarWinds DPA review
- Alerting system.
- Offending queries.
- Historical performance.
- Could improve the amount of servers and hardware resources dedicated to installation.
DPA is A-OK
- Detailed information on SQL queries.
- Good analysis of where problems are occurring.
- The lookups are very quick.
- The cost of this tool is pretty high, especially when using other SolarWinds products.
- A more user-friendly UI would be helpful.
DPA Review
- Notification of jobs failing.
- notification of someone making server level changes to an SQL server.
- Monitoring how busy the servers are.
- Make all the resource graphs a little longer, especially the 24 hours and 1 week. 25-26 hours and 8-9 days so it is easier to compare what is going on.
- Ability to customize the charts on the home screen.
- Make some of the most popular customer alerts apart of the default list.
SolarWinds makes any administrator's day easy
- Collecting the information on performance.
- Presenting the current status of any of the registered server or te whole enterprise environment if you are running the whole package.
- Providing details on the processes and suggestions on the areas that require improvements.
- With everyday evolving technology, new options and possibly additional plug-ins can be added, to keep the software ahead of their comp competition.
Great DB monitoring tool for performance improvements
- Low overhead on monitored instances.
- Ability to monitor both on-prem as well as cloud instances.
- Setup tutorials could have been more simplified like how to set-up alerts and so.
- DPA should have a feature where I can text search. That's just not good :(
A must have tool for any production dba
- Daily review by one of our team members to see anomalies.
- Drilling down while troubleshooting ongoing issues.
- Setting up reports to keep the hard record of a baseline.
Since DPA is a wait time oriented monitoring tool, it perfectly completes other homemade SQL scripts used to monitor and troubleshoot performance.
- An easy way to get the status of the databases.
- An easy way to drill down.
- Ability to see at glance the current database health.
- It's not very intuitive when "zoom in" "zoom out" needed while looking at performance. Eventually, you figure this out. But it would be better to see all events sharing the same timeline.
- Some minor issues with web implementation that include auto login. Probably related to cookie handling.
My SolarWinds Database Performance Analyzer Review
Since we don't have a full-time DBA, we are not using DPA to its fullest, we mainly use it as a troubleshooting tool when needed.
There were a number of incidences when we had serious performance issues on the SQL Server, and DPA was able to help us to narrow down the type of issue, and the process that was causing the issue, which helped us to get the issue resolved quickly (by killing the process causing the deadlocks, etc.)
At the beginning of our DPA deployment, it also helped us to identify a number of expensive queries that will need to be optimized so that we can focus on improving these queries, and as the result of this, we improved the overall system performance.
- It provided a clear picture of how the system is performing, and which queries took the longest time to run.
- For the queries that took a long time to run, it provided us with the detailed analysis and recommendation on where was the problem and how to improve.
- When system has deadlocks -- it helped us to narrow down exactly which process was causing the problem, so that we were able to just kill that specific process to get the problem fixed, without the need to shut down all applications and reboot the whole SQL server.
- We also have one SQL server that has very light workloads, but from time to time DPA will still show CPU or query alerts on that server, which I believe were the false positives.
The more SQL Servers you have, the heavier the workloads on these servers, the better chance you can get a bigger ROI from BPA.
Compared to the impact to the business on potential downtime due to performance issues on SQL Servers, the cost of getting BPA in place is very minimum.
Why DPA can save your firm money, help developers, and ease DBA job.
- Top N SQL queries.
- Outstanding UI for rapid examination and drill down to detail data.
- Intuitive UI design - better than any other product in its category.
- Enabled us to immediately shift DB related performance matters first to developers so that our DBA's can focus on more important matters.
- Allow alerts to SMS (text message).
SolarWinds FTW!
- Reporting, the detailed information regarding the issues it is showing.
- Easy to Use Interface.
- A better explanation of how to use the SQL plan should be implemented.
- Implement recommendations from the console.
Technical Review
- Ability to hook into NPM for the discovery of monitoring targets.
- Ability to build dashboards from Database performance data.
- Better looking dashboards.
- Hooking into NTA or NPM to provide data on latency in reference to DB vs network.
SolarWinds, Hit after Hit. Keep the great products coming.
- Interface is user friendly
- Extremely detailed reports
- Explaining in depth on how to use the SQL and how the plan should be implemented
- Implement recommendations from the console
- Excellent overall view of database performance from the standpoint of SQL wait times. The main page for each database clearly displays the "pain points," if any.
- Ability to "drill down" to analyze particular problems in detail.
- Annotations provide a clear marker of changes so that any effect may be clearly seen.
- No PostgreSQL support.
- No ability to see a historical listing of annotations. Once annotations roll off the 30-day window, they are no longer accessible.
- There is no "timezone awareness" for global monitoring. All times are local to the area where DPA is run; this can throw off remote staff. We have sometimes created annotations at the incorrect time.
- In certain cases, the GUI gets cumbersome. This is especially true in the new (version 12) screen which shows SQL details.
- The screen presentation often doesn't lend itself to copy-paste for data to go into an email, documentation, etc.
- No facility for tracking unused or seldom used indexes.
- No integration with Oracle's Diagnostic and Tuning Pack features.
1. As a supplement to Oracle's Diagnostic and Tuning Pack features in OEM. It displays database status in a more comprehensive way and from a different angle than OEM. The two tools together provide a particularly powerful ability for DBAs to keep an eye on database performance.
2. Because it is much easier to use than OEM, it is particularly suitable for use by junior helpdesk and DBAs.
DPA, the database admin's friend.
- We can see any SQLs that are using more resources then they normally do and see if software updates have any issues.
- It gives us historic information about the server. It shows CPU, memory and individual SQL utilization.
- It shows us the SQL that is running so we can use that to show developers or support personal what may be causing an issue.
- It would be nice to be able to pick the window for data related to the CPU utilization, etc. IE, pick the week of Jan 6th through the 12th instead of this week, one month, etc.
- Most everything else works very well.
- Great visualization/timeline representation of events.
- Consolidated and detail troubleshooting efforts and suggestions for root cause analysis.
- A solution provided suggestion to increase performance.
- Reporting of raw data formats for importing to additional BI/Reporting tools.
- Integration with core SolarWinds products (single-pane).
- Improve alerting engine and integration into other platforms.
Solarwinds from an application standpoint.
- Real-time monitoring and notification of blocks and deadlocks on the database.
- Real-time notification of outages, including overnight issues that may arise.
- Ongoing monitoring, query by query, showing the impact of resources and utilization.
- Navigation is not always intuitive. Sometimes I need to drill down into 10-minute layers just to access a piece of information that I would have preferred to find at the hour or day level.
Efficient and to the root cause of issues quickly.
- Reporting.
- The detailed information regarding the issues it is showing.
- Easy to use interface.
- A better explanation of how to use the SQL plan should be implemented.
- Implement recommendations from the console.
Solarwinds DPA: Quickly Identify Production Performance Problems
- Solarwinds DPA provides easy to ready graphs to identify database performance problems.
- Solarwinds DPA displays vital Availability Group health information. This is used to quickly identify the status of SQL Server Availability Groups.
- Solarwinds DPA provides a drill down capability to see current and recent activity that may be impacting performance. This easy to use interfaces is vital to quickly identifying performance problems for improved up time.
- Solarwinds DPA does a great job of analyzing commonly executed queries on SQL instances. The one thing it does not do well is gathering metrics and bubbling up ad hoc queries that may only run once and a while, or perhaps queries that supply a variety of parameters. This typically causes DPA to interpret commonly run queries with varying parameters as different queries.
What a tool !
- DPA tells you if there are missing indexes.
- DPA gives you predicate warnings for SQL queries.
- DPA monitors main resource performance counters for the VM and host and also read and write latencies for data partitions.
- We DBAs often don't have enough insight into the type of hardware being used. For example I'd like to know if our SAN presents new pages as pre-initialized or the operating system re-initialize the pages.
- I'd like to be able to see in DPA if our infrastructure performs physical file fragmentation on our SAN.
- I would like to see IO blocks size that was used for SQL Server and other internals from infrastructure side that we DBAs don't have visibility.
Great product for the price.
- Enables you to drill down into problem queries and find out what exactly is going on with it.
- Gives us a nice historical trends analysis display that is useful in finding patterns in usage.
- Now has tuning advisors to help tune your queries.
- I would like to see an iPhone app to monitor my database remotely.
Database Administrator
- Query tuning advisor.
- Historical performance data collection.
- Providing query information along with its source system.
- "Alerts" setup is not intuitive.
- Lack of support for multi-domain AD/LDAP configuration.
- No straight forward method to get plan handle number from plan hash value displayed in DPA.
Just my view on Solarwinds DPA. Not worth it to me.
- It can tell you the amount of wait time on the SQL instance.
- It can help you find poor performing queries (by wait time) and give suggestions on the fix.
- It has a decent overview/dashboard page that can alert you to issues across all covered instances.
- It focuses on tracking/reporting the wait time statistic as the core measurement for performance. I think to most DBAs and SQL Developers, wait time is a symptom of an issue, not the root cause. I would prefer this premise be changed to track different issues that get closer to the heart of the issue.
- "Solutions" to wait time issues that the system suggests is simply canned responses by each wait type. This is incredibly unhelpful when tracking specific issues; for instance, a single query that is not performing well.
- Navigating the UI is incredibly frustrating. Trying to click a wait bar and navigating to a SQL query by its hash is rather obnoxious as well. Hovering over every hash to find the query you might be looking for is just a pain.
- Combining multiple search patterns is nearly impossible by any known means. For instance, I want to know information about queries on a database, by user, not by wait type. I have a page for queries against a database and I have a page for queries ran by a specific user. But I need ways to combine these quickly to find things.
- Completely absent features like tracking SQL Agent jobs and maintenance plans would be a huge help.
- An easier way to get to and use the "Current->Active Sessions." Currently running (or blocked) transactions are some of the most helpful tools I can have when determining issues. Focusing more on this feature would be a big plus.
- Reports are halfway useless. It seems like they only give me the options to show what I can view in the UI already, instead of extending functionality. If I need to write every report I want with a SQL Query, then what did I need to buy this tool for in the first place?
- More high-level information on the dashboard could take up some unused space. Things like: data file size, log size, agent jobs running/failed, etc could all be beneficial to show at a high level instead of a bunch of arbitrary green check marks.
- One of the other big issues I have is when a blocking transaction goes unnoticed for a while. It takes up so much of the 'wait time' graphs that other bars are basically flat. I know there is a way to make it so that query is ignored in the wait bar graphs, but finding that option is a problem. And, I don't really want to ignore it all the time. I want to ignore the single huge chunk that was being blocked a week ago so I can continue monitoring for issues with it. The other thing is that when a blocking transaction occurs, a bunch of other queries rack up massive wait time too, which just compounds the problem.

