
ThoughtSpot - The most brilliant AI solution in the market
we use ThoughtSpot as our main dashboard and analytical tool. The main business problem was that most of our analyst team is non-technical …
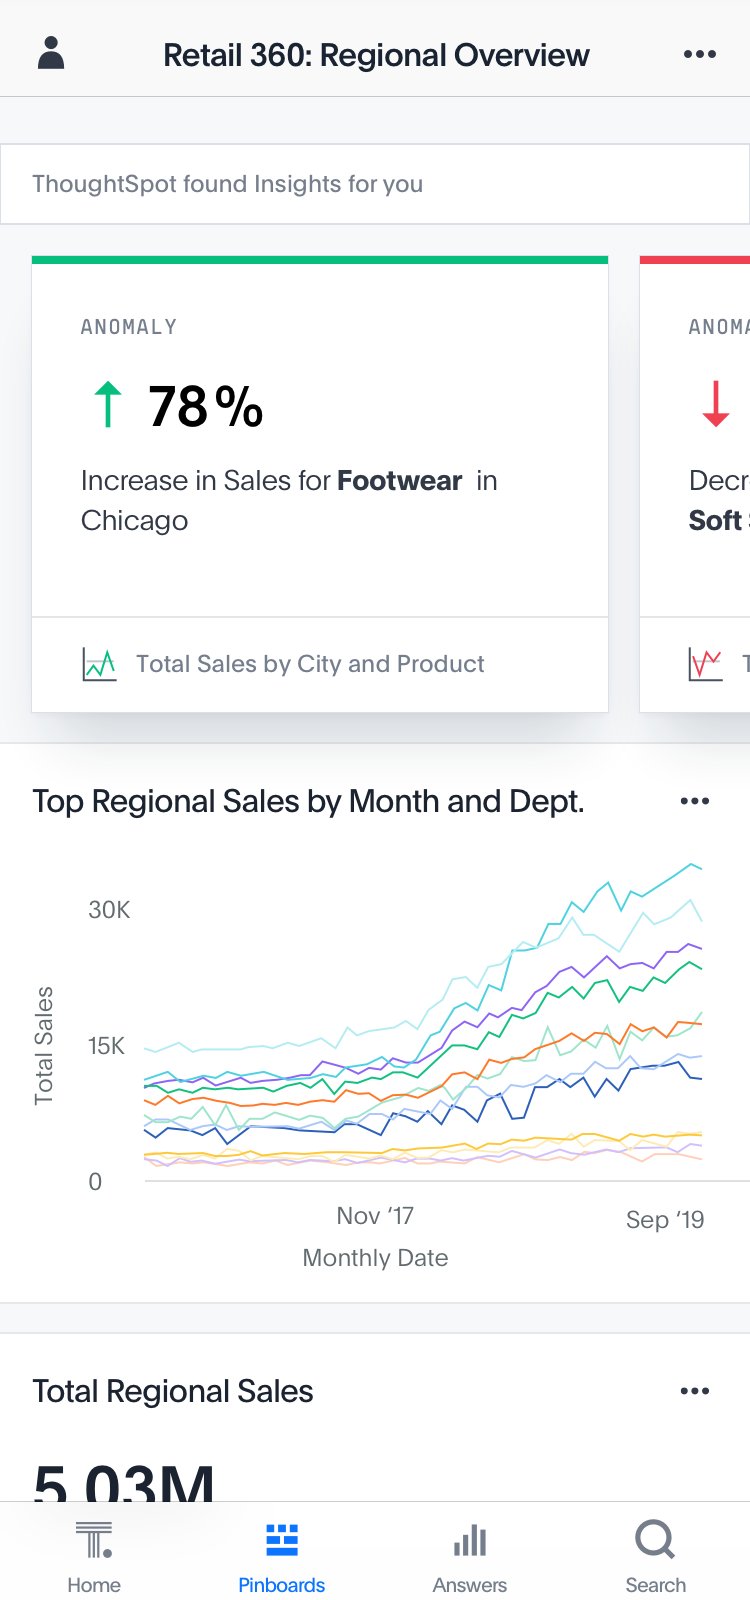
ThoughtSpot is an AI-Powered Analytics company, that aims to create a more fact-driven world with an easy to use analytics platform. ThoughtSpot enables users to leverage natural language search powered by large language models to ask and answer data questions.…
Products that are considered exceptional by their customers based on a variety of criteria win TrustRadius awards. Learn more about the types of TrustRadius awards to make the best purchase decision. More about TrustRadius Awards


| Deployment Types | Software as a Service (SaaS), Cloud, or Web-Based |
|---|---|
| Operating Systems | Unspecified |
| Mobile Application | Apple iOS, Android, Mobile Web |
| Supported Countries | Global |
| Supported Languages | English, Dansk, Deutsche, Español, Français, Italiano, Nederland, Norsk, Português, Suomi, Svenska, 中文(简体), 日本語 |