TrustRadius
Zoho Analytics

Zoho Analytics
Formerly Zoho Reports

Overview

What is Zoho Analytics?

Zoho Analytics (formerly Zoho Reports) is a self-service BI and analytics platform that allows users to analyze their business data and create reports and dashboards. It is designed to help users create and share reports quickly, without IT assistance.

Read more
Recent Reviews

Zoho or Uh-oh?

5 out of 10
February 27, 2024
We use Zoho Reports to produce and visualize reports/data better than with what is built into Service Desk Plus. It offers a little more …
Continue reading
Read all reviews

Awards

Products that are considered exceptional by their customers based on a variety of criteria win TrustRadius awards. Learn more about the types of TrustRadius awards to make the best purchase decision. More about TrustRadius Awards

Popular Features

View all 21 features
  • Customizable dashboards (111)
    8.5
    85%
  • Report sharing and collaboration (114)
    8.5
    85%
  • Drill-down analysis (109)
    8.0
    80%
  • Formatting capabilities (113)
    7.5
    75%

Reviewer Pros & Cons

View all pros & cons
Return to navigation

Pricing

View all pricing

Basic

$30

Cloud
0.5M rows, 2 users

Professional

$30

On Premise
per user per month billed annually

Standard

$60

Cloud
1M rows, 5 users

Entry-level set up fee?

  • No setup fee
For the latest information on pricing, visithttps://www.zoho.com/reports/zohoreport…

Offerings

  • Free Trial
  • Free/Freemium Version
  • Premium Consulting/Integration Services

Starting price (does not include set up fee)

  • $50 per month
Return to navigation

Features

BI Standard Reporting

Standard reporting means pre-built or canned reports available to users without having to create them.

8.3
Avg 8.2

Ad-hoc Reporting

Ad-Hoc Reports are reports built by the user to meet highly specific requirements.

8
Avg 8.1

Report Output and Scheduling

Ability to schedule and manager report output.

8.7
Avg 8.4

Data Discovery and Visualization

Data Discovery and Visualization is the analysis of multiple data sources in a search for patterns and outliers and the ability to represent the data visually.

7.9
Avg 8.1

Access Control and Security

Access control means being able to determine who has access to which data.

8.5
Avg 8.6

Mobile Capabilities

Support for mobile devices like smartphones and tablets.

7.6
Avg 7.9

Application Program Interfaces (APIs) / Embedding

APIs are a set of routines, protocols, and tools for used for embedding one application in another

7.9
Avg 7.9
Return to navigation

Product Details

What is Zoho Analytics?

Zoho Analytics is a self-service BI and analytics platform that enables users to analyze their business data and create insightful reports and dashboards to drive informed decision-making. The recent launch of Zoho Analytics 5.0 adds a data preparation tool.

It helps users create and share reports with no IT help, and is presented as a fit for enterprises because it exceeds all their data cleaning and analytics requirements on a single platform.

Zoho Analytics and DataPrep can be purchased as individual apps to supplement other systems, or together as a complete, natively integrated platform. Individually, Analytics provides a broad range of analytics and reporting capabilities, while DataPrep provides all the tools necessary to streamline the data preparation process in a large organization.

About Zoho's comprehensive Analytics platform:

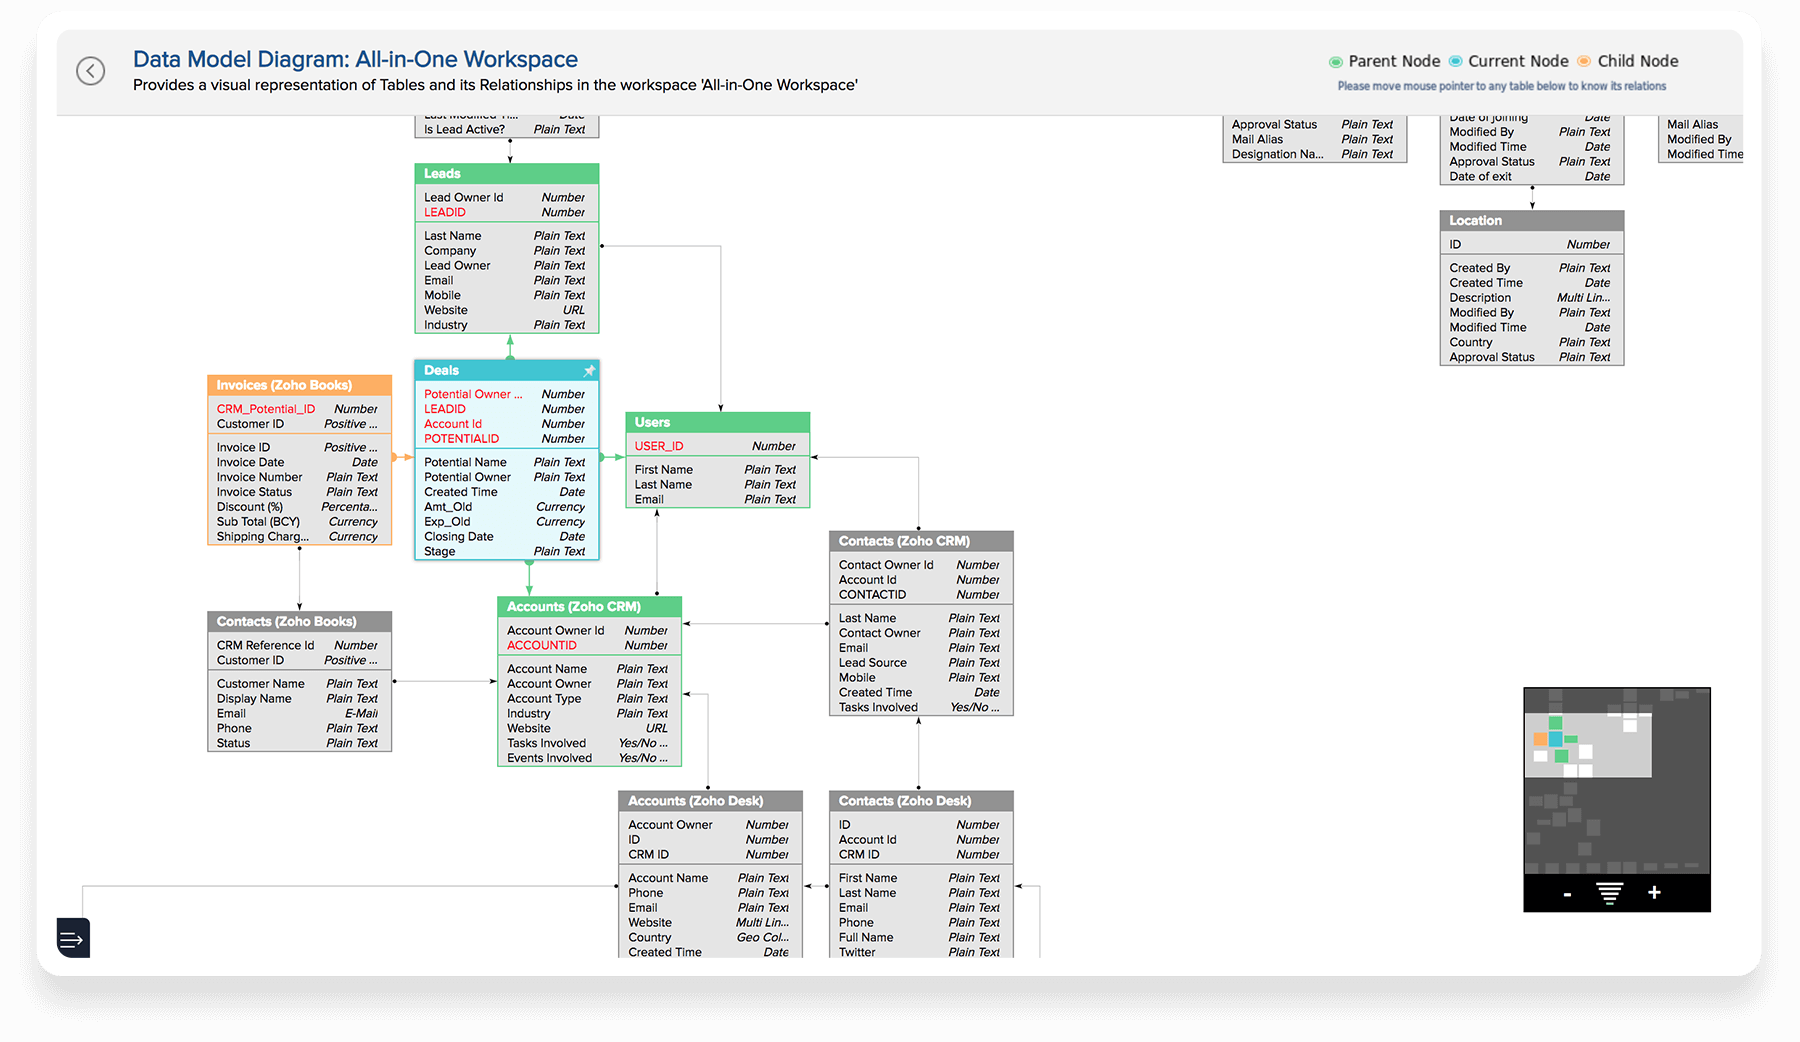
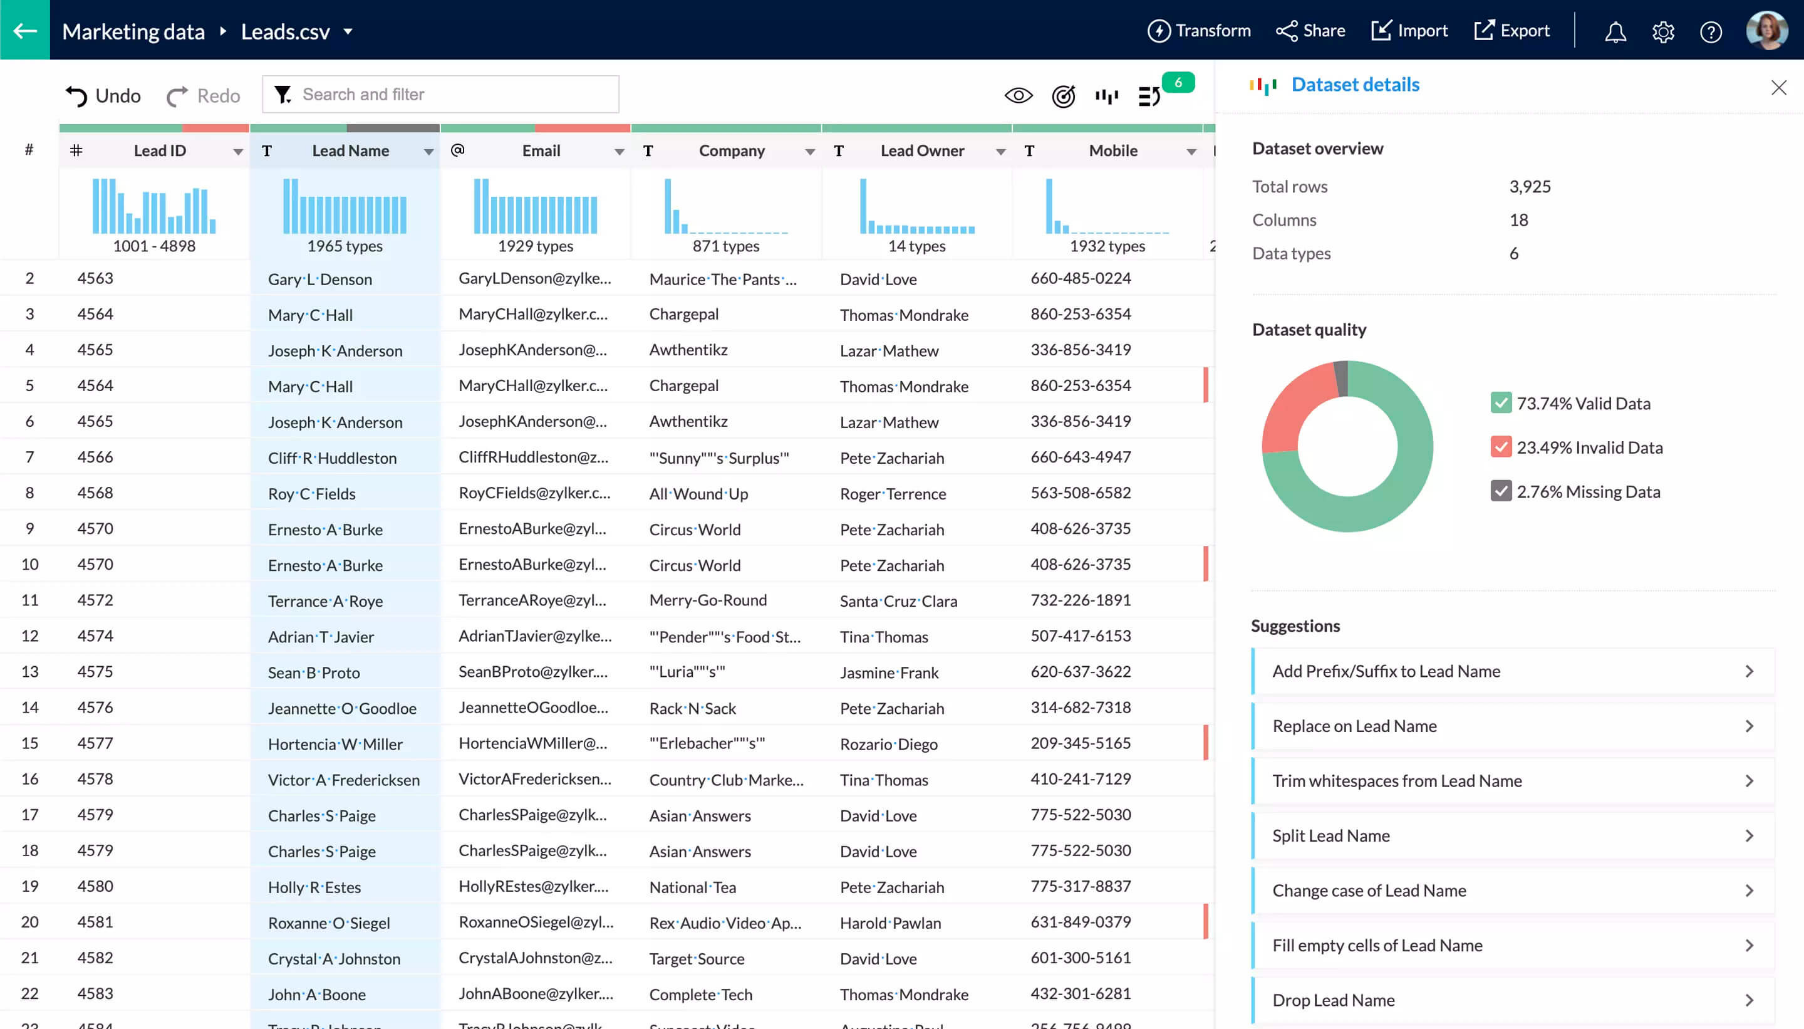
  • Zoho DataPrep: An augmented self-service data preparation and pipeline service . Connects, models, cleanses, transforms, and enriches data for analytics.

  • Upload any data: Securely upload spreadsheets and other tabular data (like CSV, TSV, XLS and HTML files), or add data directly using the spreadsheet-like interface.

  • Push data from any application: Push data from hosted or in-house (behind firewall) business applications and databases.

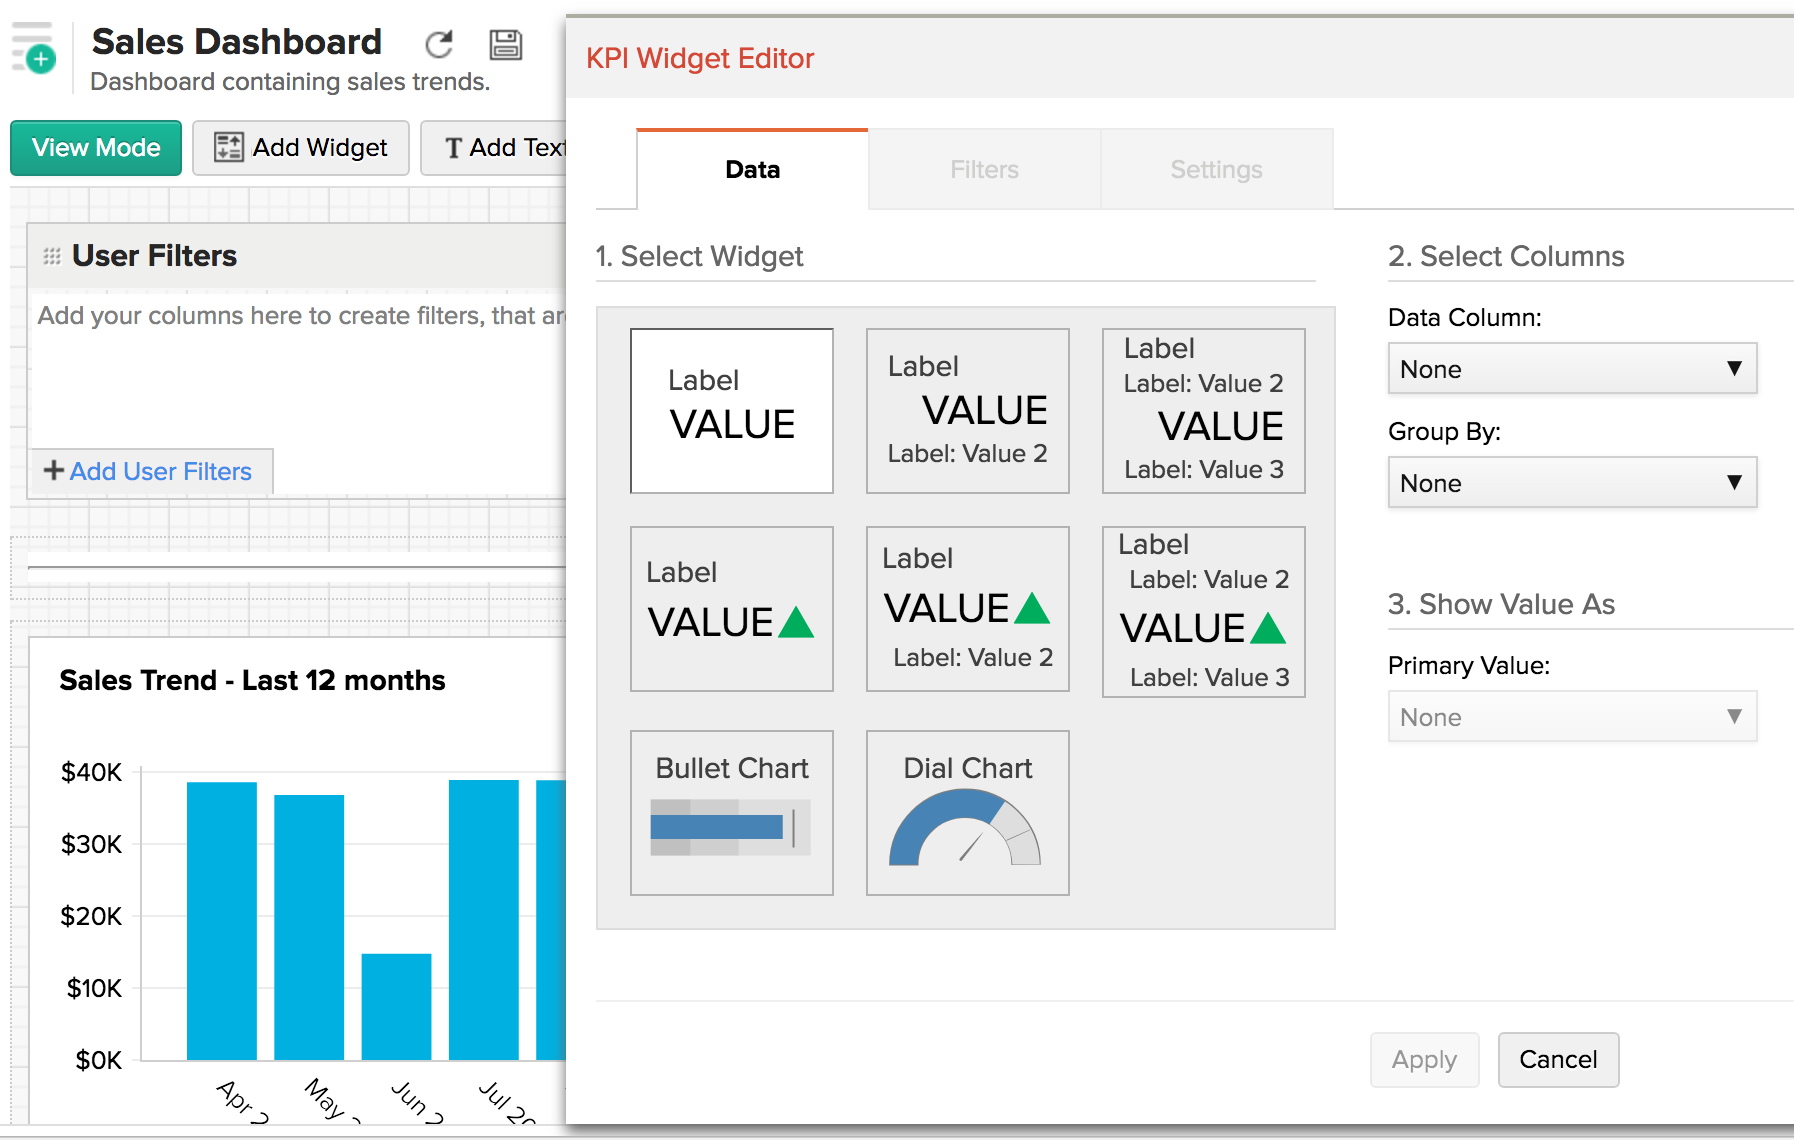
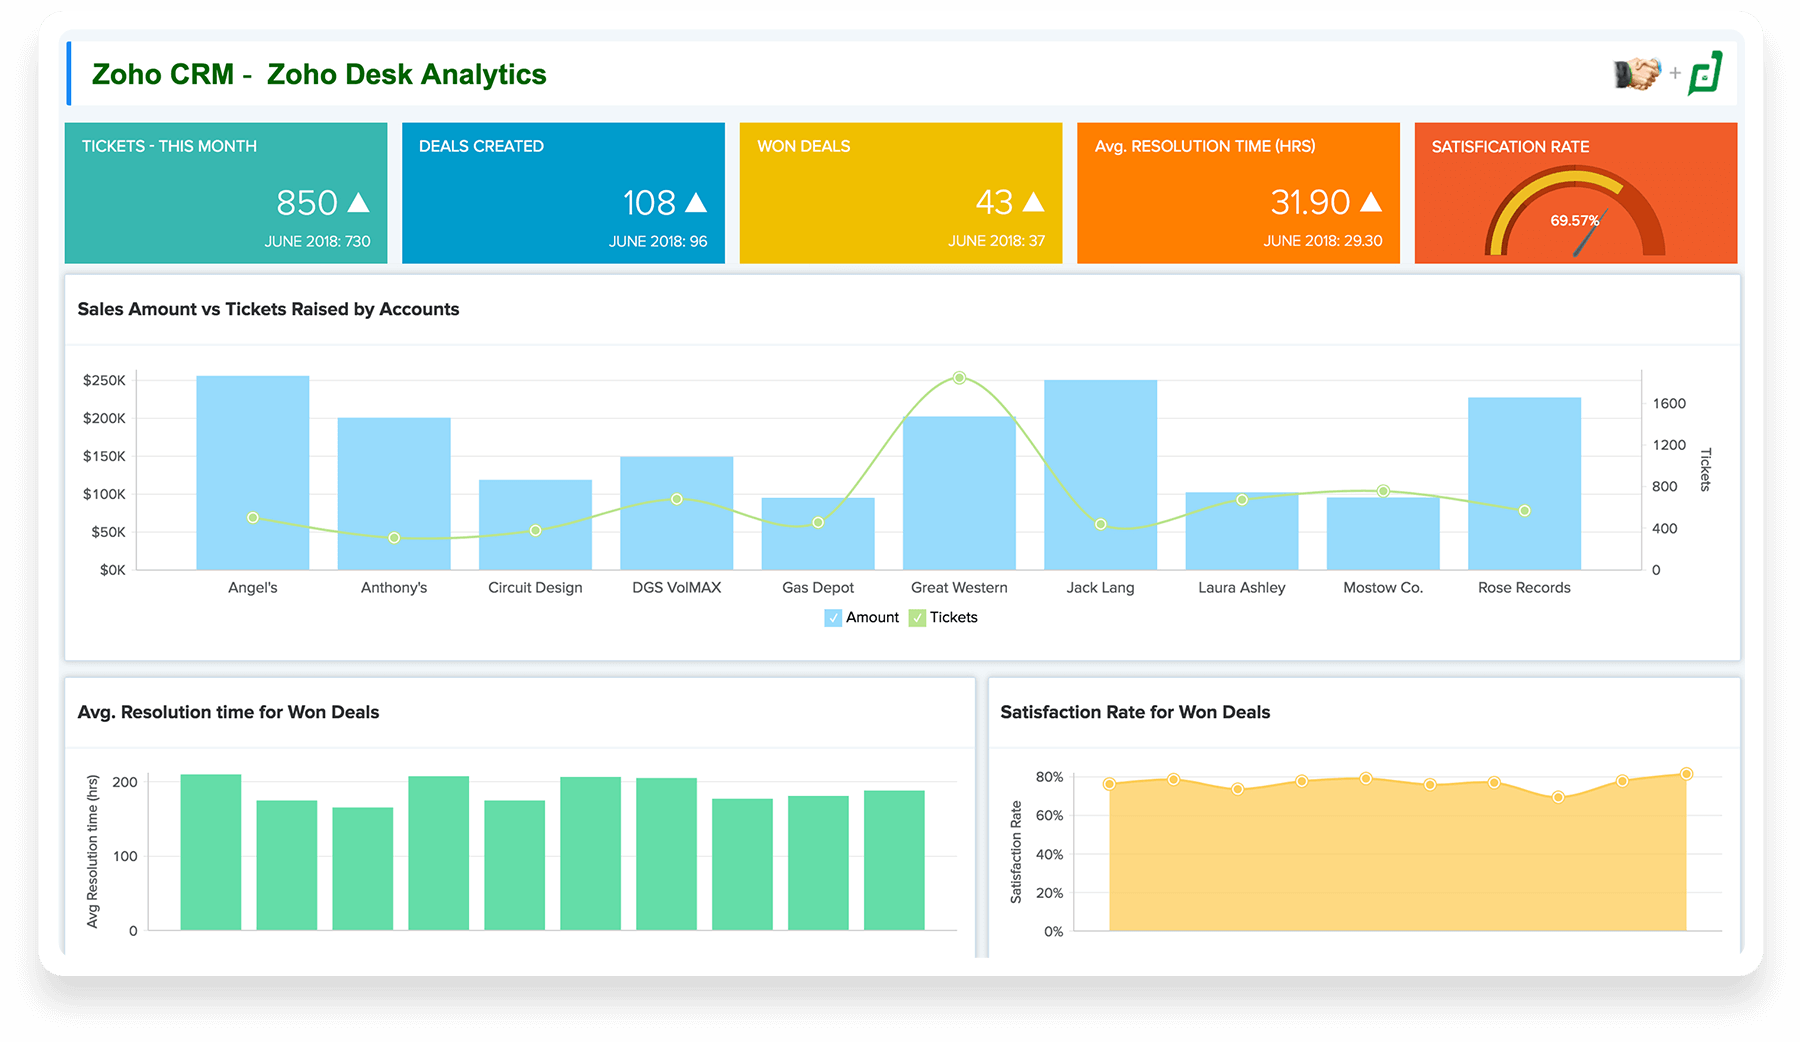
  • Analyze data visually: Visually analyze and build insightful reports and dashboards with a drag-and-drop interface.

  • Use a range of reporting components: Use a variety of charts, pivot tables and tabular view components to build reports and dashboards.

  • Analyze data collaboratively: Develop reports together with colleagues. Share with each other for better decision-making.

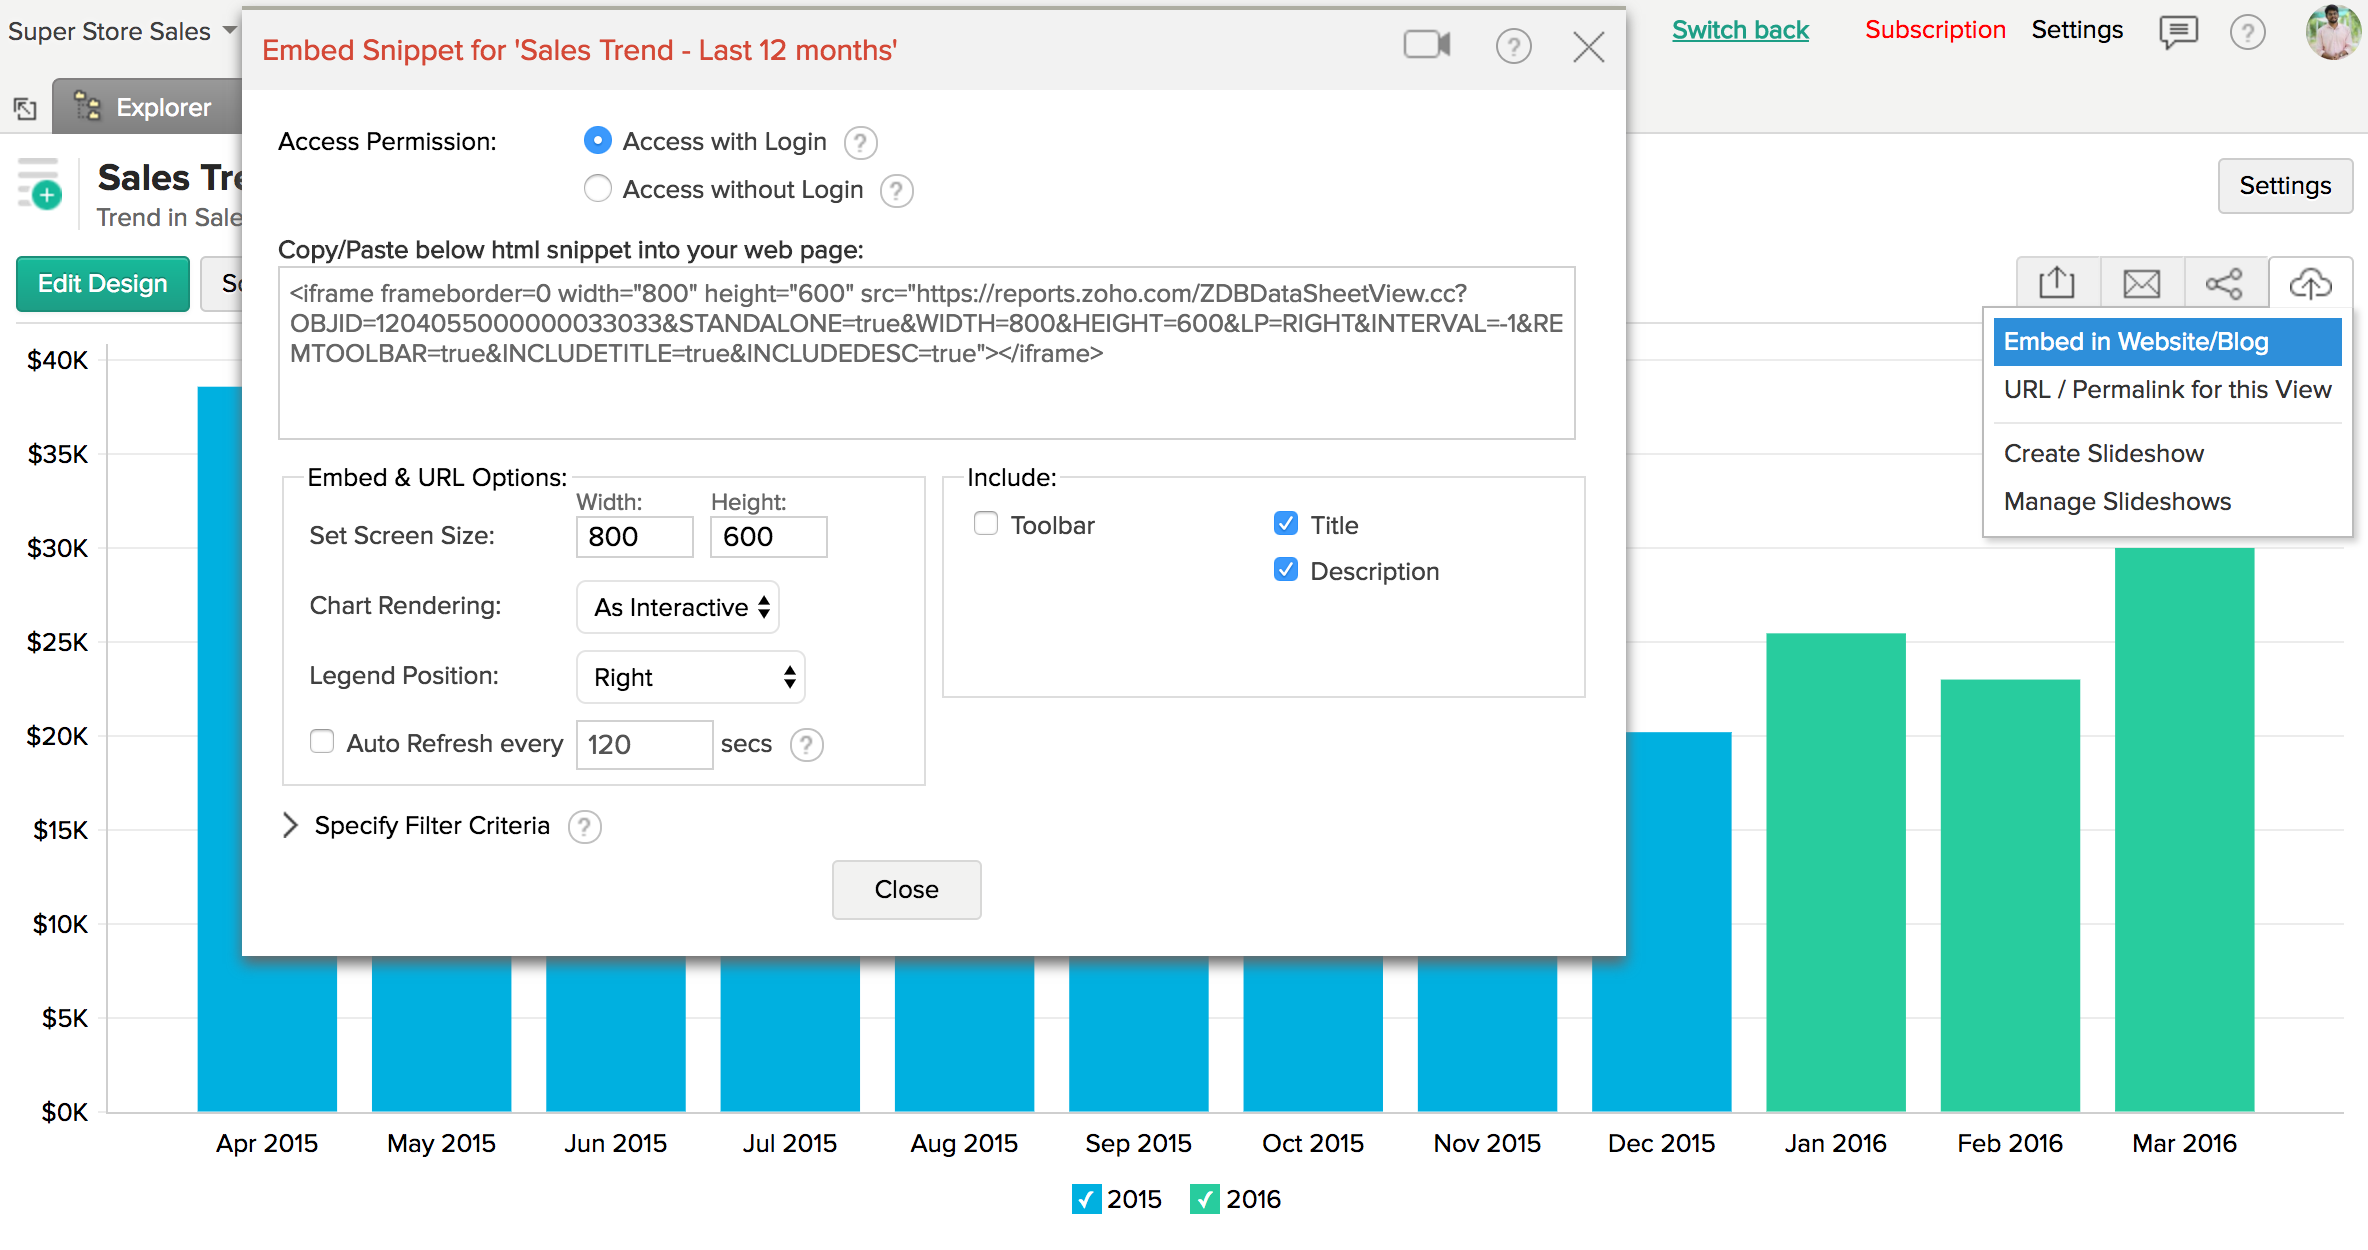
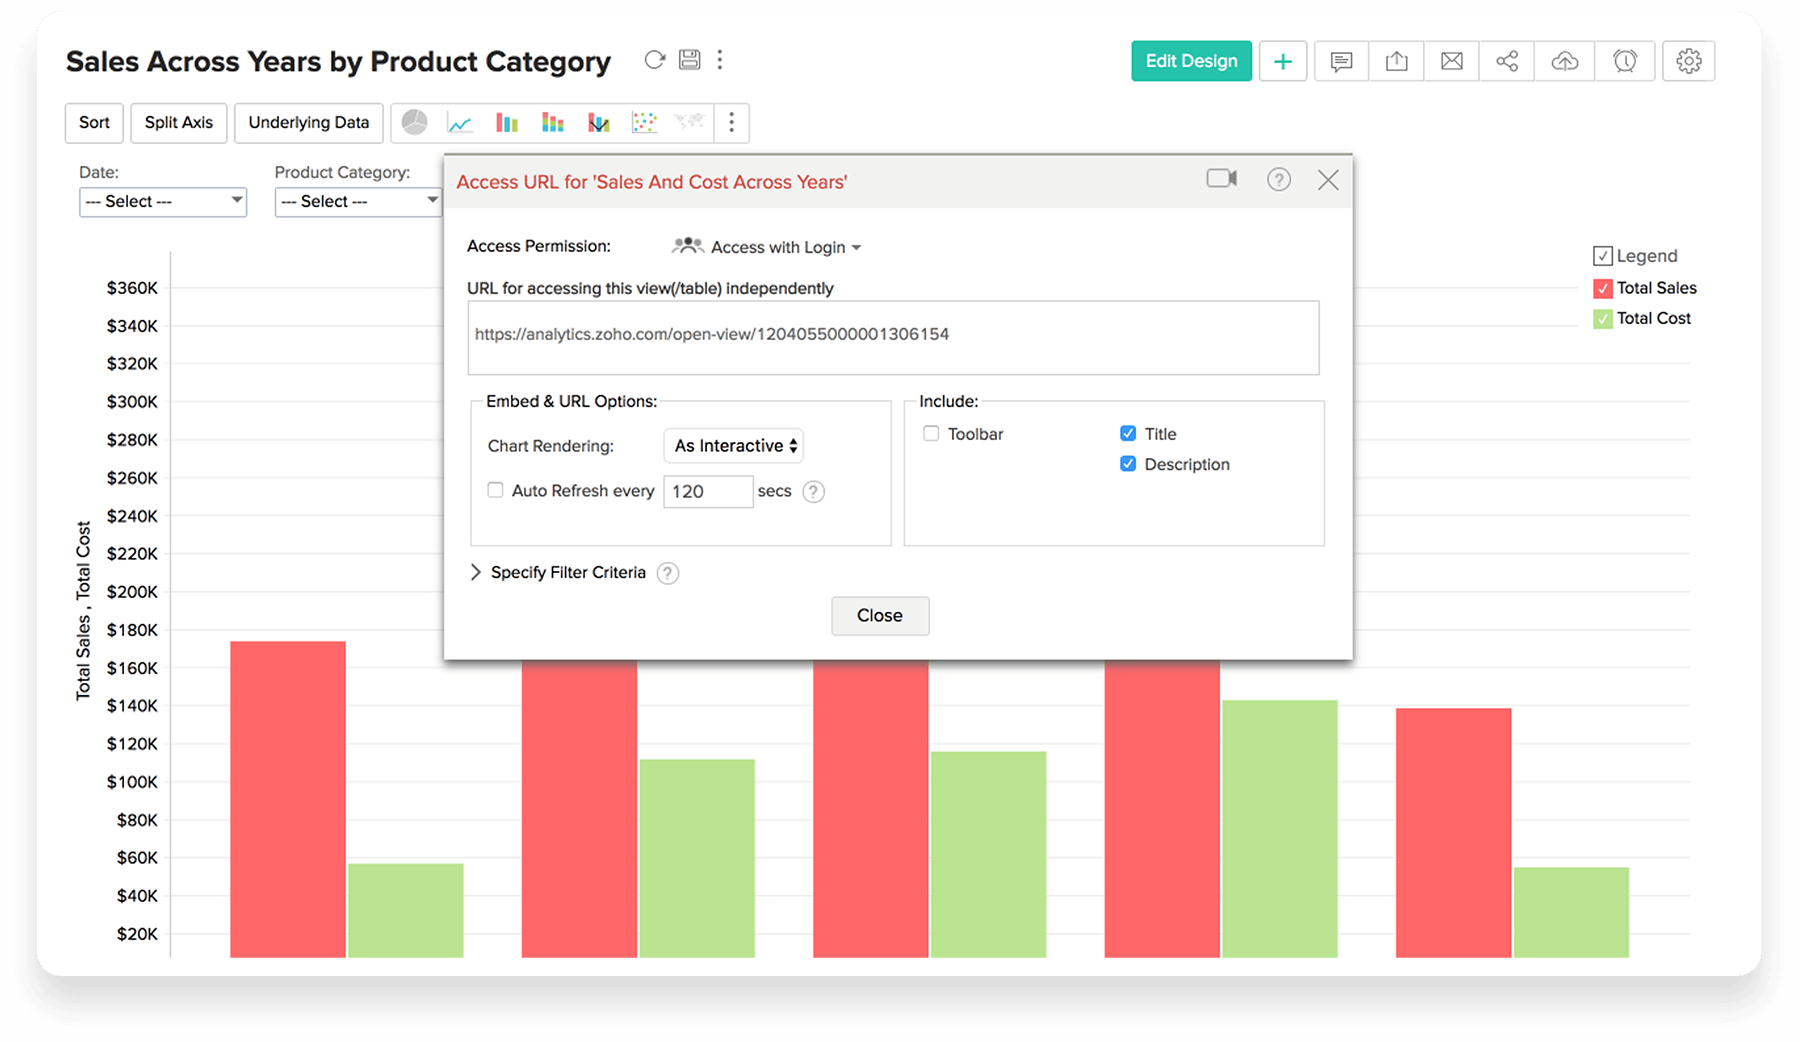
  • Embed reports anywhere: Embed reports and dashboards across websites, blogs and applications for wider consumption.

  • Query with SQL: Create powerful and flexible reports with SQL queries written in any database dialect/syntax.

  • Experience a highly secure platform: Zoho Analytics is governed by strong Zoho Security Practices, including support for a secure encrypted connection

  • Enhanced augmented analytics: Zia insights, conversational analytics, forecasting models, and what-if analysis.

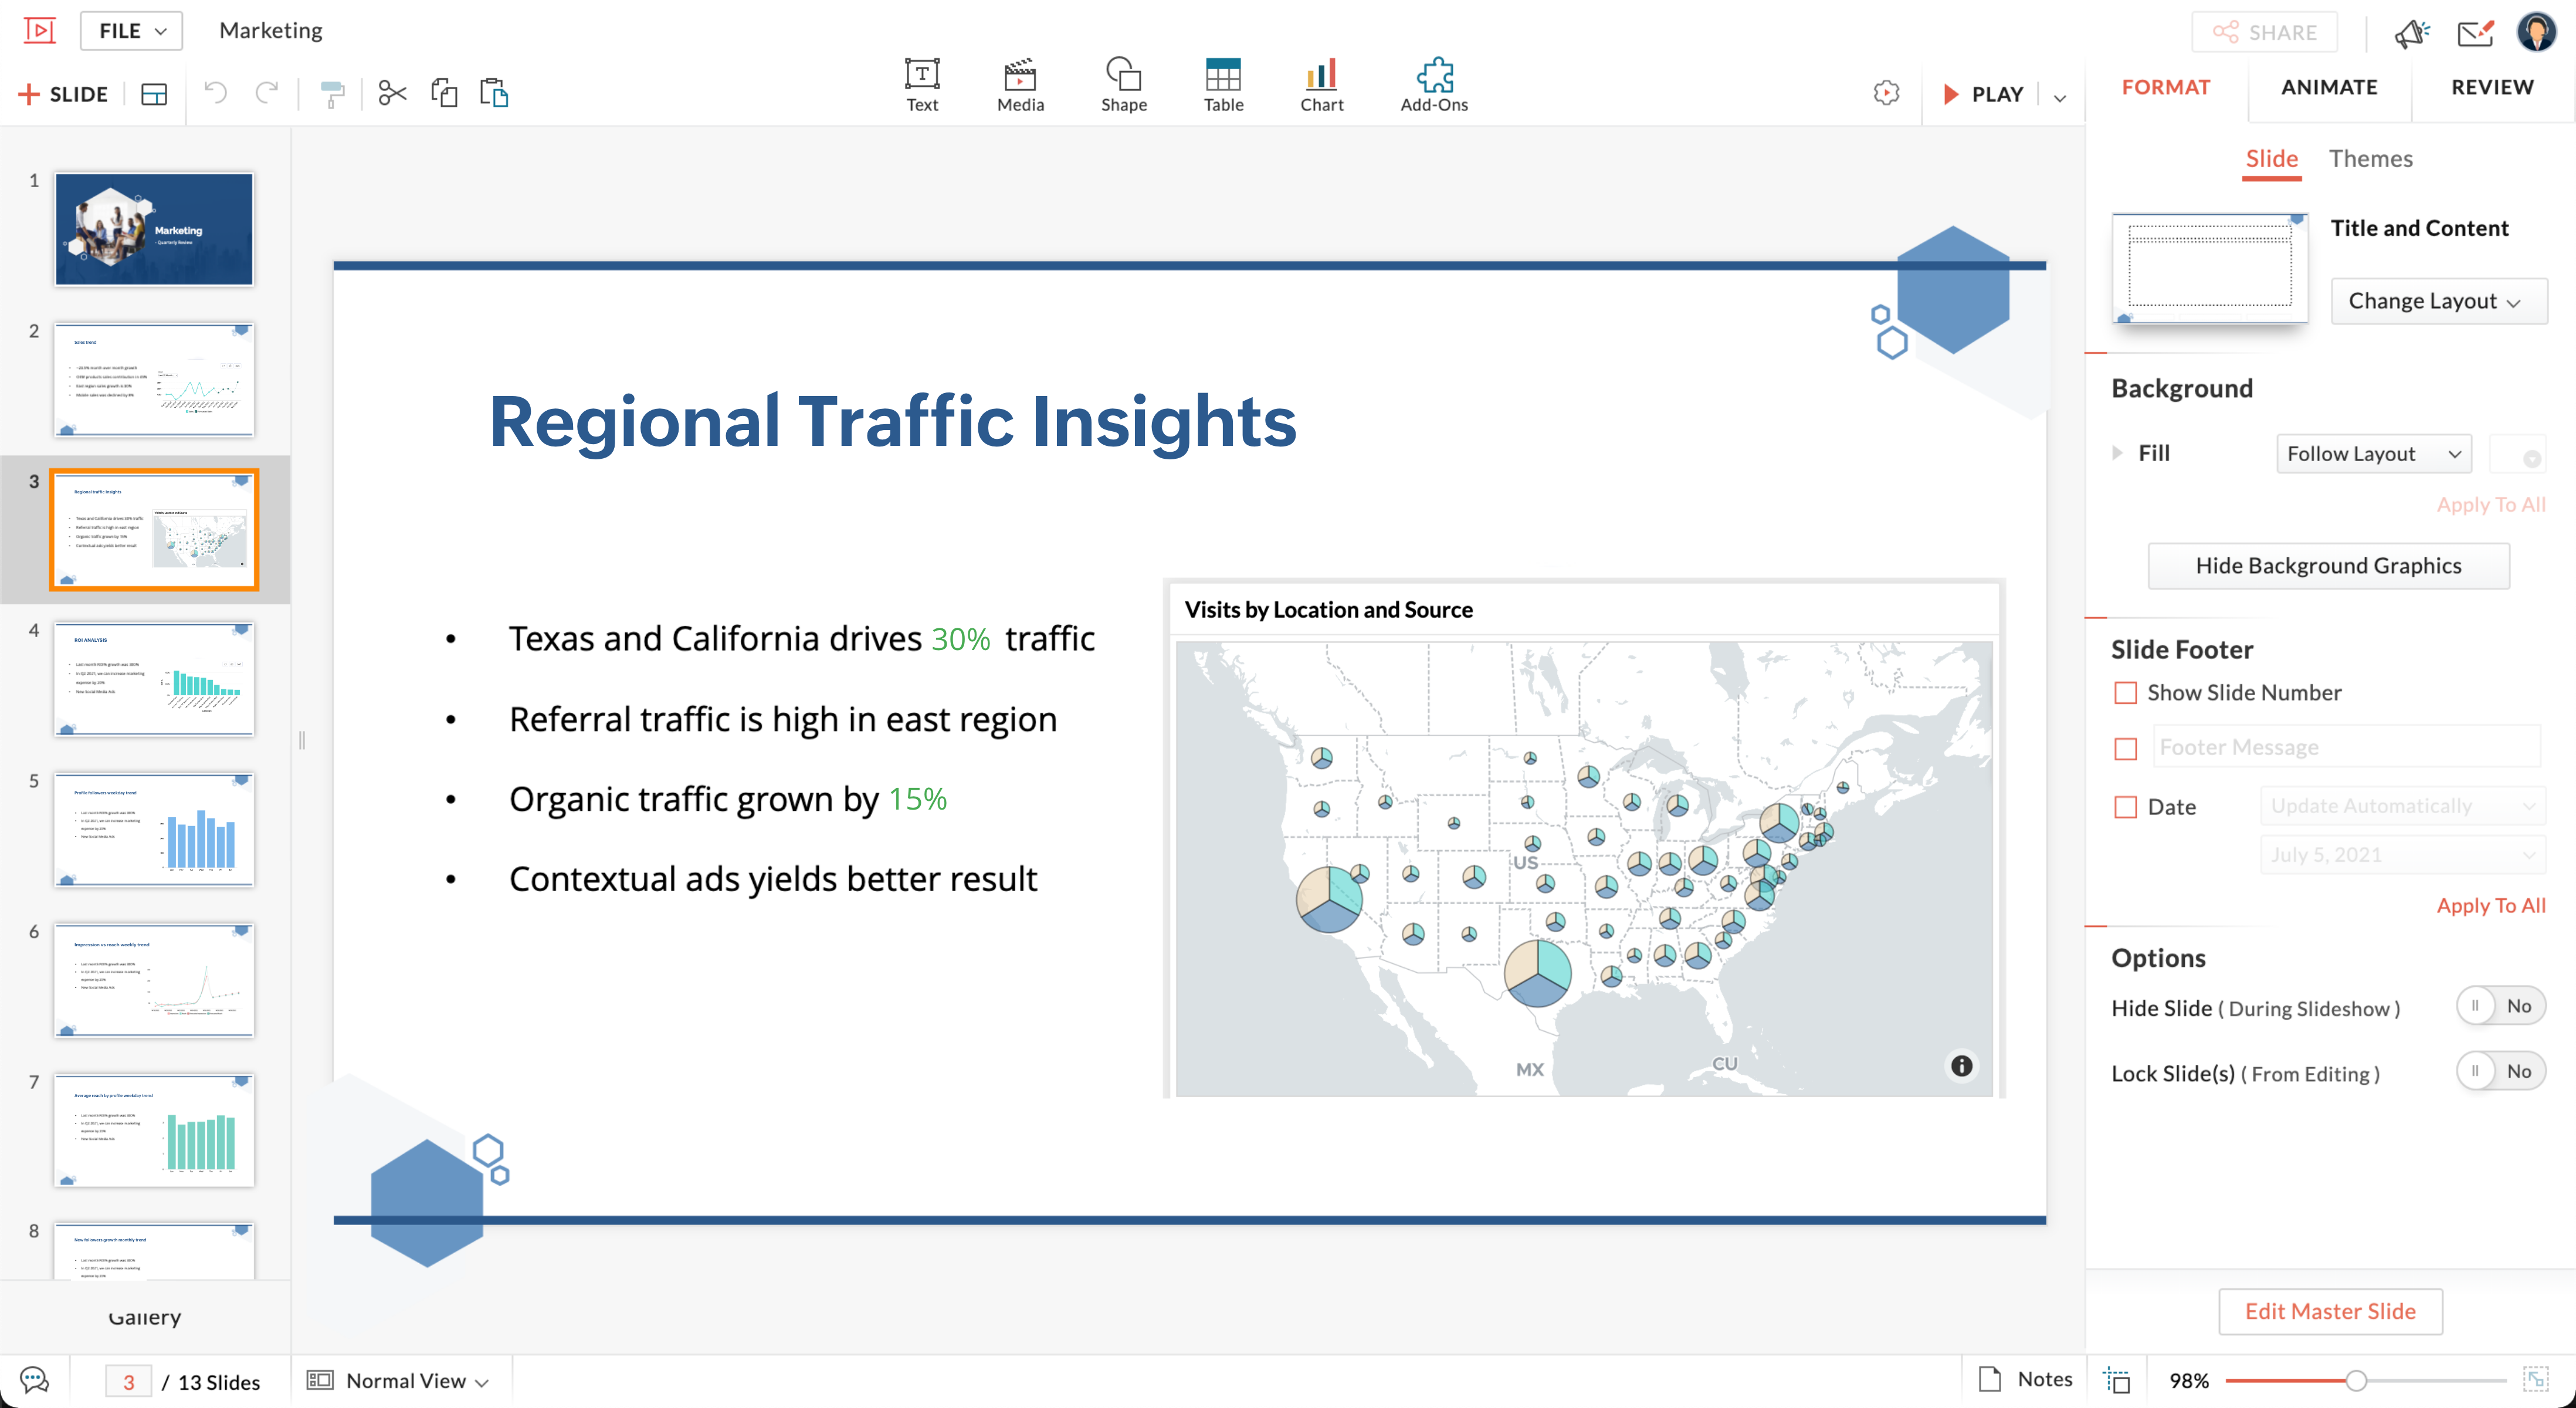
Data stories: Create presentations through slideshows and portals

Zoho Analytics Features

BI Platform Features

  • Supported: Administration via Web Interface
  • Supported: Live Connection to External Data
  • Supported: Snapshot of External Data
  • Supported: Multi-Data Source Reporting (Blending)
  • Supported: ETL Capability
  • Supported: ETL Scheduler

Supported Data Sources Features

  • Supported: MS Excel Workbooks
  • Supported: Text Files (CSV, etc)
  • Supported: Oracle
  • Supported: MS SQL Server
  • Supported: IBM DB2
  • Supported: Postgres
  • Supported: MySQL
  • Supported: Cloudera Hadoop
  • Supported: Hortonworks Hadoop
  • Supported: IBM Netezza
  • Supported: HP Vertica
  • Supported: Salesforce
  • Supported: Google Analytics

BI Standard Reporting Features

  • Supported: Pixel Perfect reports
  • Supported: Customizable dashboards

Ad-hoc Reporting Features

  • Supported: Drill-down analysis
  • Supported: Formatting capabilities
  • Supported: Predictive modeling
  • Supported: Report sharing and collaboration

Report Output and Scheduling Features

  • Supported: Publish to Web
  • Supported: Publish to PDF
  • Supported: Report Delivery Scheduling

Data Discovery and Visualization Features

  • Supported: Pre-built visualization formats (heatmaps, scatter plots etc.)
  • Supported: Location Analytics / Geographic Visualization
  • Supported: Predictive Analytics
  • Supported: Support for Machine Learning models

Access Control and Security Features

  • Supported: Multi-User Support (named login)
  • Supported: Role-Based Security Model
  • Supported: Multiple Access Permission Levels (Create, Read, Delete)
  • Supported: Report-Level Access Control
  • Supported: Table-Level Access Control (BI-layer)
  • Supported: Single Sign-On (SSO)

Mobile Capabilities Features

  • Supported: Responsive Design for Web Access
  • Supported: Mobile Application
  • Supported: Dashboard / Report / Visualization Interactivity on Mobile

Application Program Interfaces (APIs) / Embedding Features

  • Supported: REST API
  • Supported: iFrames

Zoho Analytics Screenshots

Screenshot of Access reports from iPad and Android tablets.Screenshot of Embed reports in your intranet, business application, website or blog.Screenshot of Track your business key metrics with KPI charts.Screenshot of A dashboard with KPI widgets.Screenshot of Access reports from iPad and Android tablets.Screenshot of Share reports with colleagues and clients, with fine grained access control permissions applied.Screenshot of See how your data tables are related to each other.Screenshot of A dashboard with KPI widgets.Screenshot of Track your business key metrics with KPI charts.Screenshot of Blend data and create reports and dashboards from multiple data sources.Screenshot of Engage in colloquial conversations with Ask Zia, and get relevant reports as answers.Screenshot of Create beautiful presentations with Zoho Show by seamlessly embedding analytical insights.Screenshot of Zoho DataPrep is an AI-powered, self-service data preparation and cleansing software that helps cleanse, transform and enrich your data quality.Screenshot of Executive dashboards: KPIs at the top give you a bird's eye view of your organization's metricsScreenshot of Stunning dashboards: Choose from a range of visually appealing themes for your dashboard. Try any of the packaged themes available, or customize your own theme.

Zoho Analytics Videos

Zoho Analytics Overview
Case study: Aedgency
Overview of Zoho Analytics
Advanced Analytics for Salesforce CRM, powered by Zoho Analytics
Case study: Luxer One
Case study: Aedgency
Zoho Analytics customer testimonials

Zoho Analytics Technical Details

Deployment TypesOn-premise, Software as a Service (SaaS), Cloud, or Web-Based
Operating SystemsWindows, Linux
Mobile ApplicationApple iOS, Android
Supported CountriesWorldwide
Supported LanguagesEnglish, Spanish, Portuguese, French, German, Italian, Dutch, Japanese, Chinese, Japanese, Russian

Zoho Analytics Downloadables

Frequently Asked Questions

Zoho Analytics (formerly Zoho Reports) is a self-service BI and analytics platform that allows users to analyze their business data and create reports and dashboards. It is designed to help users create and share reports quickly, without IT assistance.

Zoho Analytics starts at $50.

Tableau Cloud, Microsoft Power BI, and Sisense are common alternatives for Zoho Analytics.

Reviewers rate Multi-User Support (named login) highest, with a score of 8.9.

The most common users of Zoho Analytics are from Small Businesses (1-50 employees).

Zoho Analytics Customer Size Distribution

Consumers10%
Small Businesses (1-50 employees)40%
Mid-Size Companies (51-500 employees)30%
Enterprises (more than 500 employees)20%
Return to navigation

Comparisons

View all alternatives
Return to navigation

Reviews and Ratings

(289)

Attribute Ratings

Reviews

(1-25 of 115)
Companies can't remove reviews or game the system. Here's why
Score 9 out of 10
Vetted Review
Verified User
Incentivized
It's really well suited for organizations with data from multiple sources, especially non-conventional ones like spreadsheets. It might be less appropriate for organizations with much more mature data infrastructures, but I am not sure, because that is not our organization.
Rafael Grandizoli | TrustRadius Reviewer
Score 9 out of 10
Vetted Review
Verified User
Incentivized
Zoho Analytics is well suited to create quick reports and dashboards for daily use, share with your team, or when you need to give a professional look at that presentation. With the data imported into Zoho Analytics, you can create dynamic charts to get quick insights and put them all together in a presentation or dashboard.
Arpit Jain | TrustRadius Reviewer
Score 7 out of 10
Vetted Review
Verified User
Incentivized
Well suited for modern systems definitely, with open architectures which allow you to access data using APIs or the cloud. The more native a system is, the less likely it is that you would be able to connect it to Zoho Analytics.
February 27, 2024

Zoho or Uh-oh?

Score 5 out of 10
Vetted Review
Verified User
I'm on the fence currently. There has been nothing (to me) truly spectacular with Zoho Reports to make me rant and rave about it to the first person to ask. It's a tool. The tool works well. Support is good. You will need to purchase it month to month or yearly.
Score 8 out of 10
Vetted Review
Verified User
Incentivized
Zoho Analytics is well suited for organization that wants to analyze business problems, track operational metrics, who wants to automate manual work they can fully leverage this platform which is made for this purpose only. Zoho Analytics fully automates your manual work you can schedule your analysis on your email so they will send you real-time analysis send you on your mail daily.
Score 10 out of 10
Vetted Review
Verified User
If you've got multiple applications to pull data from, Zoho Analytics is key. As soon as you get beyond hundreds, and into thousands of rows, I'd say you need a tool like Zoho Analytics. We've used it to analyze millions of rows and the engine seems to work well.

If you've been able to utilize Excel to create visualizations, you'll find Zoho Analytics to be much more user friendly, in my opinion.
Dr. ROOPESH RAO | TrustRadius Reviewer
Score 8 out of 10
Vetted Review
Verified User
Incentivized
Zoho Analytics is an excellent application which helps in creating meaningful data, with the help of data visualization, creations and structure. It gives insights into making the data wonderful. It provides unique structure of prestation and meaningful data that can be used to provide different insights int business. Business will definitely benefit from the analytics it provides.
Prasanna Kumar TR | TrustRadius Reviewer
Score 7 out of 10
Vetted Review
Verified User
Incentivized
There are many instance, where we need to identify the linked pages user has visited, we have used the data represented to analyze how the page patterns are looking at the dashboard level. It helps to customize require charts/graphs in the single page.

Zoho Analytics helps to build the custom dashboard in large scale environment
Gerardo Varillas | TrustRadius Reviewer
Score 9 out of 10
Vetted Review
Verified User
Zoho Analytics is awesome for budget, SLA and availability analysis, I wrote "analysis" not "monitoring" because is not a monitoring tool, all the unavailability detections were made for the monitoring tool (OpManager in my case) and after that, we can analyze the economic impact that they had to our business because of penalties.

Zoho Analytics is not so appropriate if you are looking for a tool that provides you the information in real-time because it needs to synchronize the data every X hours you set, the less is 2 hours.
Score 8 out of 10
Vetted Review
Verified User
Incentivized
Overall Zoho ecosytem is all good for new age startups to start and manage the stuff online. Particularly for Zoho Analytics its a good platform for geting detailed insights and working of the company, and with its integrations with other Zoho and third part apps it make it more convenient to interact with customer
Score 8 out of 10
Vetted Review
Verified User
Incentivized
  • Well suited for integration of different connectors
  • User experience and UI response are quite good comparatively in most cases.
  • Quick and faster setup of operations, and project management tools. Migration is also easy.
  • Analytics dashboard could be better in terms of update of new data.

Score 10 out of 10
Vetted Review
Verified User
Incentivized
Zoho Analytics (formerly Zoho Reports) is well suited for pulling reports for things just as demographics. Our organization also loves the ability to customize the reports to fit our everyday needs that may look different from other organizations. Some challenges include needing specific technical expertise to customize the reports.
Sathish Ranganadhan | TrustRadius Reviewer
Score 10 out of 10
Vetted Review
Verified User
Incentivized
Since it is a cloud-based platform, there is no need to worry about infrastructure.
It doesn't require in-depth coding skills so implementing the changes is quick.
Can connect any data, sources, URLs and many more: you can import and create spreadsheets, CSV files, HTML, text files, charts, reports, pivot tables, etc
Score 9 out of 10
Vetted Review
Verified User
Incentivized
In terms of value for the money, I think Zoho Analytics is very strong. If you are a small company that wants access to a powerful analysis platform, and need to support multiple users (either employees or clients) then Zoho Analytics is great. If you are using the Zoho One subscription then the value increases even more.
Score 9 out of 10
Vetted Review
Verified User
Incentivized
One of the nicest features Zoho offers is its extensive data integration capacity. The main relational databases used by my company's technical divisions are connected to by Zoho Analytics. Aside from the fact that the Zoho analytics mobile app has fewer features than the computer version, I also find the mobile app to be unintuitive and there is a constant tendency for notifications to be delayed.
Abhideep Jain | TrustRadius Reviewer
Score 8 out of 10
Vetted Review
Verified User
Incentivized
We had chosen Zoho Analytics as our preferred BI platform due to 2 main reasons:
1. We were already using Zoho CRM and Zoho Analytics integrates well with Zoho CRM and learning curve is not so steep
2. With the cloud version (SaaS), the implementation cost was almost negligible and any smart engineer can deploy it for the entire company (if company size is not huge)
3. It has all the features that we would need
Score 10 out of 10
Vetted Review
Verified User
Incentivized
Zoho Analytics is well suited to blend data together from different Zoho apps. For example; we manage part of our business in Zoho CRM and another part within a Zoho Creator app, with both parts referencing the same customer. In Zoho Analytics we are able to combine data from each Zoho app to gain deeper insights about a customer.
Alyssa Storm | TrustRadius Reviewer
Score 2 out of 10
Vetted Review
Verified User
Incentivized
Zoho Analytics works well if you are looking to display data from other Zoho applications. My organization used Zoho Analytics to create custom reporting dashboards for time tracking data from Zoho Projects, and it was a great solution. If you’re looking to integrate data from a variety of external sources, you might want to look elsewhere. [In my opinion] Zoho Analytics is not worth the hassle, especially when you could set things up more easily with a tool like Google Data Studio, Tableau or TapClicks.
Michael Weisel | TrustRadius Reviewer
Score 10 out of 10
Vetted Review
Verified User
Incentivized
If you are pulling data from an API, Zoho Reports has to be one of the easiest products to use. Following the quick directions, you can get up and running with pulling in and parsing data in no time. It's also very easy to take that data and then create an easily readable graphic interpretation of your data.
Score 10 out of 10
Vetted Review
Verified User
I think analytics and data can help in every scenario. Analytics can be really detailed so there might be times where it may not be as necessary as more simple products. If a company uses Zoho then adding Zoho Analytics will allow for greater ease of use than in comparison to Tableau.
Andrés Barrios Rubio | TrustRadius Reviewer
Score 8 out of 10
Vetted Review
Verified User
Incentivized
It is suitable for time optimization, planning a whole strategy of presence and dissemination of content on specific days and times. Likewise, it is supremely adequate in the statistical topic that it throws for the analysis of the implemented strategy. You can improve on the theme of publications adapted to the particularities of each network, allow the message to be on screen, and move details of photos and particular accounts of each network.
Score 10 out of 10
Vetted Review
Verified User
Custom report creation to track inventory, collection, billing, CRM and sales on the regular basis. Custom query builder is really intuitive and new reports can easily be created, scheduled and modified by using the conversational interface available. Mobile version of the app help me manage my reporting needs on the go. SME's and industry specific reporting would be a great feature to add.
Jaideep Tibrewala | TrustRadius Reviewer
Score 10 out of 10
Vetted Review
Verified User
Incentivized
Zoho Analytics is great esp when you don't have an analytics person on your team and need to quickly build your own dashboards.
Zoho Analytics is not so well suited when you have data across different databases and need to connect them all through live connections.
Return to navigation