


An almost perfect analytics solution

Pros
- Dedicated support: AT Internet really cares for its customers. When things get stuck for some reason you'll get addressed pro-actively.
- Quality: The platform hardly ever seems to have breaks. It feels stable and reliable.
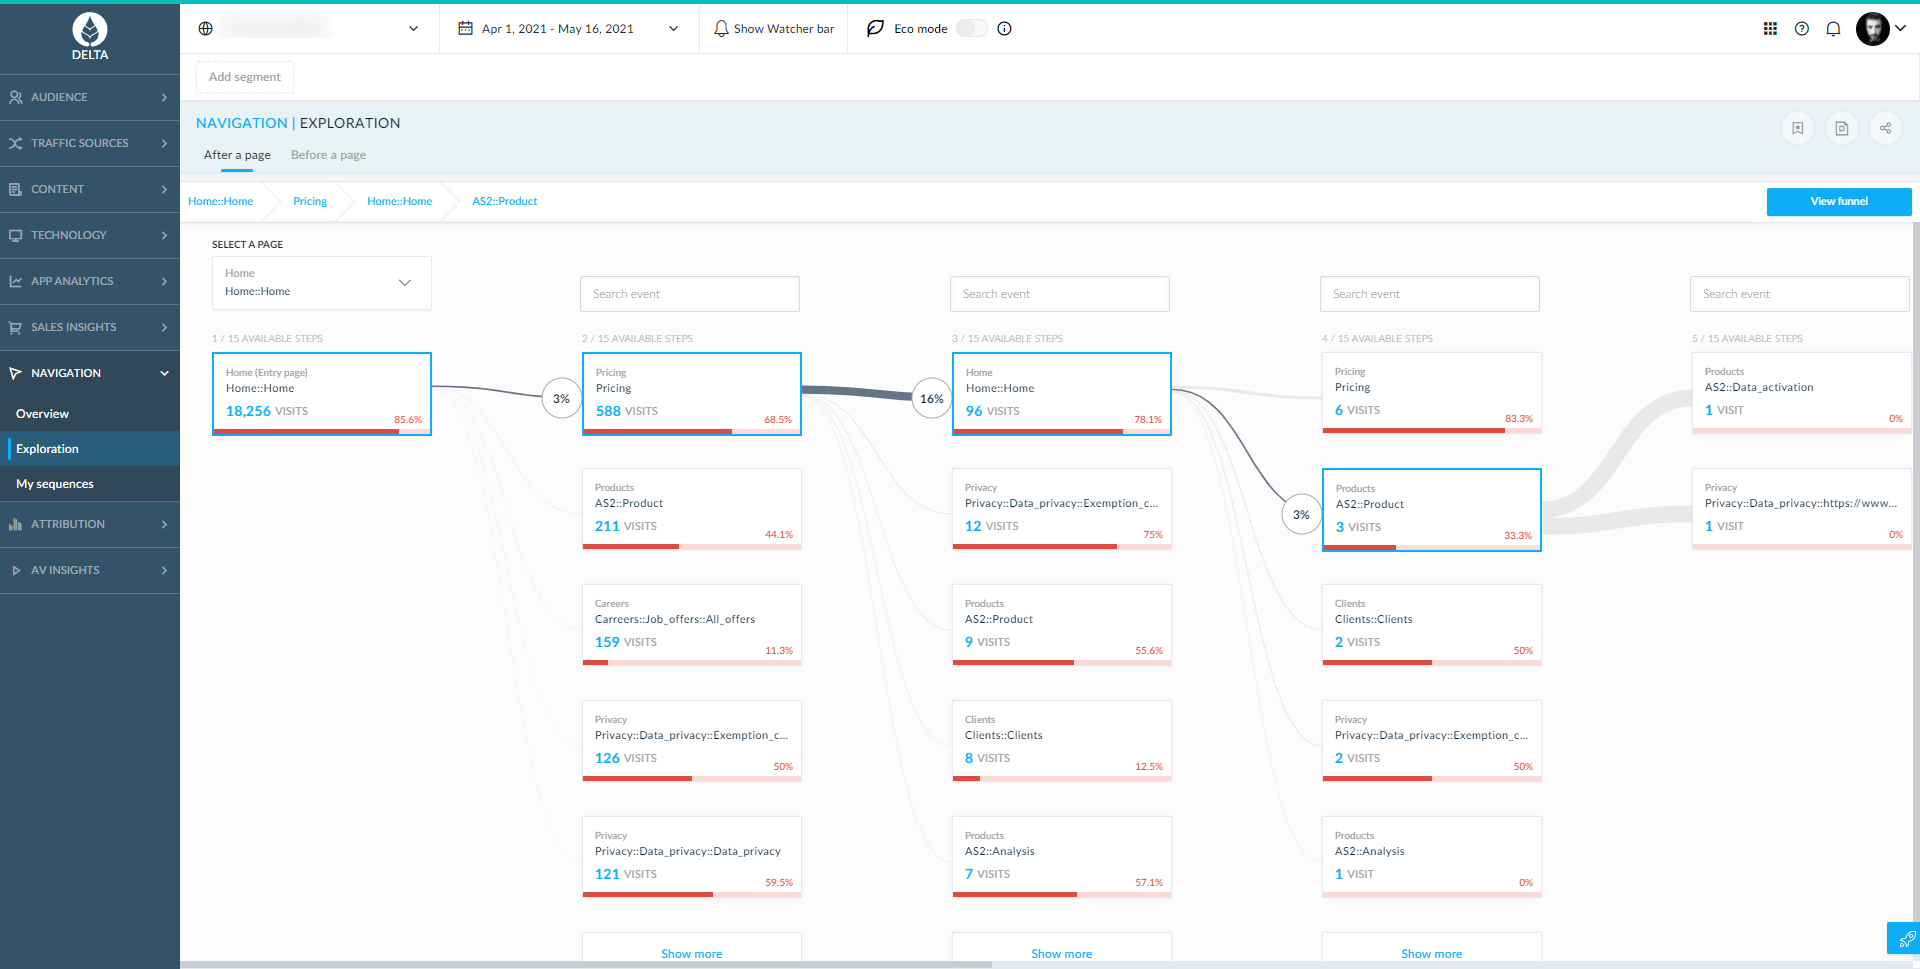
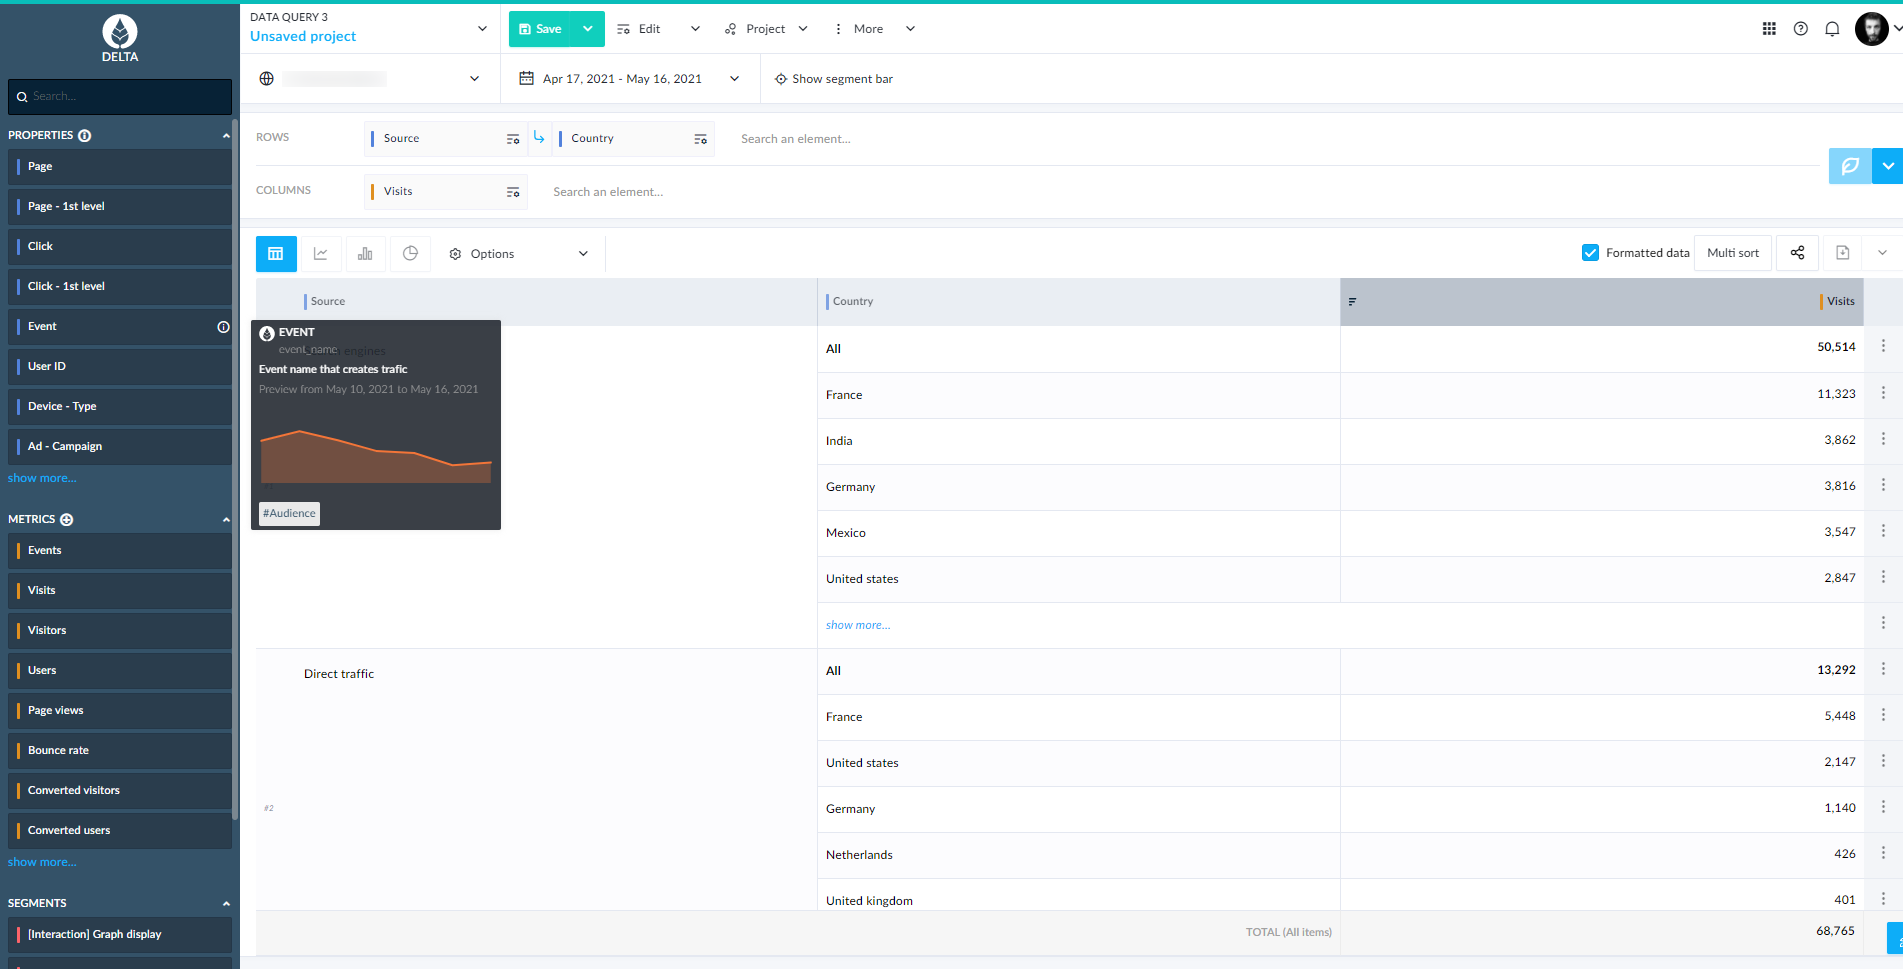
- Do-it-yourself: After attending a training anyone should be able to set up their own dashboards or to conduct sophisticated research.
Cons
- Confusing properties: Sometimes you don't exactly know which property to use in a specific case because there are so many. This can end up in trial & error routines.
- Performance: It's tons of data for sure. Processing these data sometimes takes very long. The new data foundation DELTA brings some improvements to this issue, though.
- Pricing: it's a professional software solution and not Google Analytics. It comes with some significant costs. And you'll spend extra money on professional services for training and implementations.
Return on Investment
- The data we gained helped us to improve our website.
- The statistics helped to justify investments in specific areas.
- The statistics help us to avoid investments in areas that might not contribute to our goals.
Alternatives Considered
etracker and Google Analytics
Other Software Used
HubSpot CRM, Sprinklr Modern Marketing & Advertising, Cumulus


