
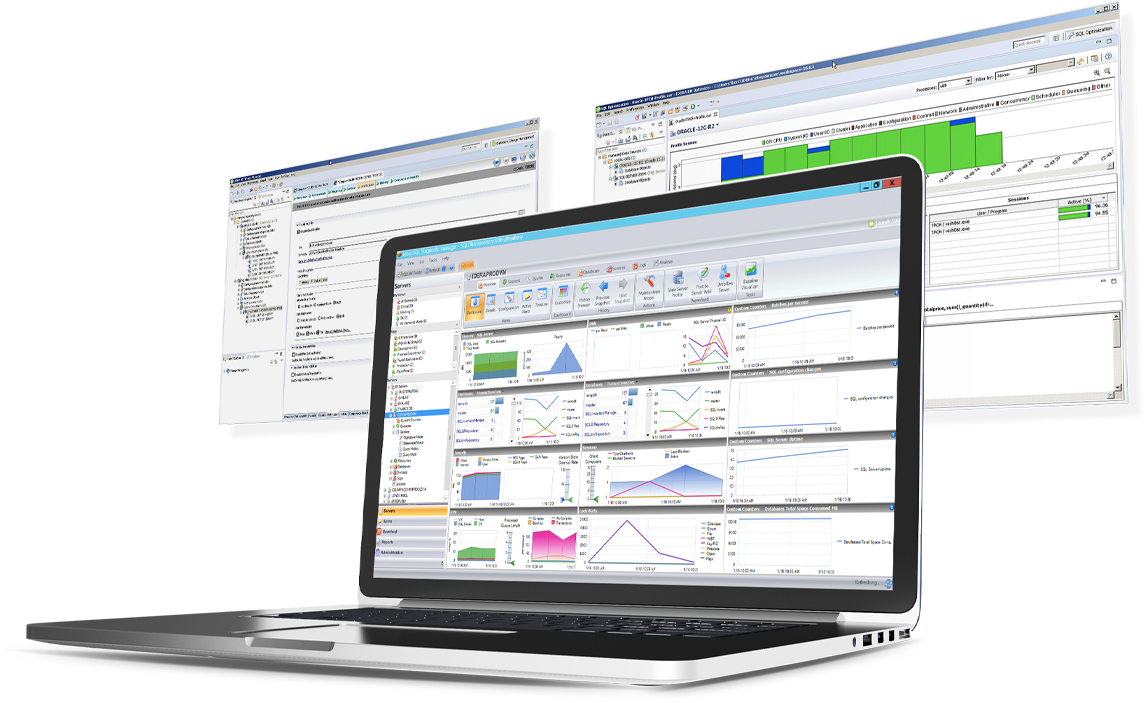
IDERA SQL Diagnostic Manager for SQL Server Smart Dashboard

Pros
- Database query optimization.
- Monitoring of databases in real time.
- Performance analysis and trends in the database.
Cons
- Detection of heavy database queries.
- Monitoring of database configuration changes.
- Obtaining data from multiple database servers simultaneously.
Return on Investment
- Reduce development hours by locating the queries to be optimized.
- Reduce hardware cost by requiring fewer hardware resources by optimizing database queries.
- Provides a very complete scorecard.
Alternatives Considered
Redgate SQL Monitor and LogicMonitor
Other Software Used
Oracle SQL Developer, MariaDB MaxScale, SolarWinds Database Performance Analyzer


