New Relic is a SaaS-based web and mobile application performance management provider for the cloud and the datacenter. They provide code-level diagnostics for dedicated infrastructures, the cloud, or hybrid environments and real time monitoring.
$0
No credit card required; 100 GB free ingest per month, 1 free full user + unlimited basic users, 8 days retention, 100 Synthetics Checks
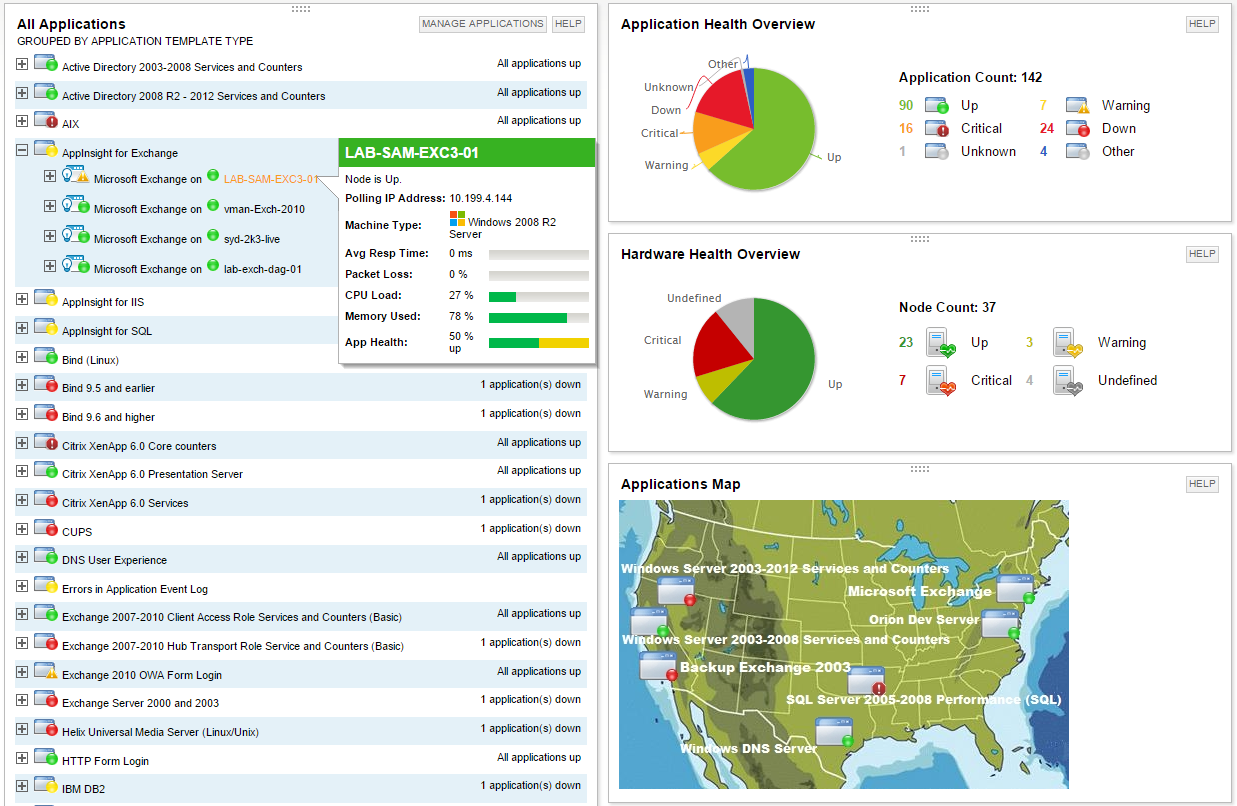
SolarWinds Server & Application Monitor
Score 8.4 out of 10
N/A
SolarWinds Server & Application Monitor (SAM) delivers application and server monitoring capabilities. SAM allows for self-service for easy setup, 1200+ monitoring templates, and customization options, as well as integrate with other SolarWinds products.
N/A
Pricing
New Relic
SolarWinds Server & Application Monitor
Editions & Modules
Free (Forever)
$0
No credit card required; 100 GB free ingest per month, 1 free full user + unlimited basic users, 8 days retention, 100 Synthetics Checks
Telemetry Data Platform
$0.25
per month per extra GB data ingest (after first free 100GB per month)
Incident Intelligence
$0.50
per month per event (after first 1000 free events per month)
Standard
$99
per month per full user (after first free full user - unlimited free basic users)
New Relic is a SaaS-based tool where the health or sanity checks of the tool have been taken care of by the product team. So the maximum time can be invested in using the tool and making the best use of the feature available in the tool. The flexibility option it provides to …
SAM shines in a mixed environment but really excels where the environment is predominantly on-prem. Both New Relic and Datadog offer an Infrastructure + APM solution. New Relic struggles with Infrastructure and Datadog struggles with APM. SolarWinds does not claim to be an APM …
Compared to New Relic, SolarWinds Server & Application Monitor definitely is a better option and a better tool to use due to it is more user friendly despite the poor UI of SolarWinds Server & Application Monitor. Because of the above reason, my company is switching from New …
Nagios and Rancid are used internally by a company that was acquired last year. They're a big open source group.
Other groups also use HostMonitor, Big Brother, and a couple of home grown tools that don't really stack up. Those groups don't want to change the way they do …
New - relic is well suited if you want to analyse the performance of your services and you want to improve it. Integration with multiple services with same account gives a clear picture of flow of your APIs if you have micro-service architecture. New-relic is less appropriate when you want to do logging of your system. As it does not emits every single calls
For monitoring applications that run on Windows hosts on VMware or HyperV virtualization, SolarWindows offers a nice, vertical view of both the loads and the resources. In such an environment, this makes life really good! But if you have something else -- for example, Linux hosts -- you're on your own to some extent. That is, the things it does well, it does very well -- but everything else is much less polished.
gives us an monitoring of all our underlying servers and also we can configure some alerts upon them like CPU and memory alerts.
Kubernetes cluster monitoring with new relic for EKS gives us and minute details of our cluster utilisation like node usage, pods memory request and limits
Network traceability for each and every request with response time analysis is great we can trace which component is responsible for generating response delay
log managements of the logs the infrastructure is generating we can view logs through there only
I would like to see sort of simulator inside the user interface, that way we can send requests directly from it to test some configuration instead of setting up a test environment in our end.
It would be nice if the data ingestion can be filtered by APM's. That way we can know which application is ingested most data.
It would be nice if we could ingest logs (apache, system logs, and other logs) and correlate them with the APM.
Provides basic monitoring/visibility. Visibility into detailed/fine-grained issues best suited for more specialized/expensive solutions.
Licensing per monitored application rapidly uses up purchased license count.
More out-of-the-box templates or easier setup of monitoring less-common applications would make the solution more appealing given the target audience of the product.
The only issue that we have had with New Relic is that the price might be a little expensive for smaller companies. The amount of data you store in New Relic impacts the cost, and can get away from you if you don't work closely with the vendor. Overall though the application is top notch.
We are heavily invested in Solarwinds products for a reason. They are generally easy to setup and run with, requiring only some interfacing with support or help articles on rare occasions. They do what we bought them to do and we can't ask for more.
As an engineer, New Relic has been very quick and easy for me to pick up/install/use. It has been less easy for some of the less technical-minded folks in our organization and their UI still is inconsistent multiple years after refactoring their platform to be New Relic One.
SolarWinds Server & Application Monitor is quite easy to use and super versatile. It allows you to do just about anything you can through premade templates or through scripting. You can use an agent on the servers if you want to, or you can monitor through WMI or SNMP credentials. You can customize thresholds for alerting quickly, and you can configure alerts to be as complex or as simple as you want.
The graphical interface and the performance of the database leave a little to be desired, they could be better explored.Some functionality and screens do not work well depending on the browser used. The integrations never had any problems or caused crashes in other systems.
There are times I feel that the initial support is lacking. And in some cases the automated responses of not hearing anything are annoying if the reason why there has been no movement is because we are still waiting to hear back from NR support. So, i think they should loose the automation as it can seem disingenuous
I think there was only a couple times I had to open a support case for SAM and one time they got multiple engineers on the phone to get a better idea what I was trying to monitor and was able to point me in the best direction to monitor that system.
It's better to start by implementing New Relic in one project and test everything. Try to follow best recommended practices and read all the official documentation. Everything seems well tested. Then, start by installing agents to the rest of your projects and keep a close look to all logs and metrics New Relic gives you.
New Relic is the most full-featured offering that we've found, and is incredibly easy to start using with a PHP app. The New Relic agent is installed as a PHP extension so it is able to monitor and track the performance of any PHP app being run by the web server. Other tools required the installation and setup of a PHP dependency at the application level.
It has been a while since we first purchased SolarWinds, but I looked over several other products that I can't remember now. Many other products tried to scan the network to find computers but given that our computers are located in various places across campus with other computers in our buildings that are not ours that type of network scanning was not what we needed. Other services have extra services that we had no need of and I liked the ability to add custom fields in SolarWinds so we can track the information on each computer that we need to know.
Less time spent investigating causes of issues. We are alerted straight away and can find the root cause of the issue in less time.
We have been able to ditch all our previous individual monitoring solutions, none of which integrated with each other for a single solution which fully integrates with each of the different modules to provide a single portal for monitoring and alerting.