GraphPad Prism vs. Jet Reports
GraphPad Prism vs. Jet Reports
| Product | Rating | Most Used By | Product Summary | Starting Price |
|---|---|---|---|---|
 GraphPad Prism | N/A | Prism, from Dotmatics since the company's acquisition of original developer GraphPad in 2017, is an analysis and graphing solution purpose-built for scientific research. Prism is specifically formatted for scientific analyses, including analysis of quantitative and categorical data. This also makes it easier to enter data correctly, choose suitable analyses, and create graphs or other visualizations. | $380 per year | |
 Jet Reports | N/A | Jet Reports is a business intelligence software now offered by insightsoftware, inc since the company's 2019 acquisition of Jet Global Data Technologies. | N/A |
| GraphPad Prism | Jet Reports | |||||||||||||||
|---|---|---|---|---|---|---|---|---|---|---|---|---|---|---|---|---|
| Editions & Modules |
| No answers on this topic | ||||||||||||||
| Offerings |
| |||||||||||||||
| Entry-level Setup Fee | No setup fee | No setup fee | ||||||||||||||
| Additional Details | — | — | ||||||||||||||
| More Pricing Information | ||||||||||||||||
| GraphPad Prism | Jet Reports | |
|---|---|---|
| Top Pros |
| |
| Top Cons |
|
|
| GraphPad Prism | Jet Reports | |||||||||||||||||||||
|---|---|---|---|---|---|---|---|---|---|---|---|---|---|---|---|---|---|---|---|---|---|---|
| BI Standard Reporting |
| |||||||||||||||||||||
| Ad-hoc Reporting |
| |||||||||||||||||||||
| Report Output and Scheduling |
| |||||||||||||||||||||
| Data Discovery and Visualization |
| |||||||||||||||||||||
| Access Control and Security |
| |||||||||||||||||||||
| Mobile Capabilities |
| |||||||||||||||||||||
| Application Program Interfaces (APIs) / Embedding |
|
| GraphPad Prism | Jet Reports | |
|---|---|---|
| Small Businesses |  IBM SPSS Modeler Score 7.8 out of 10 |  BrightGauge Score 9.0 out of 10 |
| Medium-sized Companies |  Mathematica Score 8.2 out of 10 |  Reveal Score 9.9 out of 10 |
| Enterprises | IBM SPSS Modeler Score 7.8 out of 10 |  Jaspersoft Community Edition Score 9.7 out of 10 |
| All Alternatives | View all alternatives | View all alternatives |
| GraphPad Prism | Jet Reports | |
|---|---|---|
| Likelihood to Recommend | 10.0 (1 ratings) | 7.0 (5 ratings) |
| Usability | - (0 ratings) | 6.0 (1 ratings) |
| Support Rating | - (0 ratings) | 5.0 (1 ratings) |
| GraphPad Prism | Jet Reports | |
|---|---|---|
| Likelihood to Recommend | Dotmatics
 Luiz Alexandre Viana Magno Postdoctoral Research Scientist | Insightsoftware, Inc
 Grant Nelson, CPA Accounting Manager |
| Pros | Dotmatics
Luiz Alexandre Viana Magno Postdoctoral Research Scientist | Insightsoftware, Inc
 Ojas Korde Digital Paid Media Strategist |
| Cons | Dotmatics
Luiz Alexandre Viana Magno Postdoctoral Research Scientist | Insightsoftware, Inc
|
| Usability | Dotmatics No answers on this topic | Insightsoftware, Inc
Ojas Korde Digital Paid Media Strategist |
| Support Rating | Dotmatics No answers on this topic | Insightsoftware, Inc
Ojas Korde Digital Paid Media Strategist |
| Alternatives Considered | Dotmatics
Luiz Alexandre Viana Magno Postdoctoral Research Scientist | Insightsoftware, Inc
 Matt Scamardo, CSM Consulting Solutions Analyst |
| Return on Investment | Dotmatics
Luiz Alexandre Viana Magno Postdoctoral Research Scientist | Insightsoftware, Inc
Ojas Korde Digital Paid Media Strategist |
| ScreenShots | Jet Reports Screenshots 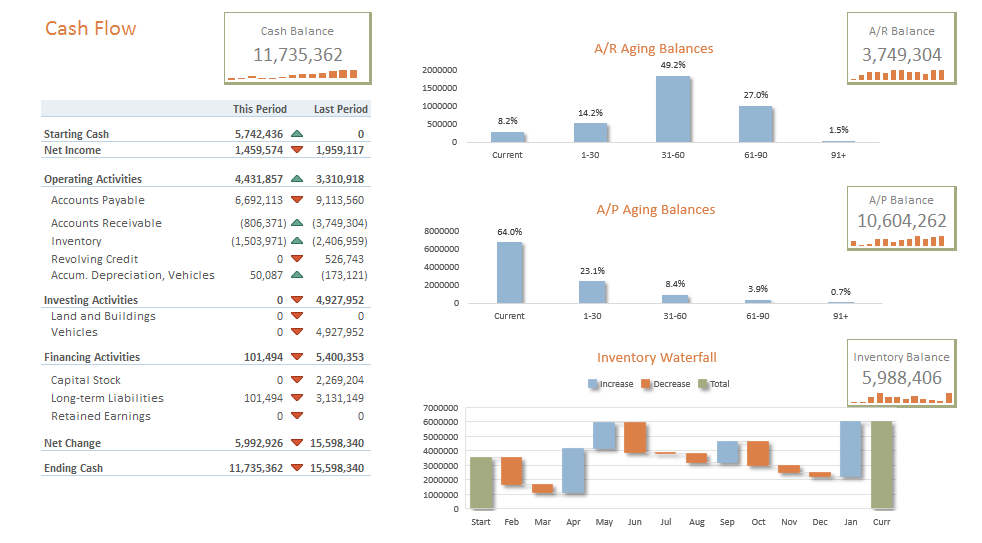     |