iDashboards Enterprise Suite vs. SAS Visual Analytics

Overview
ProductRatingMost Used ByProduct SummaryStarting Price
iDashboards Enterprise Suite
Score 3.0 out of 10
N/A
This web-based dashboard software displays data in real-time from databases, data warehouses, spreadsheets, XML and other data sources in a single location. iDashboards' built-in security framework provides role-based user permissions and access control. iDashboards Enterprise Suite is complete with software to custom build dashboards, perform what-if analytics, enable alerts and generate reports based on the displayed data in a dashboard.
$0
Per Seat per Month
SAS Visual Analytics
Score 8.2 out of 10
Enterprise companies (1,001+ employees)
SAS Visual Analytics provides a complete platform for analytics visualization, enabling users to identify patterns and relationships in data that weren't initially evident. Interactive, self-service BI and reporting capabilities are combined with out-of-the-box advanced analytics so everyone can discover insights from any size and type of data, including text.
$0
Annual By Users: 5, 10, 20
Pricing
iDashboards Enterprise SuiteSAS Visual Analytics
Editions & Modules
Enterprise Suite
Per Seat per Month
SAS Visual Analytics for SAS Cloud
Annual By Users: 5, 10, 20
Offerings
Pricing Offerings
iDashboards Enterprise SuiteSAS Visual Analytics
Free Trial
YesYes
Free/Freemium Version
YesNo
Premium Consulting/Integration Services
YesYes
Entry-level Setup FeeRequiredNo setup fee
Additional Details—SAS Visual Statistics and SAS Office Analytics are also available as add-ons.
More Pricing Information
Community Pulse
iDashboards Enterprise SuiteSAS Visual Analytics
Top Pros
Top Cons
Features
iDashboards Enterprise SuiteSAS Visual Analytics
BI Standard Reporting
Comparison of BI Standard Reporting features of Product A and Product B
iDashboards Enterprise Suite
6.8
4 Ratings
18% below category average
SAS Visual Analytics
8.3
12 Ratings
2% above category average
Pixel Perfect reports5.34 Ratings8.012 Ratings
Customizable dashboards9.04 Ratings8.012 Ratings
Report Formatting Templates6.13 Ratings9.011 Ratings
Ad-hoc Reporting
Comparison of Ad-hoc Reporting features of Product A and Product B
iDashboards Enterprise Suite
7.2
4 Ratings
11% below category average
SAS Visual Analytics
8.8
13 Ratings
9% above category average
Drill-down analysis8.14 Ratings9.013 Ratings
Formatting capabilities6.24 Ratings8.013 Ratings
Integration with R or other statistical packages9.11 Ratings8.011 Ratings
Report sharing and collaboration5.34 Ratings10.012 Ratings
Report Output and Scheduling
Comparison of Report Output and Scheduling features of Product A and Product B
iDashboards Enterprise Suite
9.1
3 Ratings
9% above category average
SAS Visual Analytics
9.2
13 Ratings
10% above category average
Publish to Web9.12 Ratings9.012 Ratings
Publish to PDF9.13 Ratings9.013 Ratings
Report Versioning9.11 Ratings9.010 Ratings
Report Delivery Scheduling9.12 Ratings10.012 Ratings
Delivery to Remote Servers00 Ratings9.07 Ratings
Data Discovery and Visualization
Comparison of Data Discovery and Visualization features of Product A and Product B
iDashboards Enterprise Suite
6.8
4 Ratings
17% below category average
SAS Visual Analytics
9.7
11 Ratings
19% above category average
Pre-built visualization formats (heatmaps, scatter plots etc.)6.24 Ratings10.010 Ratings
Location Analytics / Geographic Visualization7.24 Ratings10.011 Ratings
Predictive Analytics6.92 Ratings9.010 Ratings
Access Control and Security
Comparison of Access Control and Security features of Product A and Product B
iDashboards Enterprise Suite
7.8
4 Ratings
9% below category average
SAS Visual Analytics
8.3
12 Ratings
3% below category average
Multi-User Support (named login)8.14 Ratings9.012 Ratings
Role-Based Security Model7.24 Ratings8.011 Ratings
Multiple Access Permission Levels (Create, Read, Delete)8.14 Ratings8.012 Ratings
Single Sign-On (SSO)8.01 Ratings8.08 Ratings
Mobile Capabilities
Comparison of Mobile Capabilities features of Product A and Product B
iDashboards Enterprise Suite
8.5
3 Ratings
7% above category average
SAS Visual Analytics
8.3
10 Ratings
5% above category average
Responsive Design for Web Access9.13 Ratings10.010 Ratings
Mobile Application9.11 Ratings9.08 Ratings
Dashboard / Report / Visualization Interactivity on Mobile6.83 Ratings9.09 Ratings
Application Program Interfaces (APIs) / Embedding
Comparison of Application Program Interfaces (APIs) / Embedding features of Product A and Product B
iDashboards Enterprise Suite
-
Ratings
SAS Visual Analytics
9.2
6 Ratings
15% above category average
REST API00 Ratings10.05 Ratings
Javascript API00 Ratings9.05 Ratings
iFrames00 Ratings9.05 Ratings
Java API00 Ratings9.05 Ratings
Themeable User Interface (UI)00 Ratings9.05 Ratings
Customizable Platform (Open Source)00 Ratings9.03 Ratings
Best Alternatives
iDashboards Enterprise SuiteSAS Visual Analytics
Small Businesses
BrightGauge
BrightGauge
Score 9.0 out of 10
BrightGauge
BrightGauge
Score 9.0 out of 10
Medium-sized Companies
Reveal
Reveal
Score 9.9 out of 10
Reveal
Reveal
Score 9.9 out of 10
Enterprises
Jaspersoft Community Edition
Score 9.7 out of 10
Jaspersoft Community Edition
Score 9.7 out of 10
All AlternativesView all alternativesView all alternatives
User Ratings
iDashboards Enterprise SuiteSAS Visual Analytics
Likelihood to Recommend
6.0
(10 ratings)
9.0
(18 ratings)
Likelihood to Renew
8.6
(6 ratings)
9.3
(3 ratings)
Usability
9.0
(2 ratings)
6.0
(1 ratings)
Support Rating
-
(0 ratings)
8.0
(3 ratings)
User Testimonials
iDashboards Enterprise SuiteSAS Visual Analytics
Likelihood to Recommend
iDashboards
iDashboards is well suited for an office environment or organization with fewer personnel and resources. Its efficiency allows for less "man" hours. In terms of selection, the primary key question during process was cost, great tech support service, and efficiency. About where it may be less appropriate, it will be an office where information production, consumption, and dissemination is not a priority
Read full review
SAS
I was in a meeting with the client and there I have to show them some analytic data to them. But I was confused about how I will manage to show big data to clients with accuracy. But then the SAS Visual Analytics software helps me in presenting accurate data at the moment and it was very presentable and through that, I got the deal for that business.
Read full review
Pros
iDashboards
  • Designing a dashboard is easy. In other words, it is fairly easy to make data look really nice!
  • Data Analytics. This makes it easy to do calculations on your data (averages, etc.)
  • Training and examples: Our introduction to iDashboards was thorough. There are plenty of tutorials as well, plus manuals.
Read full review
SAS
  • Provides the flexibility to the end user to slice and dice the data.
  • Anyone can make predictive models with the help of in-built algorithms without the need to write a single line of code or knowledge of what's under the hood of algorithms.
  • The feature to simply ask a question related to data and getting a response in form of text, chart or graph is amazing.
Read full review
Cons
iDashboards
  • Provide basic video training tutorials
  • Ability to upload/convert Excel data to non-Windows servers such as Linux or AIX
  • Increase the data row limitation
Read full review
SAS
  • SAS is relatively expensive when compared to other BI tools and requires a large amount of upfront fee which becomes an issue for smaller organizations.
  • UI for the dashboards looks a little date in comparison to competitors like Tableau and Microstrategy.
  • Integration with other open source software like Python needs to be built in.
Read full review
Likelihood to Renew
iDashboards
Our executive leadership relies on the dashboards provided through the iDashboards software. Thus, there is no doubt the contract will be renewed.
Read full review
SAS
SAS really is the cutting edge in Business Intelligence. That is all they do! They are constantly coming out with new products, product upgrades, and their tech support is second to none. In addition, their support of Education has made our ability to acquire their product possible.
Read full review
Usability
iDashboards
iDashboards are fairly logical and easy to use once you get started. I have taught myself most of what I know on my own, by taking webinars, reading through all the knowledge base, and doing the tutorials. Expertise is needed to do some of the data manipulation, but most graphs are simple to make.
Read full review
SAS
SAS BI is good for creating reports and dashboards and then sharing it with the users. It also has ability to manage access to the reports and dashboards but somehow with most of the world moving to open source languages R, Python and Julia, SAS BI feels to be archaic in terms of feature set and integrations it allow[s]. Also, comparing it with other Business Intelligence tools like Tableau and Microsoft BI, the functionality of SAS BI is very limited and doesn't justify the pricing.
Read full review
Support Rating
iDashboards
No answers on this topic
SAS
When you call tech support, you are immediately routed to a person who can answer your question. Often they can answer on the spot. However, if they cannot, you are given a track number and then followed up with. There have been times when I have had multiple track numbers open and they will actually TRACK YOU DOWN to ensure that your problem has been resolved. Issues do not fall into black holes with SAS. They are also willing to do a WebEx with you to diagnose the problem by seeing your environment, which is always helpful.
Read full review
Alternatives Considered
iDashboards
iDashboards is easy to use right out of the box. The price point is very, very appealing and it offers everything the other products offer - ease of use and low cost.
Read full review
SAS
SAS Business Intelligence is not the cream of the crop for business intelligence applications, but it is not far behind. The software is generally easier to apply than most other business intelligence software. Additionally, SAS Business Intelligence runs smoothly in the background when making real-time updates. With that said, the software is not as efficient of many of the other business intelligence software applications that have been on the market for longer than this one.
Read full review
Return on Investment
iDashboards
  • iDashboards saved us from making a sizable investment in another HR dashboard
  • iDashboards has improved the patient flow metrics
  • Multiple FTEs have been repurposed as a result of automating the visualization and dissemination of data
Read full review
SAS
  • SAS Visual Analytics licensing cost should be reduced to enable users to use it in mass scale.
  • More statistical and mathematical equations and theories should be converted into SAS functions for reusing.
  • Because of enriched ETL and reporting capabilities SAS Visual Analytics is most preferred by business users.
Read full review
ScreenShots

iDashboards Enterprise Suite Screenshots

Screenshot of Government DashboardScreenshot of

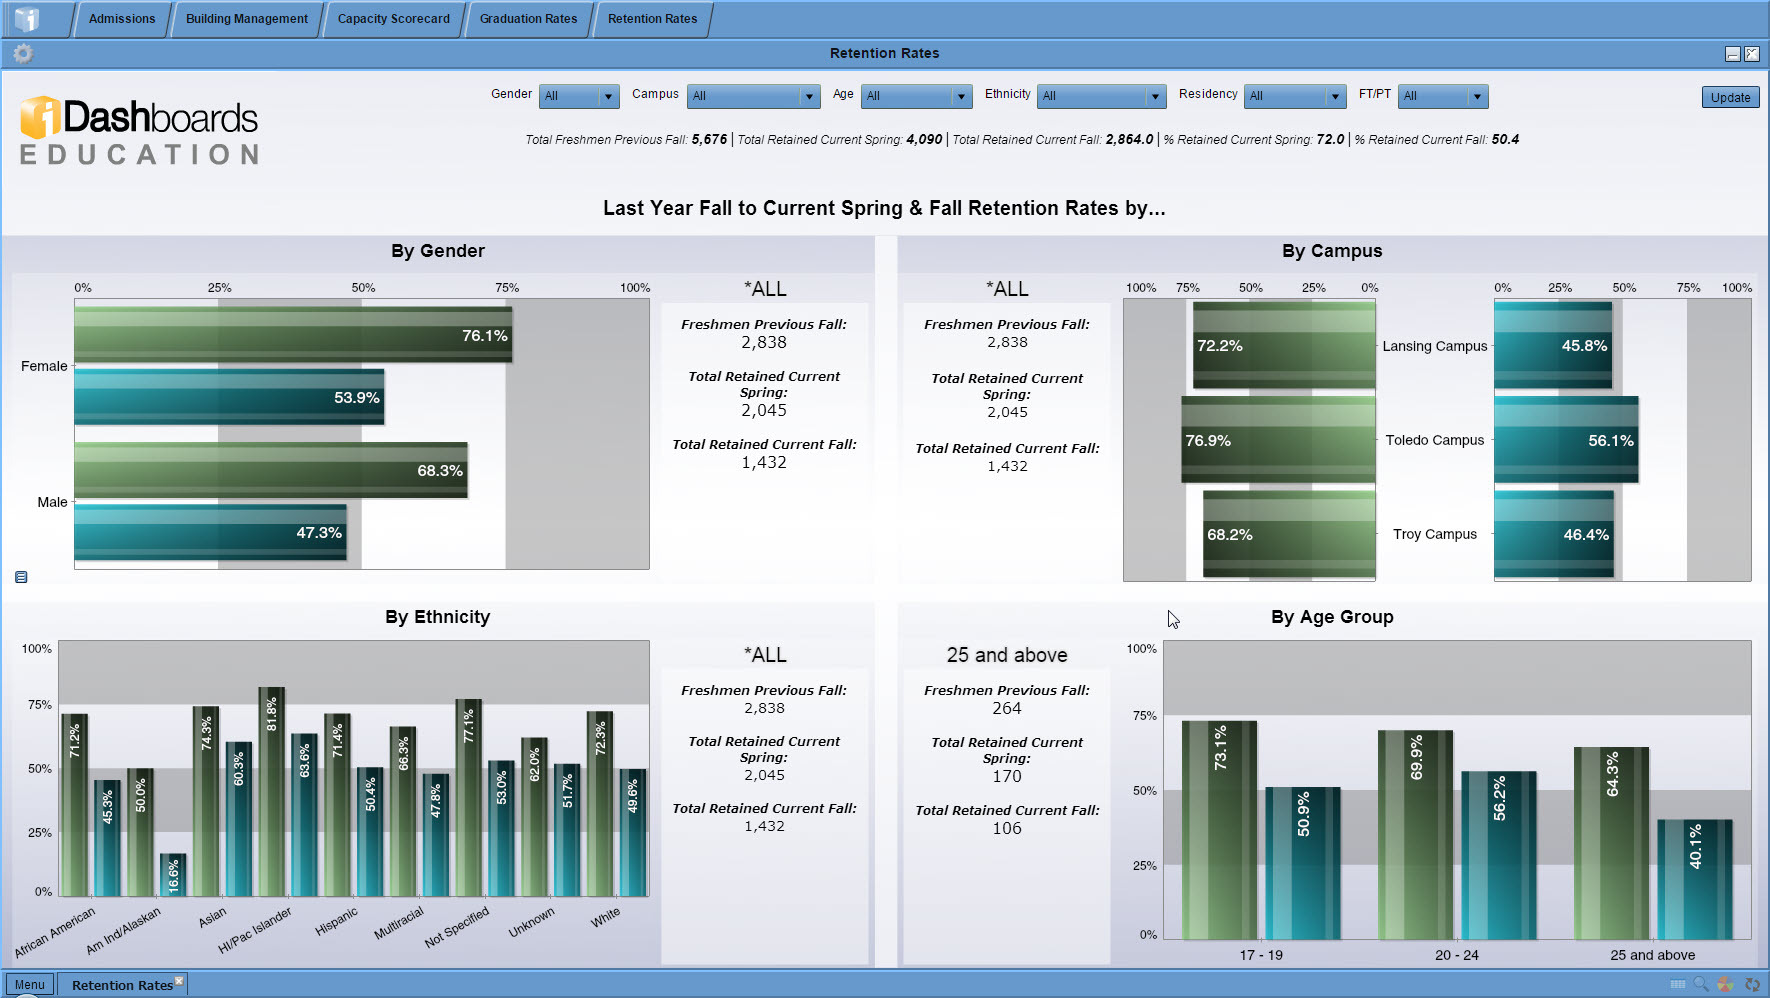
SAS Visual Analytics Screenshots

Screenshot of Explore your data using analytics and interactive data visualizations.