
Ricardo Melo
Network Analyst
Chose Zabbix
Zabbix was adopted in our framework due to the value, the hardware requirements, the knowledge we had available and the vast documentation on the internet.
| Product | Rating | Most Used By | Product Summary | Starting Price |
|---|---|---|---|---|
 Progress WhatsUp Gold | Mid-Size Companies (51-1,000 employees) | WhatsUp Gold developed by Ipswitch (acquired by Progress Software May 2019) offers network performance monitoring and mapping. It supports core monitoring features, including automated workflows and network capacity planning, and monitors across hybrid environments. | N/A | |
 Zabbix | N/A | Zabbix is an open-source network performance monitoring software. It includes prebuilt official and community-developed templates for integrating with networks, applications, and endpoints, and can automate some monitoring processes. | N/A |
| Progress WhatsUp Gold | Zabbix | |||||||||||||||
|---|---|---|---|---|---|---|---|---|---|---|---|---|---|---|---|---|
| Editions & Modules | No answers on this topic | No answers on this topic | ||||||||||||||
| Offerings |
| |||||||||||||||
| Entry-level Setup Fee | Optional | No setup fee | ||||||||||||||
| Additional Details | — | — | ||||||||||||||
| More Pricing Information | ||||||||||||||||
| Progress WhatsUp Gold | Zabbix | |
|---|---|---|
| Considered Both Products |  Progress WhatsUp Gold No answer on this topic |  Zabbix Ricardo Melo Network Analyst Chose Zabbix Zabbix was adopted in our framework due to the value, the hardware requirements, the knowledge we had available and the vast documentation on the internet.  Thomas Higgins Infrastructure Engineer Chose Zabbix Most of the SolarWinds are separated out, whereas Zabbix includes templates and capabilities for all of them out of the box. Other solutions listed include most or all of them to varying degrees as well. New Relic is more for Application Monitoring, but the New Relic … |
| Top Pros | ||
| Top Cons |
|
|
| Progress WhatsUp Gold | Zabbix | |
|---|---|---|
| Small Businesses |  NinjaOne Score 9.2 out of 10 |  Veeam ONE Score 8.5 out of 10 |
| Medium-sized Companies |  Intermapper Score 8.5 out of 10 |  IBM Instana Score 8.9 out of 10 |
| Enterprises |  Cisco Prime LAN Management (discontinued) Score 7.7 out of 10 | IBM Instana Score 8.9 out of 10 |
| All Alternatives | View all alternatives | View all alternatives |
| Progress WhatsUp Gold | Zabbix | |
|---|---|---|
| Likelihood to Recommend | 8.3 (13 ratings) | 9.0 (25 ratings) |
| Likelihood to Renew | - (0 ratings) | 9.0 (3 ratings) |
| Usability | - (0 ratings) | 6.0 (1 ratings) |
| Support Rating | 4.2 (2 ratings) | 5.0 (5 ratings) |
| Implementation Rating | - (0 ratings) | 8.0 (2 ratings) |
| Progress WhatsUp Gold | Zabbix | |
|---|---|---|
| Likelihood to Recommend | Progress Software Corporation
| Zabbix
 Asad Khan Technical CARE Specialist |
| Pros | Progress Software Corporation
| Zabbix
Thomas Higgins Infrastructure Engineer |
| Cons | Progress Software Corporation
 Victor Adebayo IT Support Executive | Zabbix
|
| Likelihood to Renew | Progress Software Corporation No answers on this topic | Zabbix
Thomas Higgins Infrastructure Engineer |
| Usability | Progress Software Corporation No answers on this topic | Zabbix
|
| Support Rating | Progress Software Corporation
 John Glenn Network Operations Manager | Zabbix
|
| Implementation Rating | Progress Software Corporation No answers on this topic | Zabbix
Thomas Higgins Infrastructure Engineer |
| Alternatives Considered | Progress Software Corporation
 Joshua Van Camp Network Administration Supervisor | Zabbix
|
| Return on Investment | Progress Software Corporation
 Gary Lamontagne Network and Systems Administrator | Zabbix
 Eric O'Callaghan Linux Engineer |
| ScreenShots | Progress WhatsUp Gold Screenshots  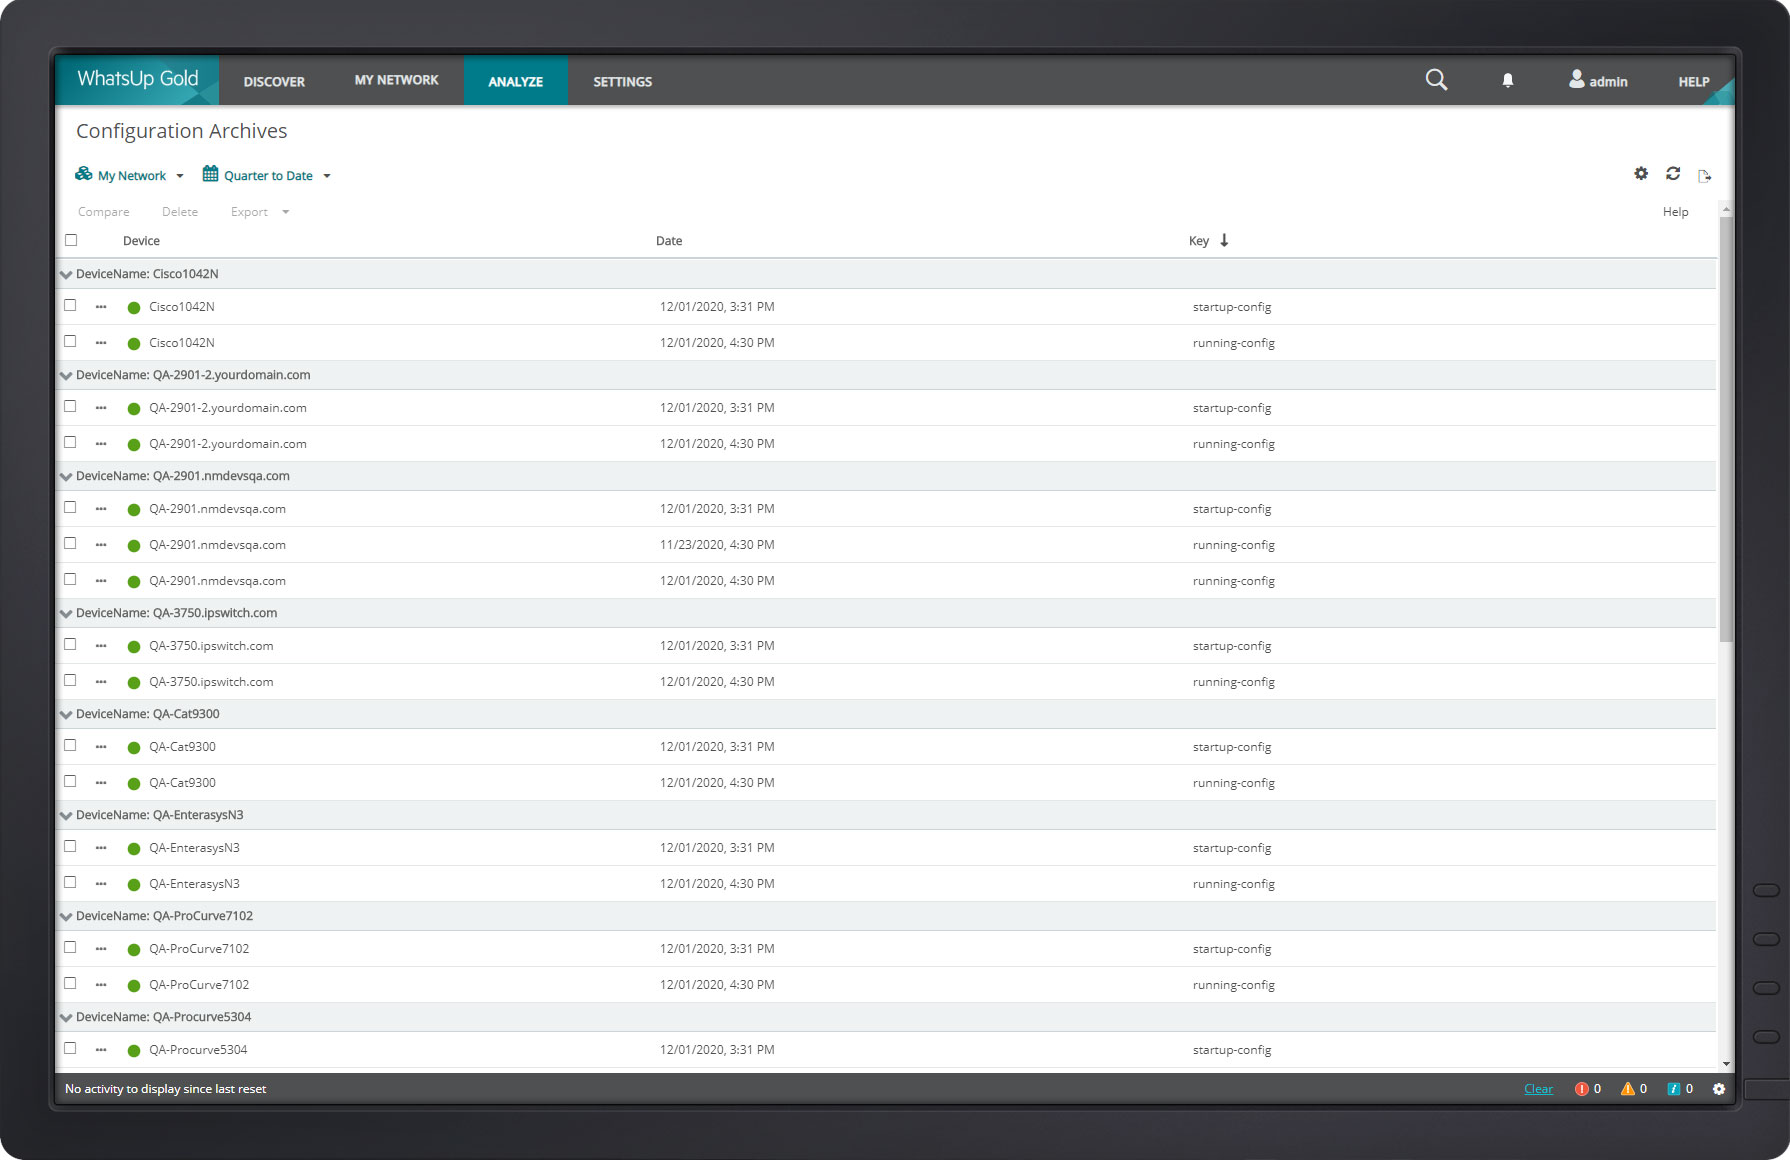  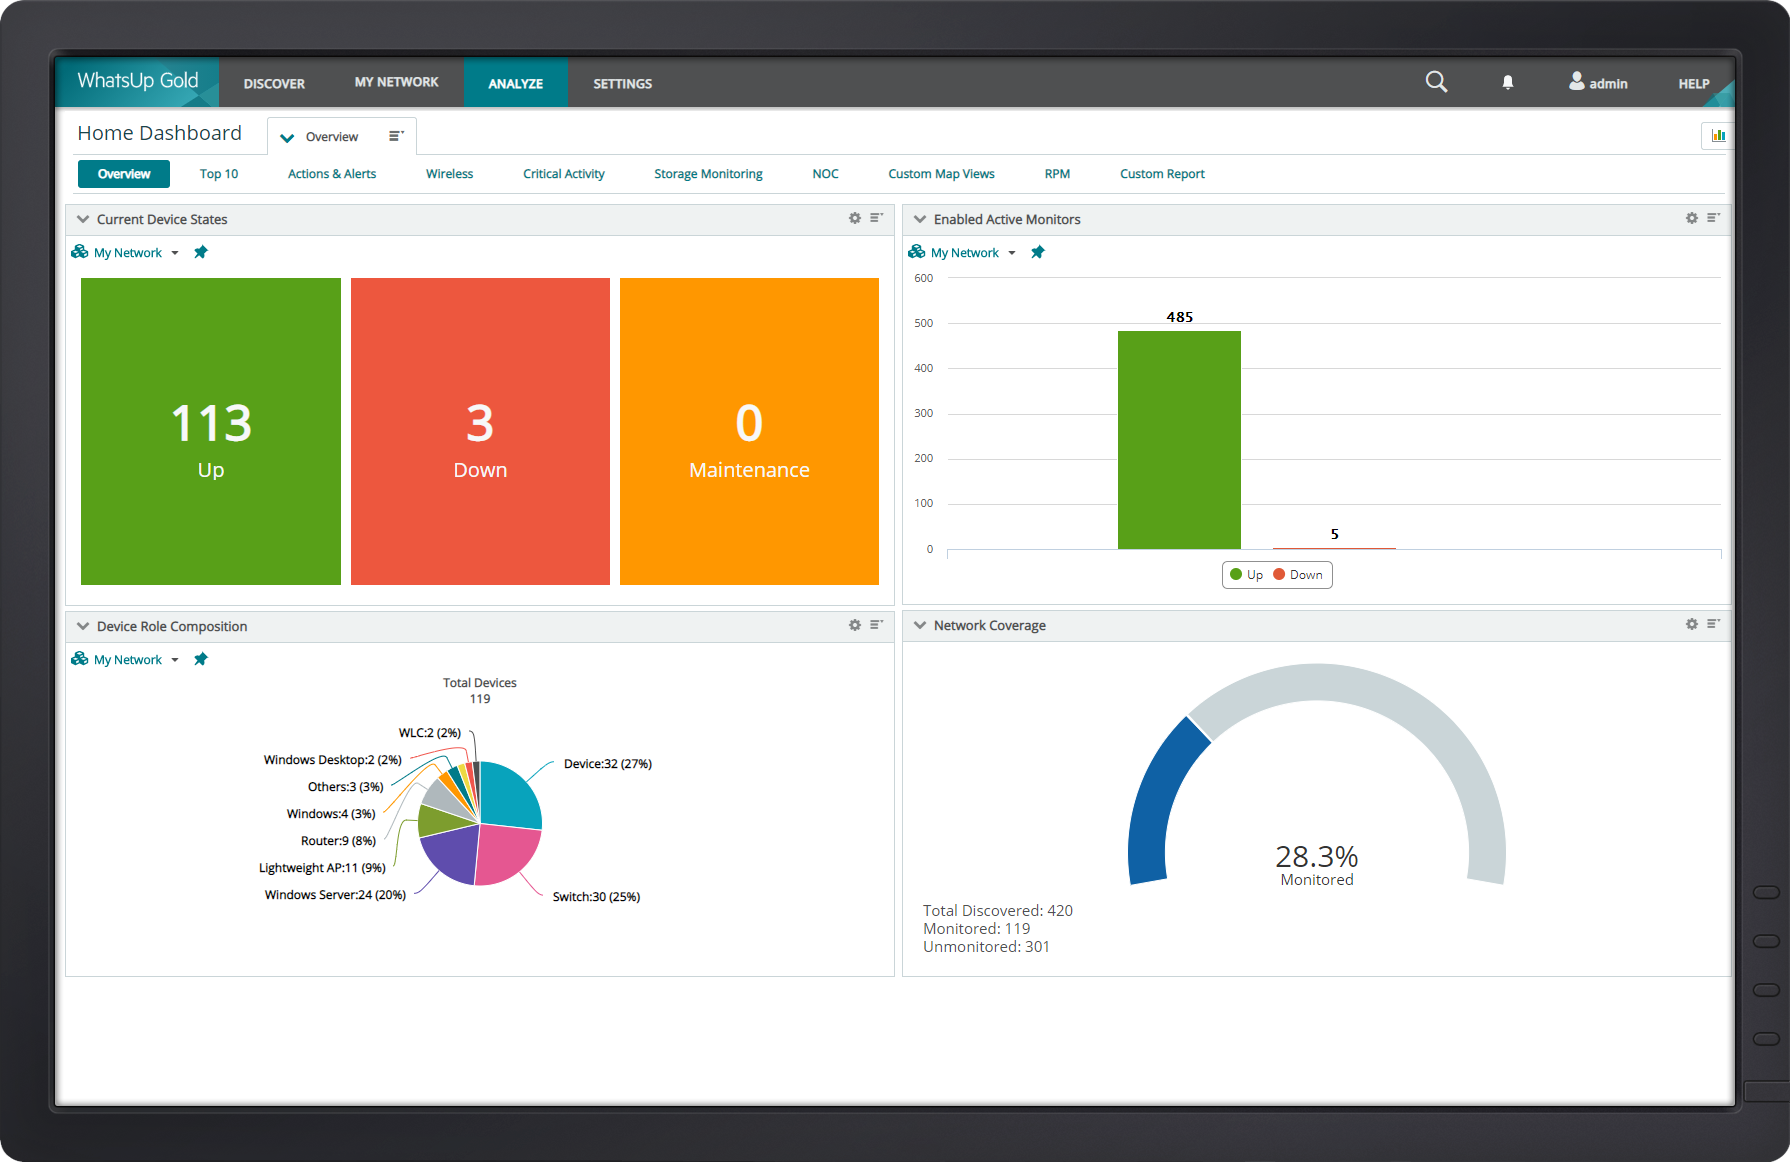  |