The Complete Guide to A/B Testing & False Positives
Whether you’re a digital marketer, a savvy entrepreneur, or a website owner trying to boost your site’s conversions, there’s no doubt A/B testing has at one point been a high priority. And if terms like “statistical confidence” or “test variants” leave you feeling confused, it’s time to put yourself on a path towards clarity, and confidence. In this article, we’ve broken down the different parts to A/B testing and the key components to look out for. This information will help you take tactical steps towards improving conversion rates, and ultimately, your bottom line. Now doesn’t that sound like a nice change of pace?
The first step in conversion rate optimization (CRO) is to conduct a website analysis to understand how users flow through a site. This is done by identifying where users get stuck on a page, and where they are leaving the site. This analysis is usually done with a variety of tools, including Google Analytics, heat maps, and surveys.
Once it is determined what pages and elements on the website need to be optimized, new design elements are created and A/B tested. Examples of design elements include modifying the size of a call-to-action (CTA) button or changing the copy of a landing page. A/B testing then splits the traffic between the current site page (page A) and a variation of that page (Page B). The goals are the same on page A and page B, such as making a purchase, filling out a form and going to the thank you page. This testing process does not affect the code on the site, with the exception of adding a script to split the traffic.
After new design elements or text changes are shown to statistically increase the conversion rate, the winning design is added to the page by the webmaster of the site, concluding the A/B test.
During the A/B testing phase of the conversion rate optimization process, you may wonder if it is possible for a false positive to appear. In other words, the A/B test contained an error where a specific condition was tested and discovered, but it really didn’t exist.
The answer to this is a firm: yes. If you want to avoid a false positive A/B test, you need a good understanding of the entire testing process.
Why Does My A/B Test Conversion Rate Spike at the Beginning of the Test?
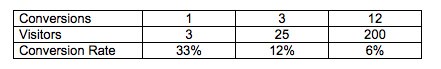
When running an A/B test, the conversion rate is always higher at the beginning of the test because the denominator is low. After some time has passed, the conversion rate will flatten out and become more accurate. In the chart below, you can see an example of how the process works.
Here is another example. In the graphic below, the orange line is the control. If you look at the pink line, you see a huge spike followed by a leveled off line that more closely follows the orange control line. For this reason, an A/B test must run for at least 7 days to get an accurate reflection of the conversion rate.
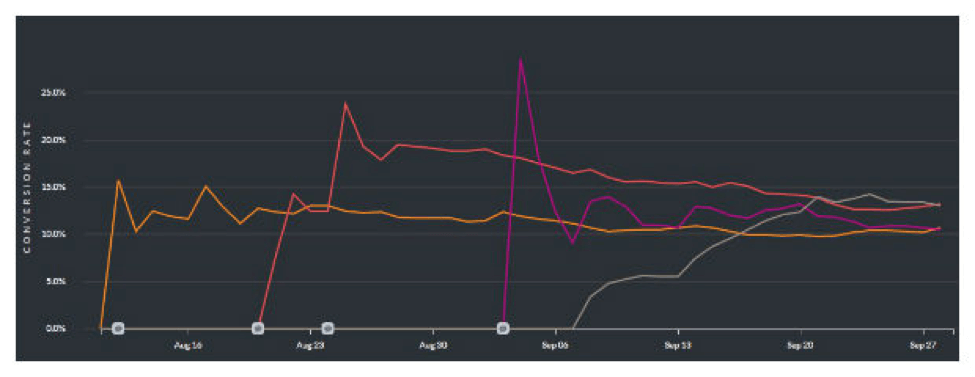
Another reason to run the A/B test for at least 7 days is because website traffic always fluctuates over time. The fluctuation can be caused by any of these factors:
- Type of Visitor – Some website visitors have specific times of day or days of the week when they use the web. For example, there are weekend users, early morning weekday users, lunchtime users, and late-night weekday users.
- Change in Advertising – Ad placement changes on a regular basis. You cannot control when and where an ad is displayed. It’s very common to see a spike in ad traffic that comes from a source with different types of users. The A/B test must run long enough to capture every type of user.
- Different Devices – A mobile user may be online at a different time of day than a desktop user. The A/B test needs time to collect enough data from all device types in order to correctly compare mobile vs desktop website variations.
An A/B test should run at least 7 days in order to produce a statistically accurate outcome that shows a positive lift.
But What If I Need Answers to My A/B Test Right Now?
Speeding up the process in an A/B test may be desired, especially if you need an immediate answer. However, you must be patient because shortcutting the process will not lend itself to statistically accurate test results. If you want to speed up the test, you can remove poorly performing variations to allow more traffic to the other variations. This will allow you to reach statistical confidence faster.
In this example of conversion rate over time, which variation could be prematurely stopped?
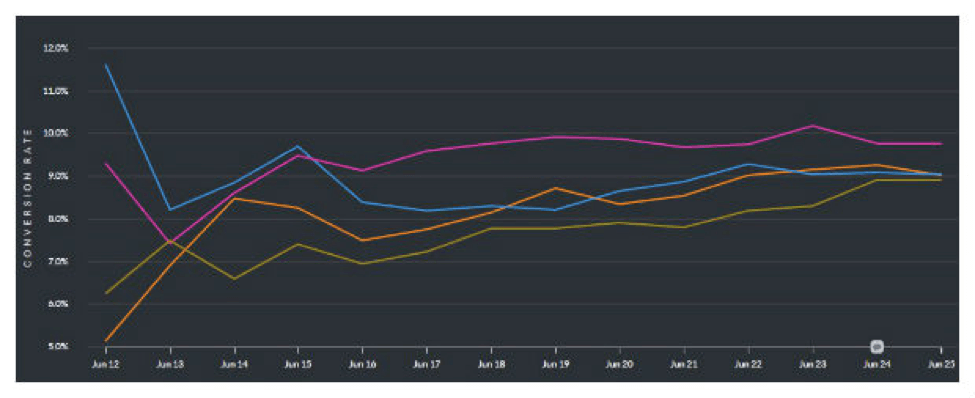
The orange line is the control. The blue line has a good lift in the beginning, but then it levels off to be equal to the control. This A/B test could be stopped early because the blue line is not providing any significant lift over time. Also consider there could be a negative outcome, even though the initial results were positive. The pink line is above the control during the entire test, which indicates it’s a solid A/B test. If this test were ended early, the lift would not be as accurate, even though it is a positive lift. The dark yellow line is a negative result that stayed negative throughout the entire test. In this case, the test could be terminated early. Typically, a good A/B test will show a positive result or a consistent change against the control.
All web pages have conversion differences over time because of the type of traffic and type of user. Try an A/A test and track the conversions over time. The difference between the two A/A test results will decrease over time. The length of time to run both A/A versions to get the same conversion rate indicates the minimum test time. This process also reveals the lowest conversion lift that you can accurately declare. For example, if the deviation is always 1%, then all of your A/B tests must have a lift that is higher than 1% to be statistically accurate.
A/B Testing Tips and Tricks
- A/B tests should be run until they reach at least 90% statistical confidence. Keep in mind that different A/B testing programs use different algorithms and may show a different outcome. There is a variance when comparing the test data between two different testing systems, but if you are always testing to 90% statistical confidence, then it’s ok. [vcex_spacing size=”30px”]
- A/B tests should be run for at least 7 days, even if a statistical winner is revealed earlier than 7 days. Remember that advertising, the type of user and the type of device always affect the test result. It also depends on the volume of traffic and how many conversions you get. A website that has several thousand visitors per month is a good page to use for an A/B test. Make sure you look at the cumulative conversion rate in all the test variants when comparing them to the control. You want to see if the outcomes are consistently above or below the control. [vcex_spacing size=”30px”]
- If your A/B test result is constantly above the control, it’s most likely a solid lift in the conversion rate. [vcex_spacing size=”30px”]
- If your A/B test result crisscrosses the control, the test is not complete, it needs more time, and it’s not statistically accurate. [vcex_spacing size=”30px”]
- If your A/B test result is below the control, it is most likely a negative lift. In this case, the test can be terminated early to speed up the testing process. [vcex_spacing size=”30px”]
- Remember to look at the device data. It is possible for devices to cancel out each other’s test result. If a desktop A/B test result is positive but the mobile test result is negative, it makes a null total conversion lift. If this happens, it’s a good idea to conduct separate A/B tests, one for desktop and one for mobile. [vcex_spacing size=”30px”]
- Look at the calendar before starting an A/B test. There are many factors that can skew the results of an A/B test. For example, if you begin a test during the holidays, the ad campaigns are different, the users are different, and the overall traffic is different. These factors will affect the outcome of your A/B test. [vcex_spacing size=”30px”]
- Try an A/A test in order to determine the length of time needed to run an A/B test. This will also give you a baseline for the minimum conversion lift. [vcex_spacing size=”30px”]
- If you are unsure whether to continue or stop an A/B test, always continue running the test, unless the results are very insignificant.
For more information about conversion rate optimization and A/B testing, or if you have any questions about A/B testing, please visit Ometrics.com.
Was this helpful?