TrustRadius: an HG Insights company

Save this comparison

Save this comparison

Add Product

Recommended Comparisons

    Overview
    ProductRatingMost Used ByProduct SummaryStarting Price

    Causal

    Score10 out of 10
    N/ACausal, from the company of the same name in London, presents a way to perform calculations, visualise data, and communicate with numbers. It helps build models faster, connect them directly to data, and share them with interactive dashboards and visuals. Suggested use cases are financial planning, planning CPC campaigns, track KPIs, or determine employee compensation.

    $50

    per month

    Powerslide

    Score9.5 out of 10
    N/ACreated in 2019, Powerslide is a data storytelling and data visualization solution. This software helps business users to create usages around data. Powerslide is a solution for data analysis, visualization and presentation. Interactive and collaborative, Powerslide aims to answer data issues in a simple, practical and design interface, and help users simplify the analysis and communication of…N/A
    Pricing
    CausalPowerslide
    Editions & Modules
    Pro
    $50
    per user, per month
    Business
    Contact Sales
    No answers on this topic
    Offerings
    Pricing Offerings
    CausalPowerslide
    Free Trial
    YesYes
    Free/Freemium Version
    YesNo
    Premium Consulting/Integration Services
    NoNo
    Entry-level Setup FeeNo setup feeOptional
    Additional Details—Our rates are flexible and adapt to the size and use of your organization. Contact us and let’s discuss about it.
    More Pricing Information
    Features
    CausalPowerslide
    BI Standard Reporting
    Comparison of BI Standard Reporting features of Causal and Powerslide
    Feature
    Causal
    9.3
    1 Ratings
    14% above category average
    Powerslide
    8.8
    2 Ratings
    9% above category average
    Pixel Perfect reports8.01 Ratings8.52 Ratings
    Customizable dashboards10.01 Ratings9.02 Ratings
    Report Formatting Templates10.01 Ratings9.02 Ratings
    Ad-hoc Reporting
    Comparison of Ad-hoc Reporting features of Causal and Powerslide
    Feature
    Causal
    8.3
    1 Ratings
    6% above category average
    Powerslide
    9.5
    2 Ratings
    19% above category average
    Drill-down analysis9.01 Ratings9.52 Ratings
    Formatting capabilities8.01 Ratings00 Ratings
    Report sharing and collaboration8.01 Ratings9.52 Ratings
    Report Output and Scheduling
    Comparison of Report Output and Scheduling features of Causal and Powerslide
    Feature
    Causal
    8.0
    1 Ratings
    2% below category average
    Powerslide
    9.2
    2 Ratings
    12% above category average
    Publish to Web8.01 Ratings9.02 Ratings
    Publish to PDF8.01 Ratings9.52 Ratings
    Report Versioning8.01 Ratings9.01 Ratings
    Report Delivery Scheduling8.01 Ratings00 Ratings
    Delivery to Remote Servers8.01 Ratings00 Ratings
    Data Discovery and Visualization
    Comparison of Data Discovery and Visualization features of Causal and Powerslide
    Feature
    Causal
    8.0
    1 Ratings
    3% above category average
    Powerslide
    9.0
    2 Ratings
    15% above category average
    Predictive Analytics8.01 Ratings00 Ratings
    Pattern Recognition and Data Mining8.01 Ratings00 Ratings
    Location Analytics / Geographic Visualization00 Ratings9.02 Ratings
    Best Alternatives
    CausalPowerslide
    Small Businesses
    Chartio (discontinued)
    Score7.5 out of 10
    Chartio (discontinued)
    Score7.5 out of 10
    Medium-sized Companies
    Jet Reports
    Score9.5 out of 10
    Jet Reports
    Score9.5 out of 10
    Enterprises
    Kibana
    Score8.4 out of 10
    Kibana
    Score8.4 out of 10
    All AlternativesView all alternativesView all alternatives
    User Ratings
    CausalPowerslide
    Likelihood to Recommend
    10.0
    (1 ratings)
    9.5
    (2 ratings)
    User Testimonials
    CausalPowerslide
    Likelihood to Recommend
    Causal, Inc
    Definitely suited best for B2B / B2B2C product modelling. We used this for B2B / B2B2C / C2C and the C2C side of things was always more complex to model out due to this being dependent on marketing spend (CAC) and factors around virality which really cannot be forecasted (not a shortcoming of Causal, just implied by the mechanics of modelling)
    Incentivized
    Read full review
    Datarocks
    It has allowed us as an organization to clearly deliver our numbers to our collaborators, but above all to the heads of our teams and company. Not being entirely professional, it is easy to use for someone who does not understand the function of these numbers or hard data.
    Incentivized
    Read full review
    Pros
    Causal, Inc
    No answers on this topic
    Datarocks
    • Collaborative fractures helped a lot.
    • Dashboards are really unique.
    Read full review
    Cons
    Causal, Inc
    No answers on this topic
    Datarocks
    • Increase the variety of fonts
    • Make templates less serious or business
    Incentivized
    Read full review
    Alternatives Considered
    Causal, Inc
    No answers on this topic
    Datarocks
    Powerslide stands out for having templates that help you easily organize hard data and more delicate information such as numbers and statistics. By having many ways to present and edit it in one place, it makes this a page with variety and empathy with its user.
    Incentivized
    Read full review
    Return on Investment
    Causal, Inc
    No answers on this topic
    Datarocks
    • Our collaborators do not get bored in meetings and even if it is a lot of information, seeing it in an interesting design makes them pay attention and like to be informed of the numbers they manage to obtain with their work.
    Incentivized
    Read full review
    ScreenShots

    Powerslide Screenshots

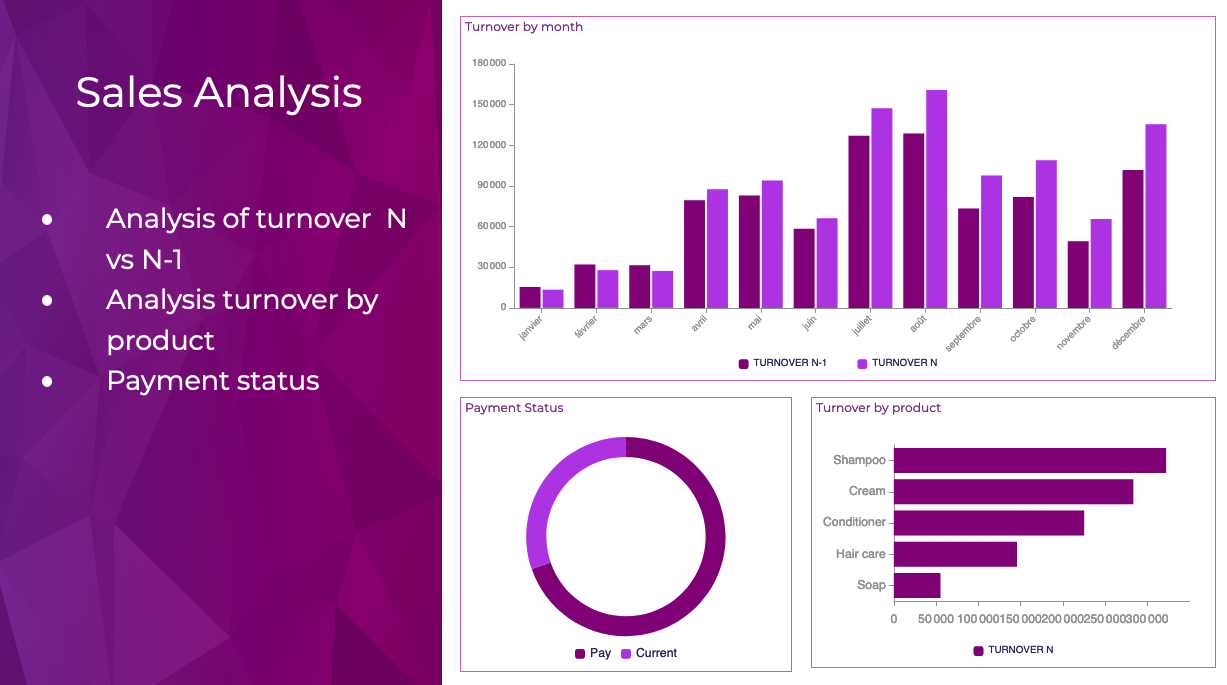
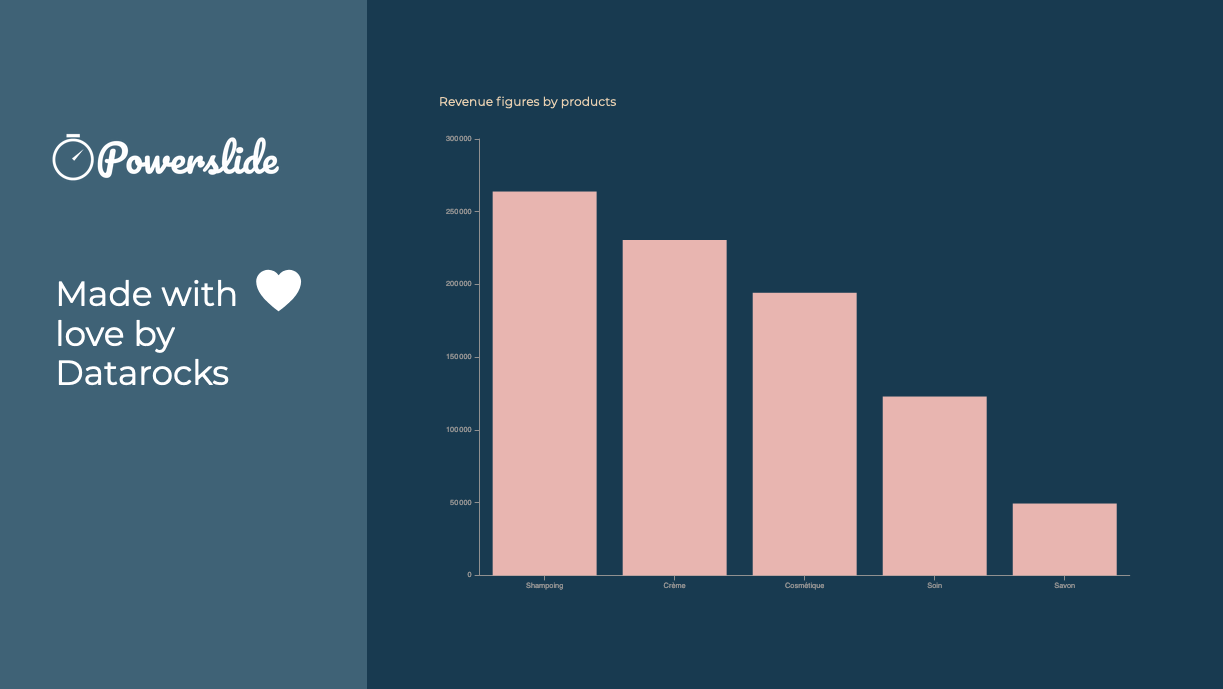
    Screenshot of Reporting and dashboards have never been easier to achieve. Interactive, Powerslide takes you to the heart of your data and helps you take better decisions. Simple to use, you can build your graphics in seconds with drag-and-drop and let our suggestion algorithms guide you.Screenshot of Powerslide complies to your graphic chart. Define your color palette and Powerslide takes care of the rest.Screenshot of Powerslide is THE solution provided with love by DatarocksScreenshot of Take advantage of real-time collaboration to work as a team on the same project. Time-saving and flexibility await you !