CloudBees DevOptics vs. Hatica
CloudBees DevOptics vs. Hatica
| Product | Rating | Most Used By | Product Summary | Starting Price |
|---|---|---|---|---|
 CloudBees DevOptics | N/A | DevOptics™ is a dev team's DevOps radar. It allows organizations to measure, analyze, and manage DevOps. DevOptics provides a comprehensive view of the status of the CD platform as well as software value streams, correlated from data collected across software delivery pipelines. It acts as a single source of truth to analyze and continually optimize the flow of value from idea to production. | N/A | |
 Hatica | N/A | Hatica equips engineering teams with work visibility dashboards, actionable insights and workflows to drive team productivity and engagement in remote and in-office environments alike. The vendor offers a free forever plan to help get started. Features: Engineering metrics dashboards 100+ metrics from 20+ apps including Github, Jira, Slack, Zoom, Google Workplace Remote work insights Aggregated work overview, sprint and retro… | N/A |
| CloudBees DevOptics | Hatica | |||||||||||||||
|---|---|---|---|---|---|---|---|---|---|---|---|---|---|---|---|---|
| Editions & Modules | No answers on this topic | No answers on this topic | ||||||||||||||
| Offerings |
| |||||||||||||||
| Entry-level Setup Fee | No setup fee | Optional | ||||||||||||||
| Additional Details | — | — | ||||||||||||||
| More Pricing Information | ||||||||||||||||
| CloudBees DevOptics | Hatica |
|---|
| CloudBees DevOptics | Hatica | |
|---|---|---|
| Small Businesses |  GitLab Score 8.8 out of 10 | GitLab Score 8.8 out of 10 |
| Medium-sized Companies | GitLab Score 8.8 out of 10 | GitLab Score 8.8 out of 10 |
| Enterprises | GitLab Score 8.8 out of 10 | GitLab Score 8.8 out of 10 |
| All Alternatives | View all alternatives | View all alternatives |
| CloudBees DevOptics | Hatica | |
|---|---|---|
| Likelihood to Recommend | - (0 ratings) | 9.4 (0 ratings) |
| CloudBees DevOptics | Hatica | |
|---|---|---|
| Likelihood to Recommend |  No answers on this topic | 
|
| Pros | No answers on this topic |
|
| Cons | No answers on this topic |
|
| Return on Investment | No answers on this topic |
|
| ScreenShots | CloudBees DevOptics Screenshots   | Hatica Screenshots   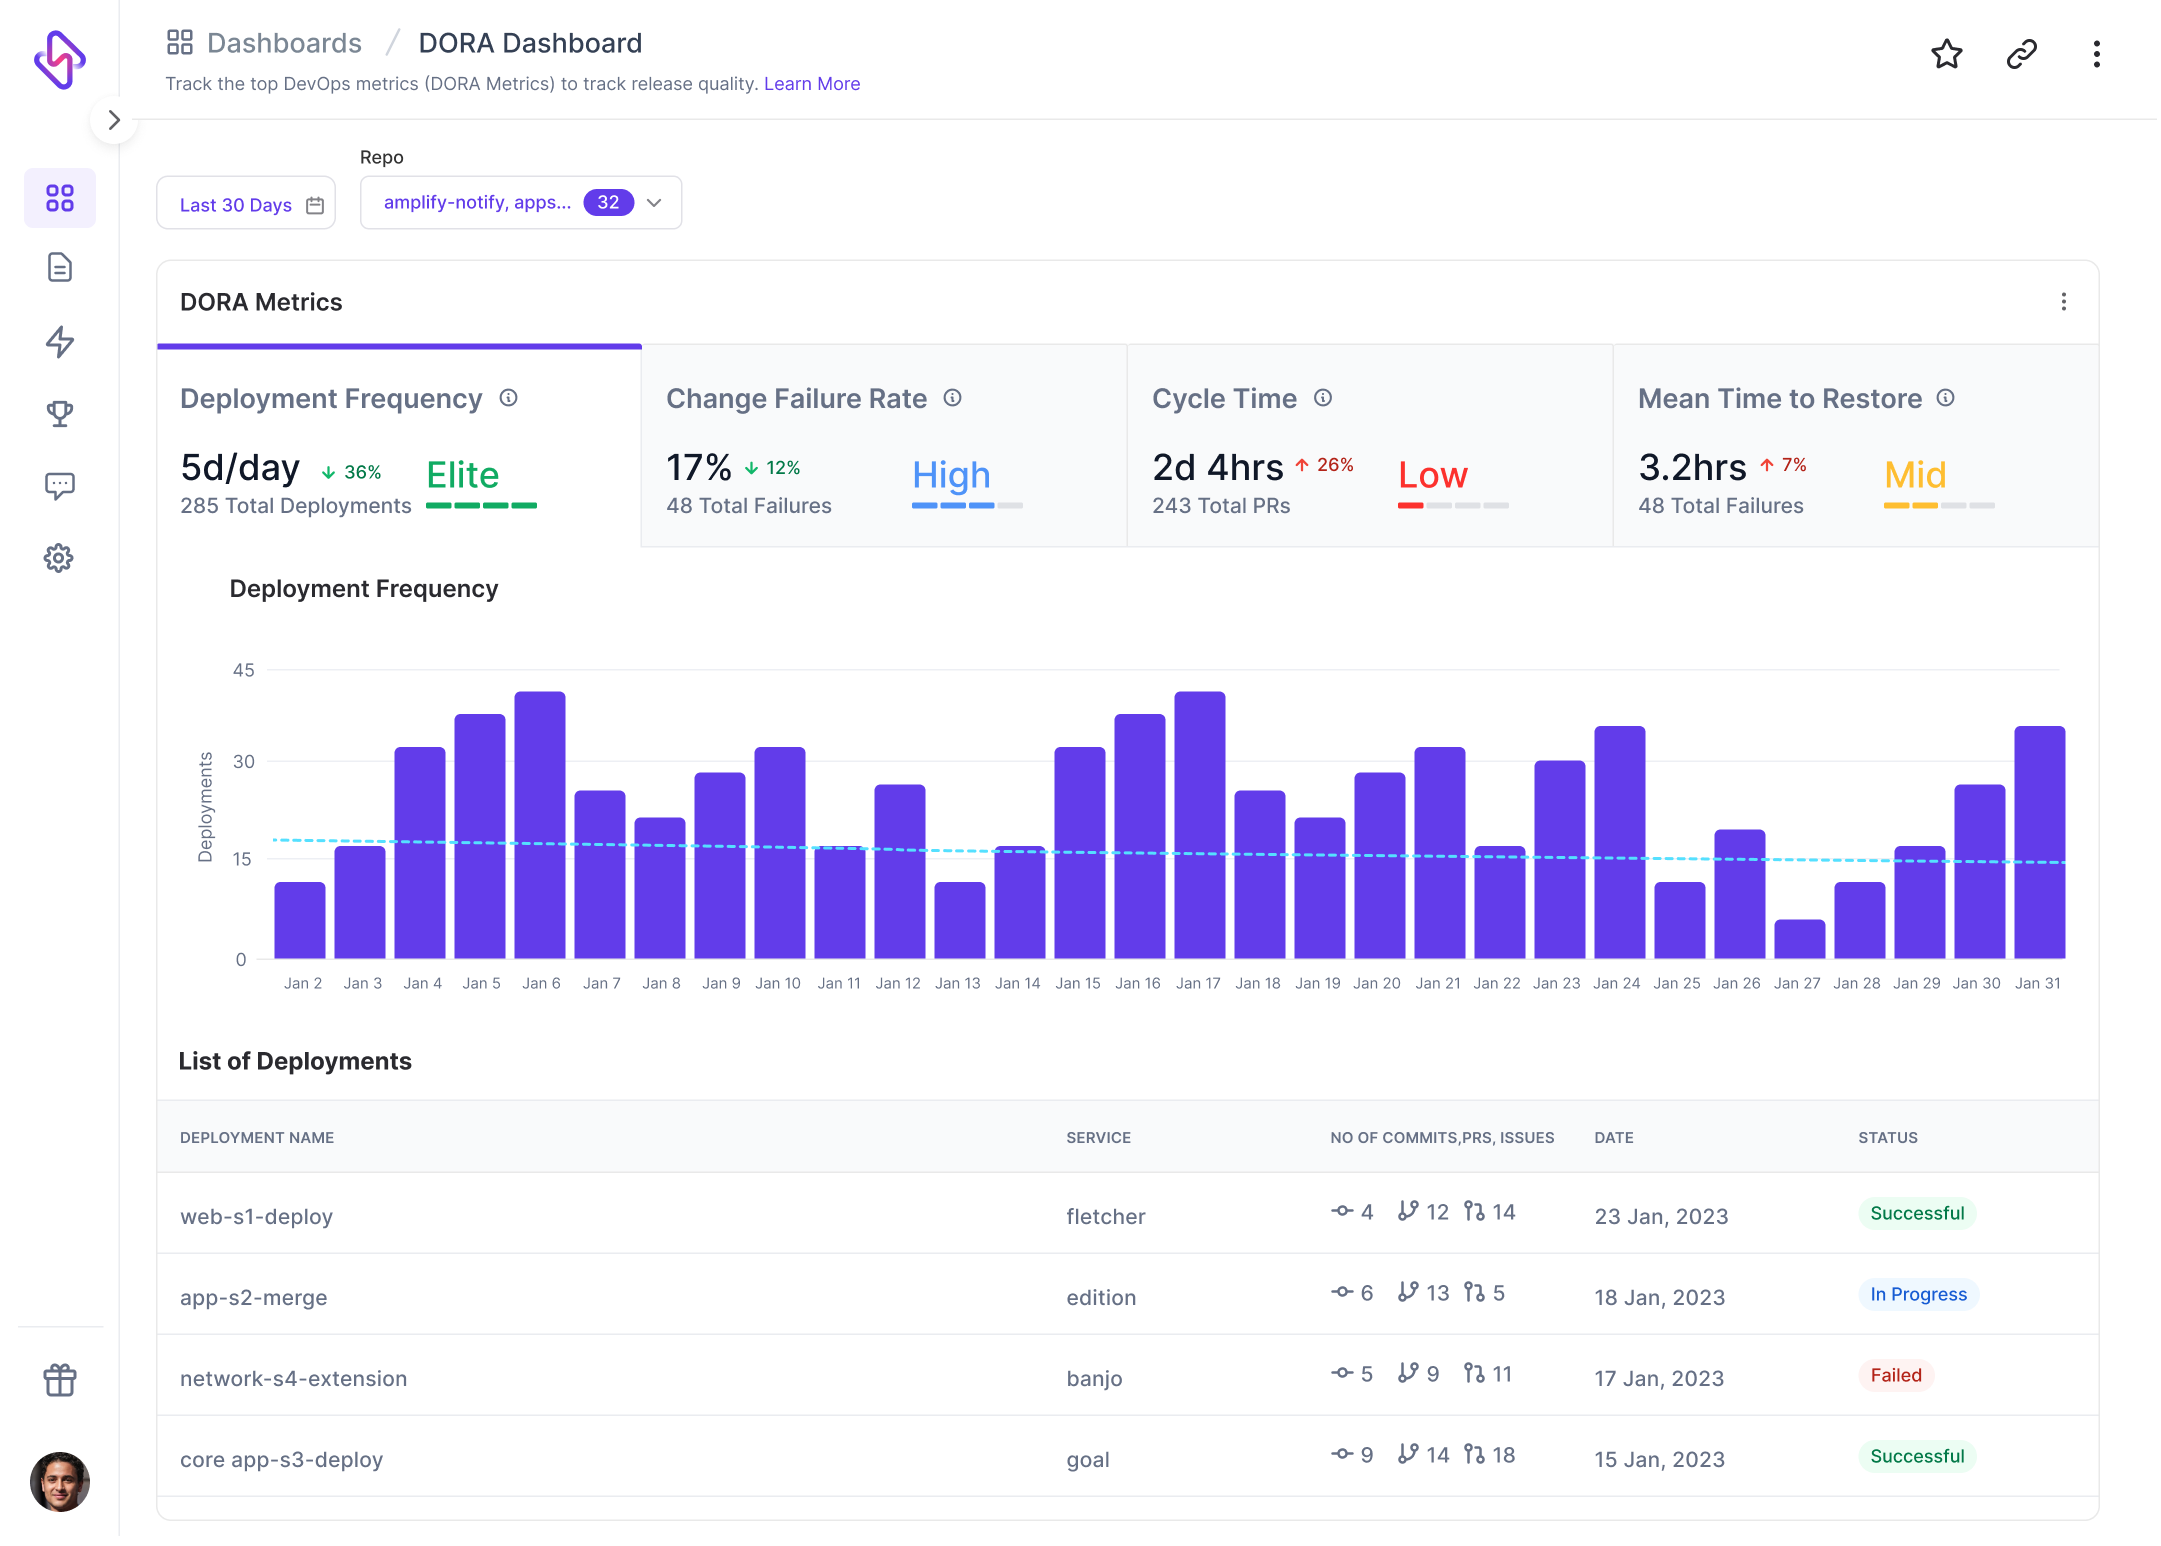  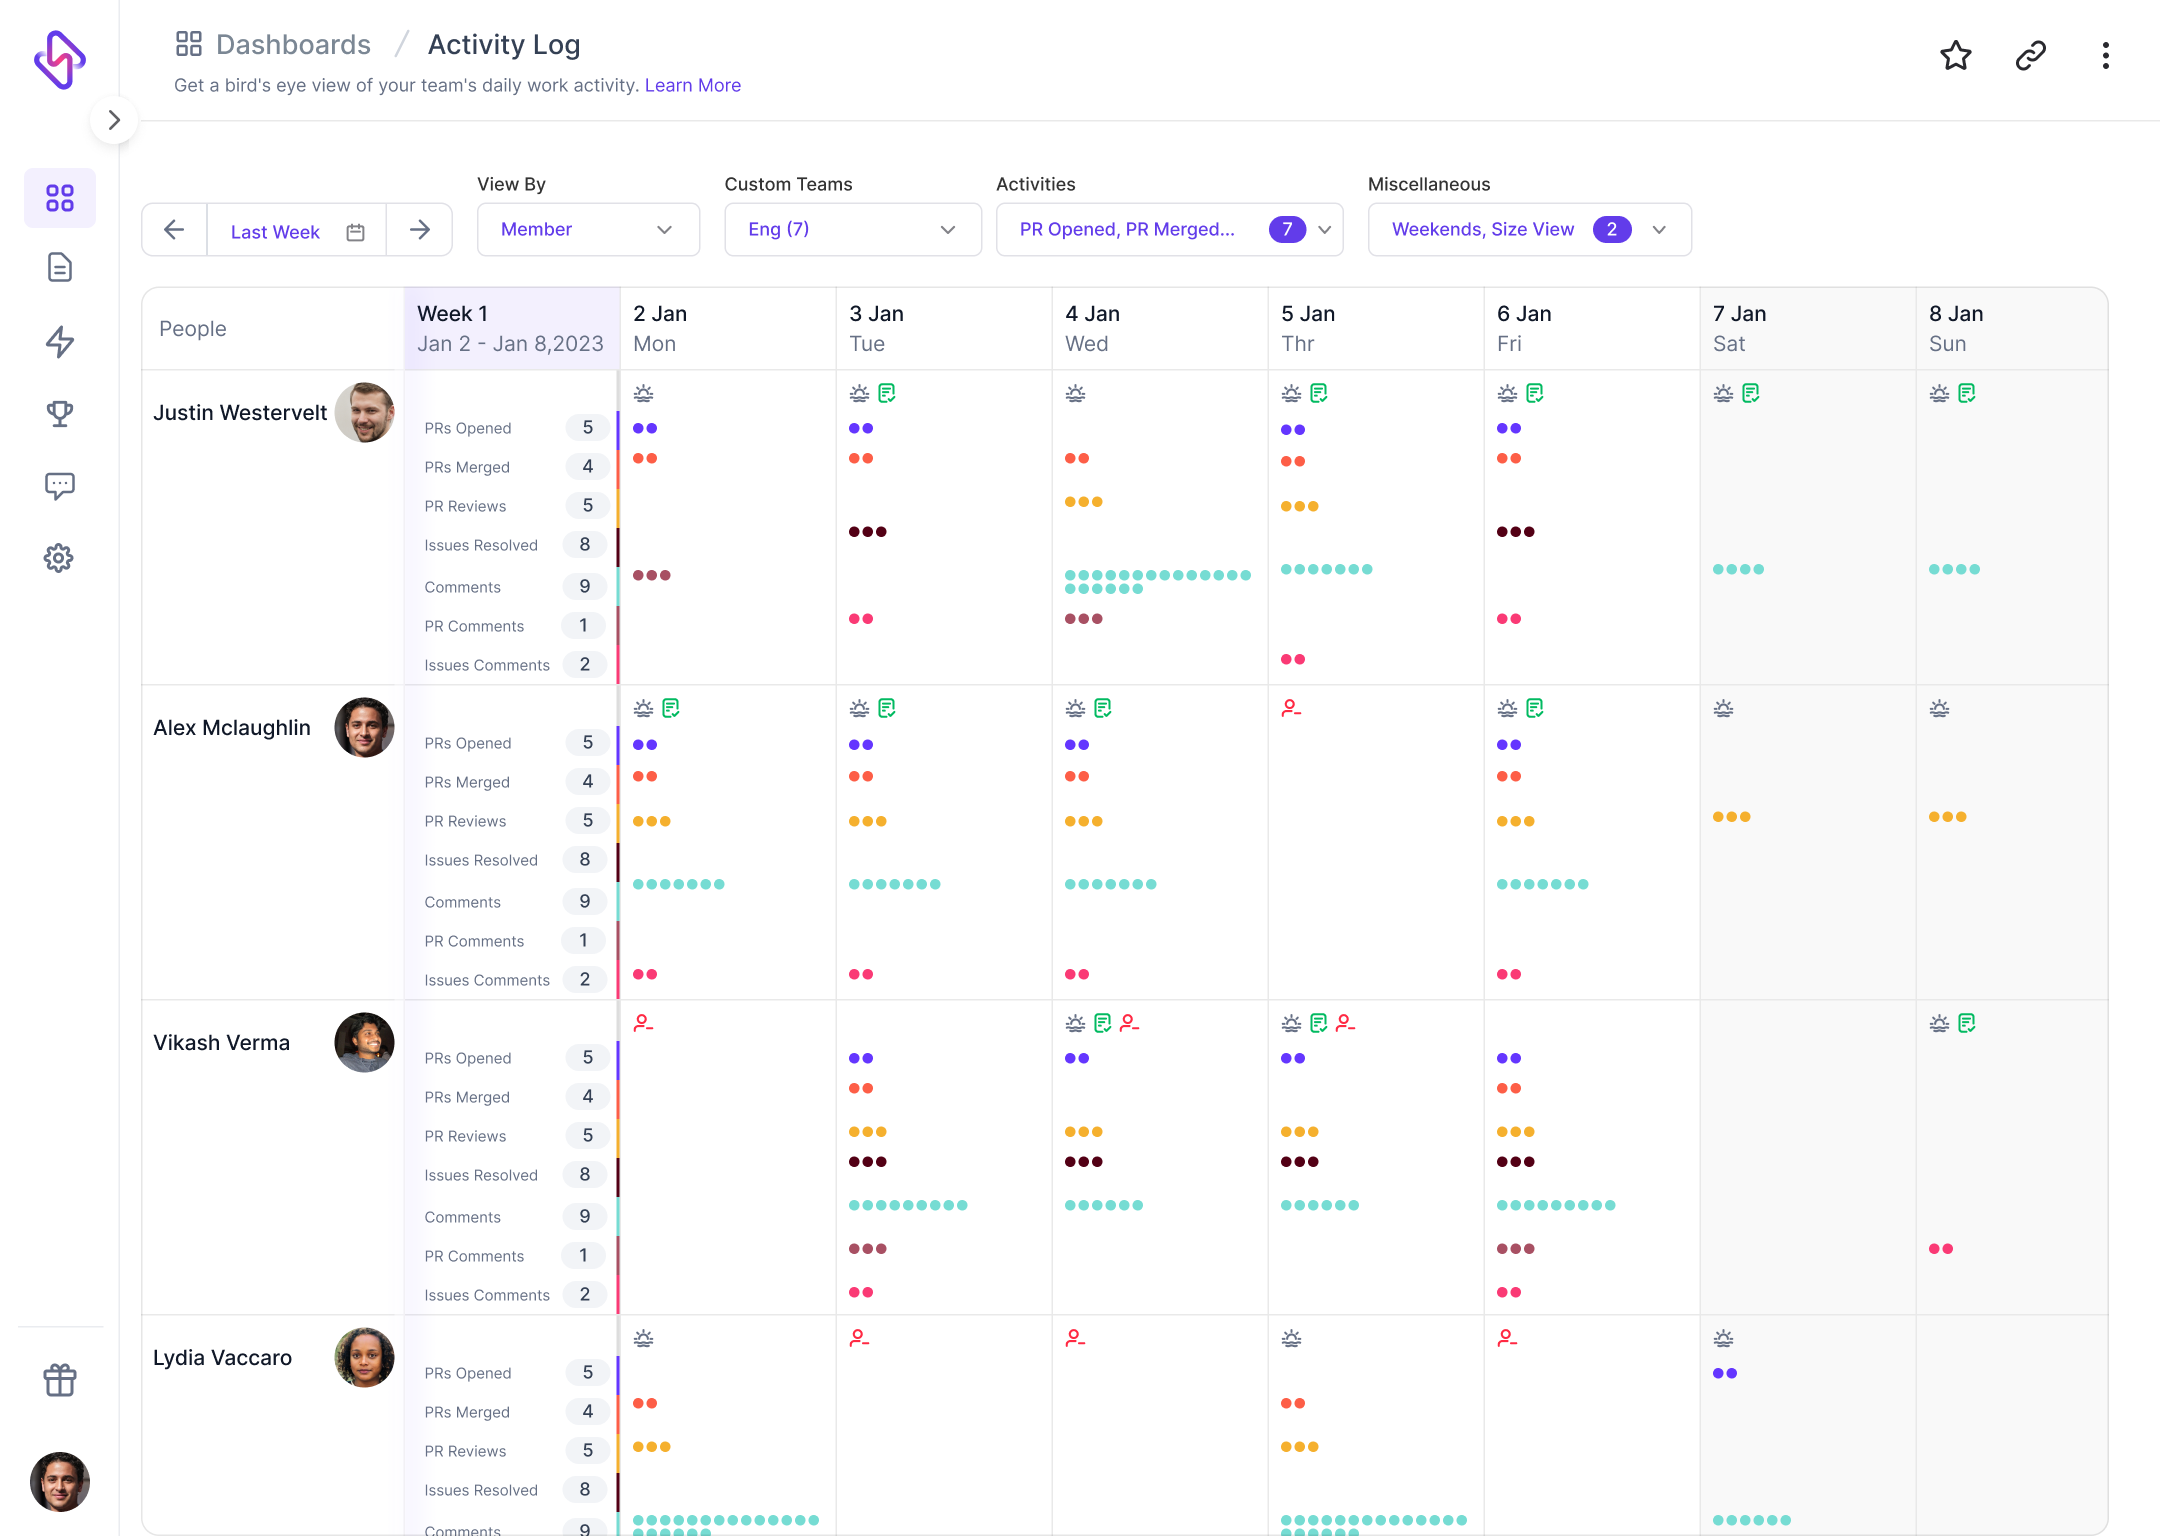 |