Velocity by Code Climate vs. Hatica
Velocity by Code Climate vs. Hatica
| Product | Rating | Most Used By | Product Summary | Starting Price |
|---|---|---|---|---|
 Velocity by Code Climate | N/A | Velocity by Code Climate transforms data from Jira and DevOps tools into insights to drive engineering operations from standups to board meetings. Designed to keep delivery on track, Velocity helps users spot bottlenecks and stay ahead of at-risk work before it slows down a sprint. | $449 per year per seat | |
 Hatica | N/A | Hatica equips engineering teams with work visibility dashboards, actionable insights and workflows to drive team productivity and engagement in remote and in-office environments alike. The vendor offers a free forever plan to help get started. Features: Engineering metrics dashboards 100+ metrics from 20+ apps including Github, Jira, Slack, Zoom, Google Workplace Remote work insights Aggregated work overview, sprint and retro… | N/A |
| Velocity by Code Climate | Hatica | |||||||||||||||
|---|---|---|---|---|---|---|---|---|---|---|---|---|---|---|---|---|
| Editions & Modules |
| No answers on this topic | ||||||||||||||
| Offerings |
| |||||||||||||||
| Entry-level Setup Fee | No setup fee | Optional | ||||||||||||||
| Additional Details | — | — | ||||||||||||||
| More Pricing Information | ||||||||||||||||
| Velocity by Code Climate | Hatica |
|---|
| Velocity by Code Climate | Hatica | |
|---|---|---|
| Small Businesses |  GitLab Score 8.8 out of 10 | GitLab Score 8.8 out of 10 |
| Medium-sized Companies | GitLab Score 8.8 out of 10 | GitLab Score 8.8 out of 10 |
| Enterprises | GitLab Score 8.8 out of 10 | GitLab Score 8.8 out of 10 |
| All Alternatives | View all alternatives | View all alternatives |
| Velocity by Code Climate | Hatica | |
|---|---|---|
| Likelihood to Recommend | - (0 ratings) | 9.4 (0 ratings) |
| Velocity by Code Climate | Hatica | |
|---|---|---|
| Likelihood to Recommend | No answers on this topic | 
|
| Pros | No answers on this topic |
|
| Cons | No answers on this topic |
|
| Return on Investment | No answers on this topic |
|
| ScreenShots | Hatica Screenshots   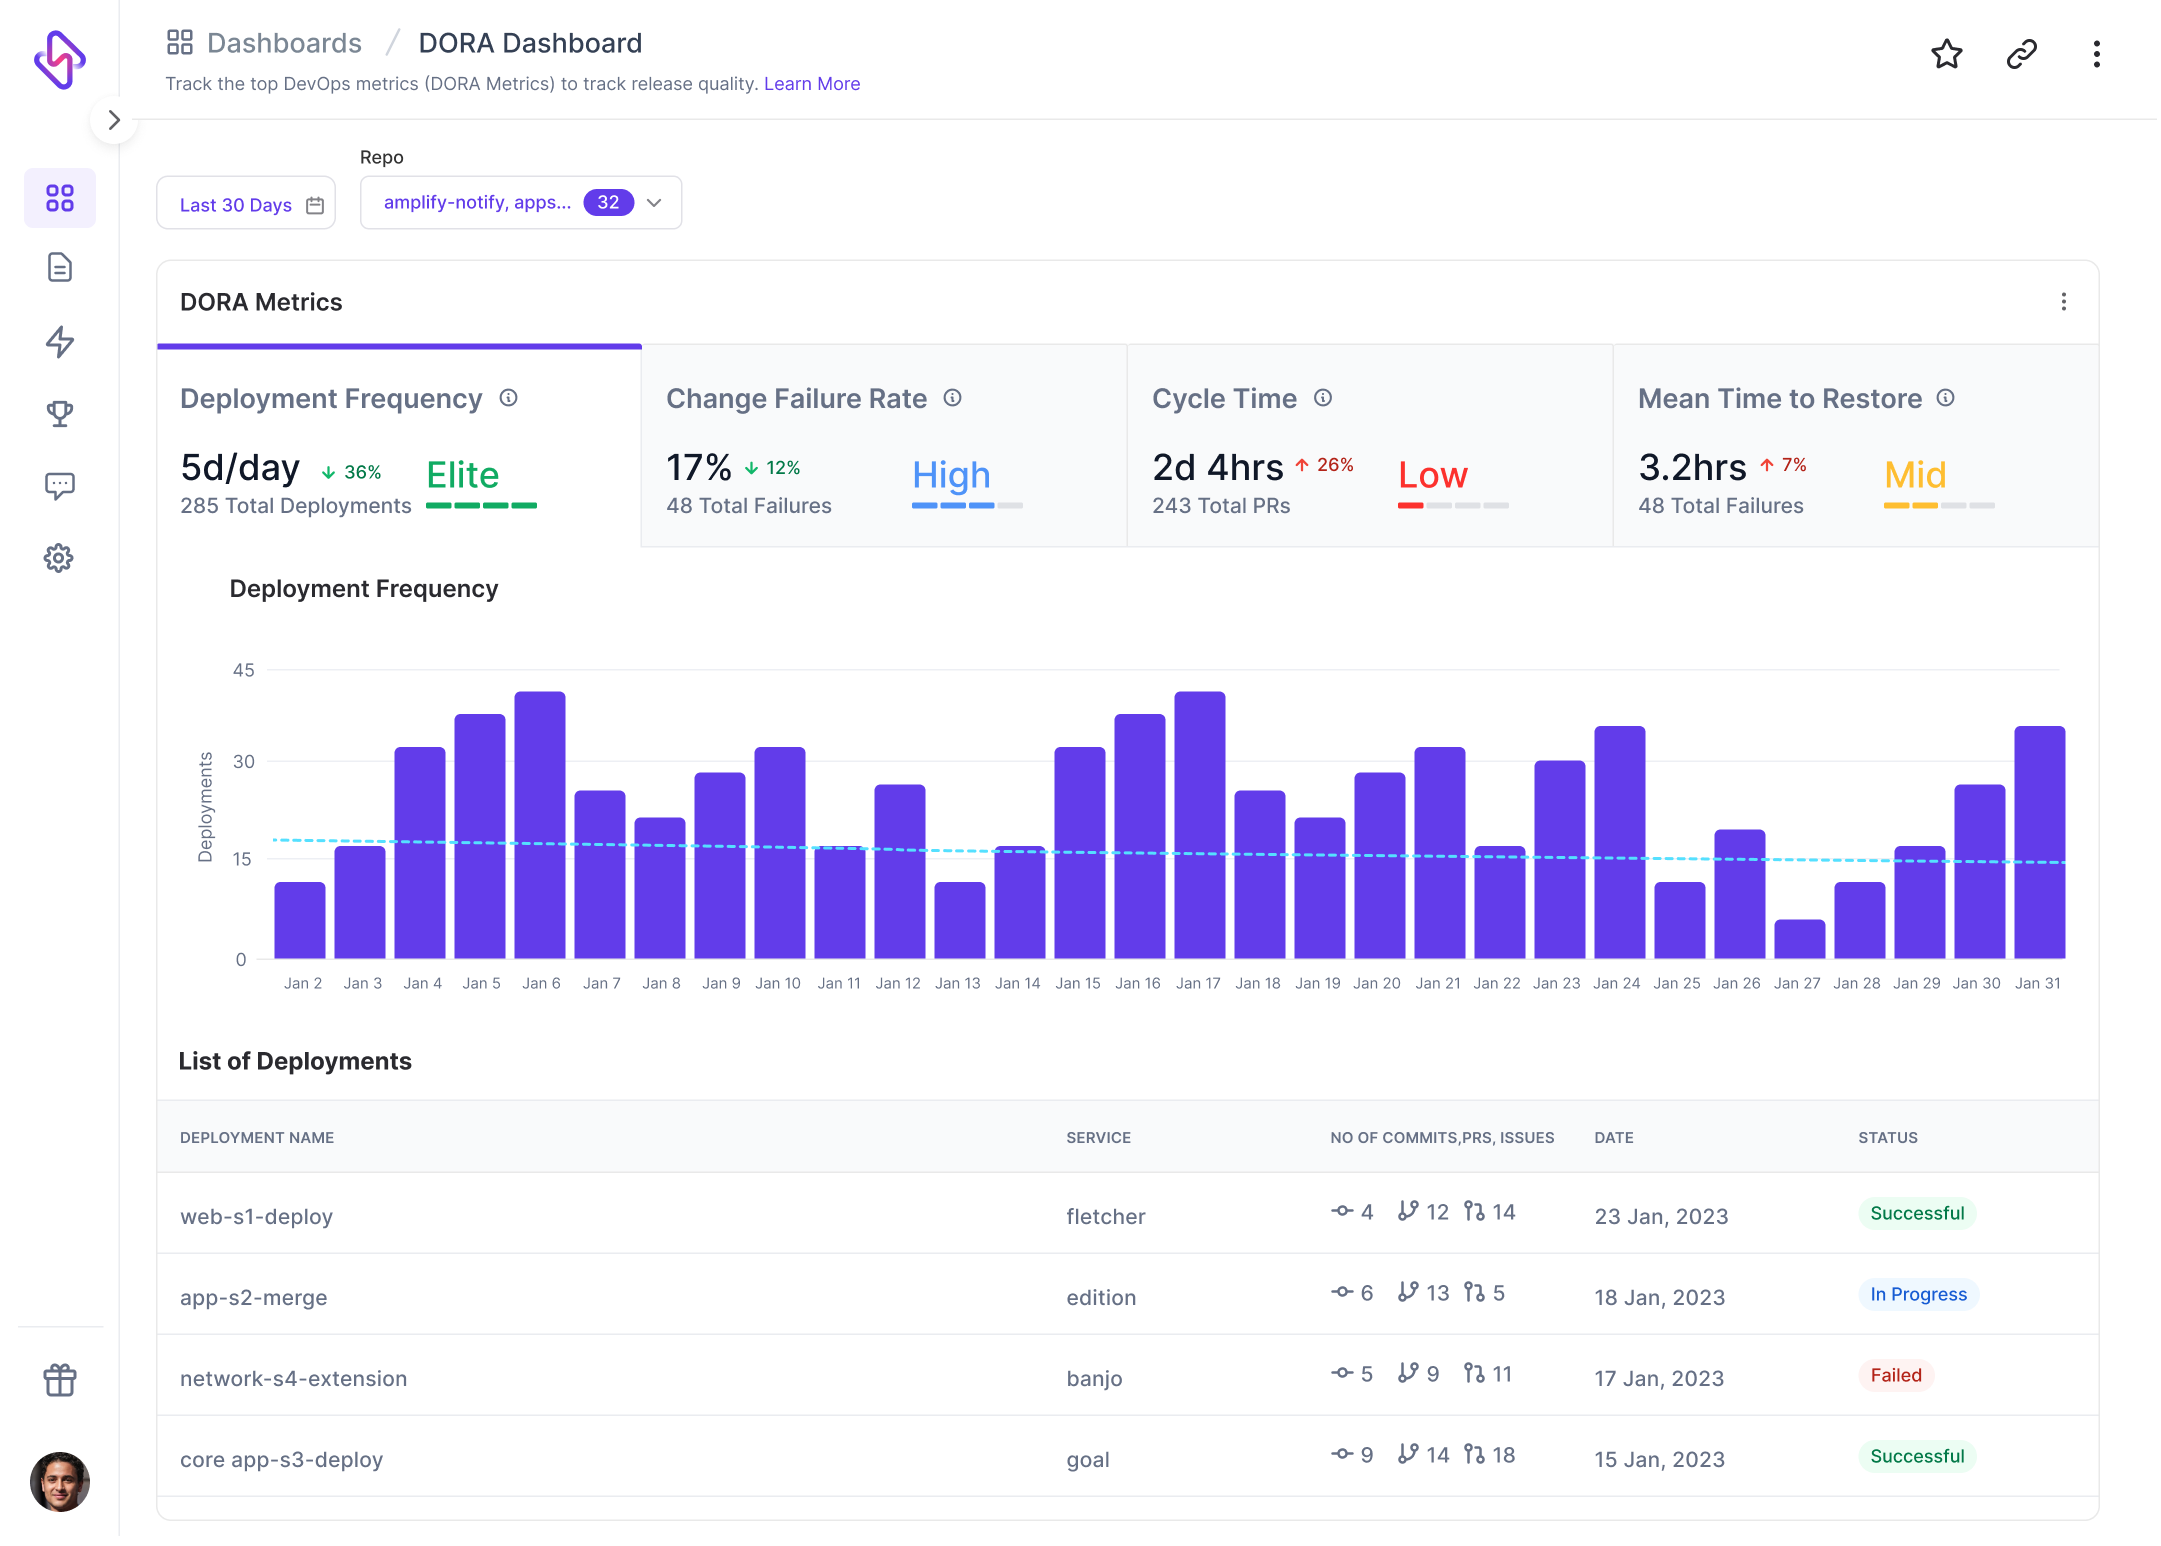  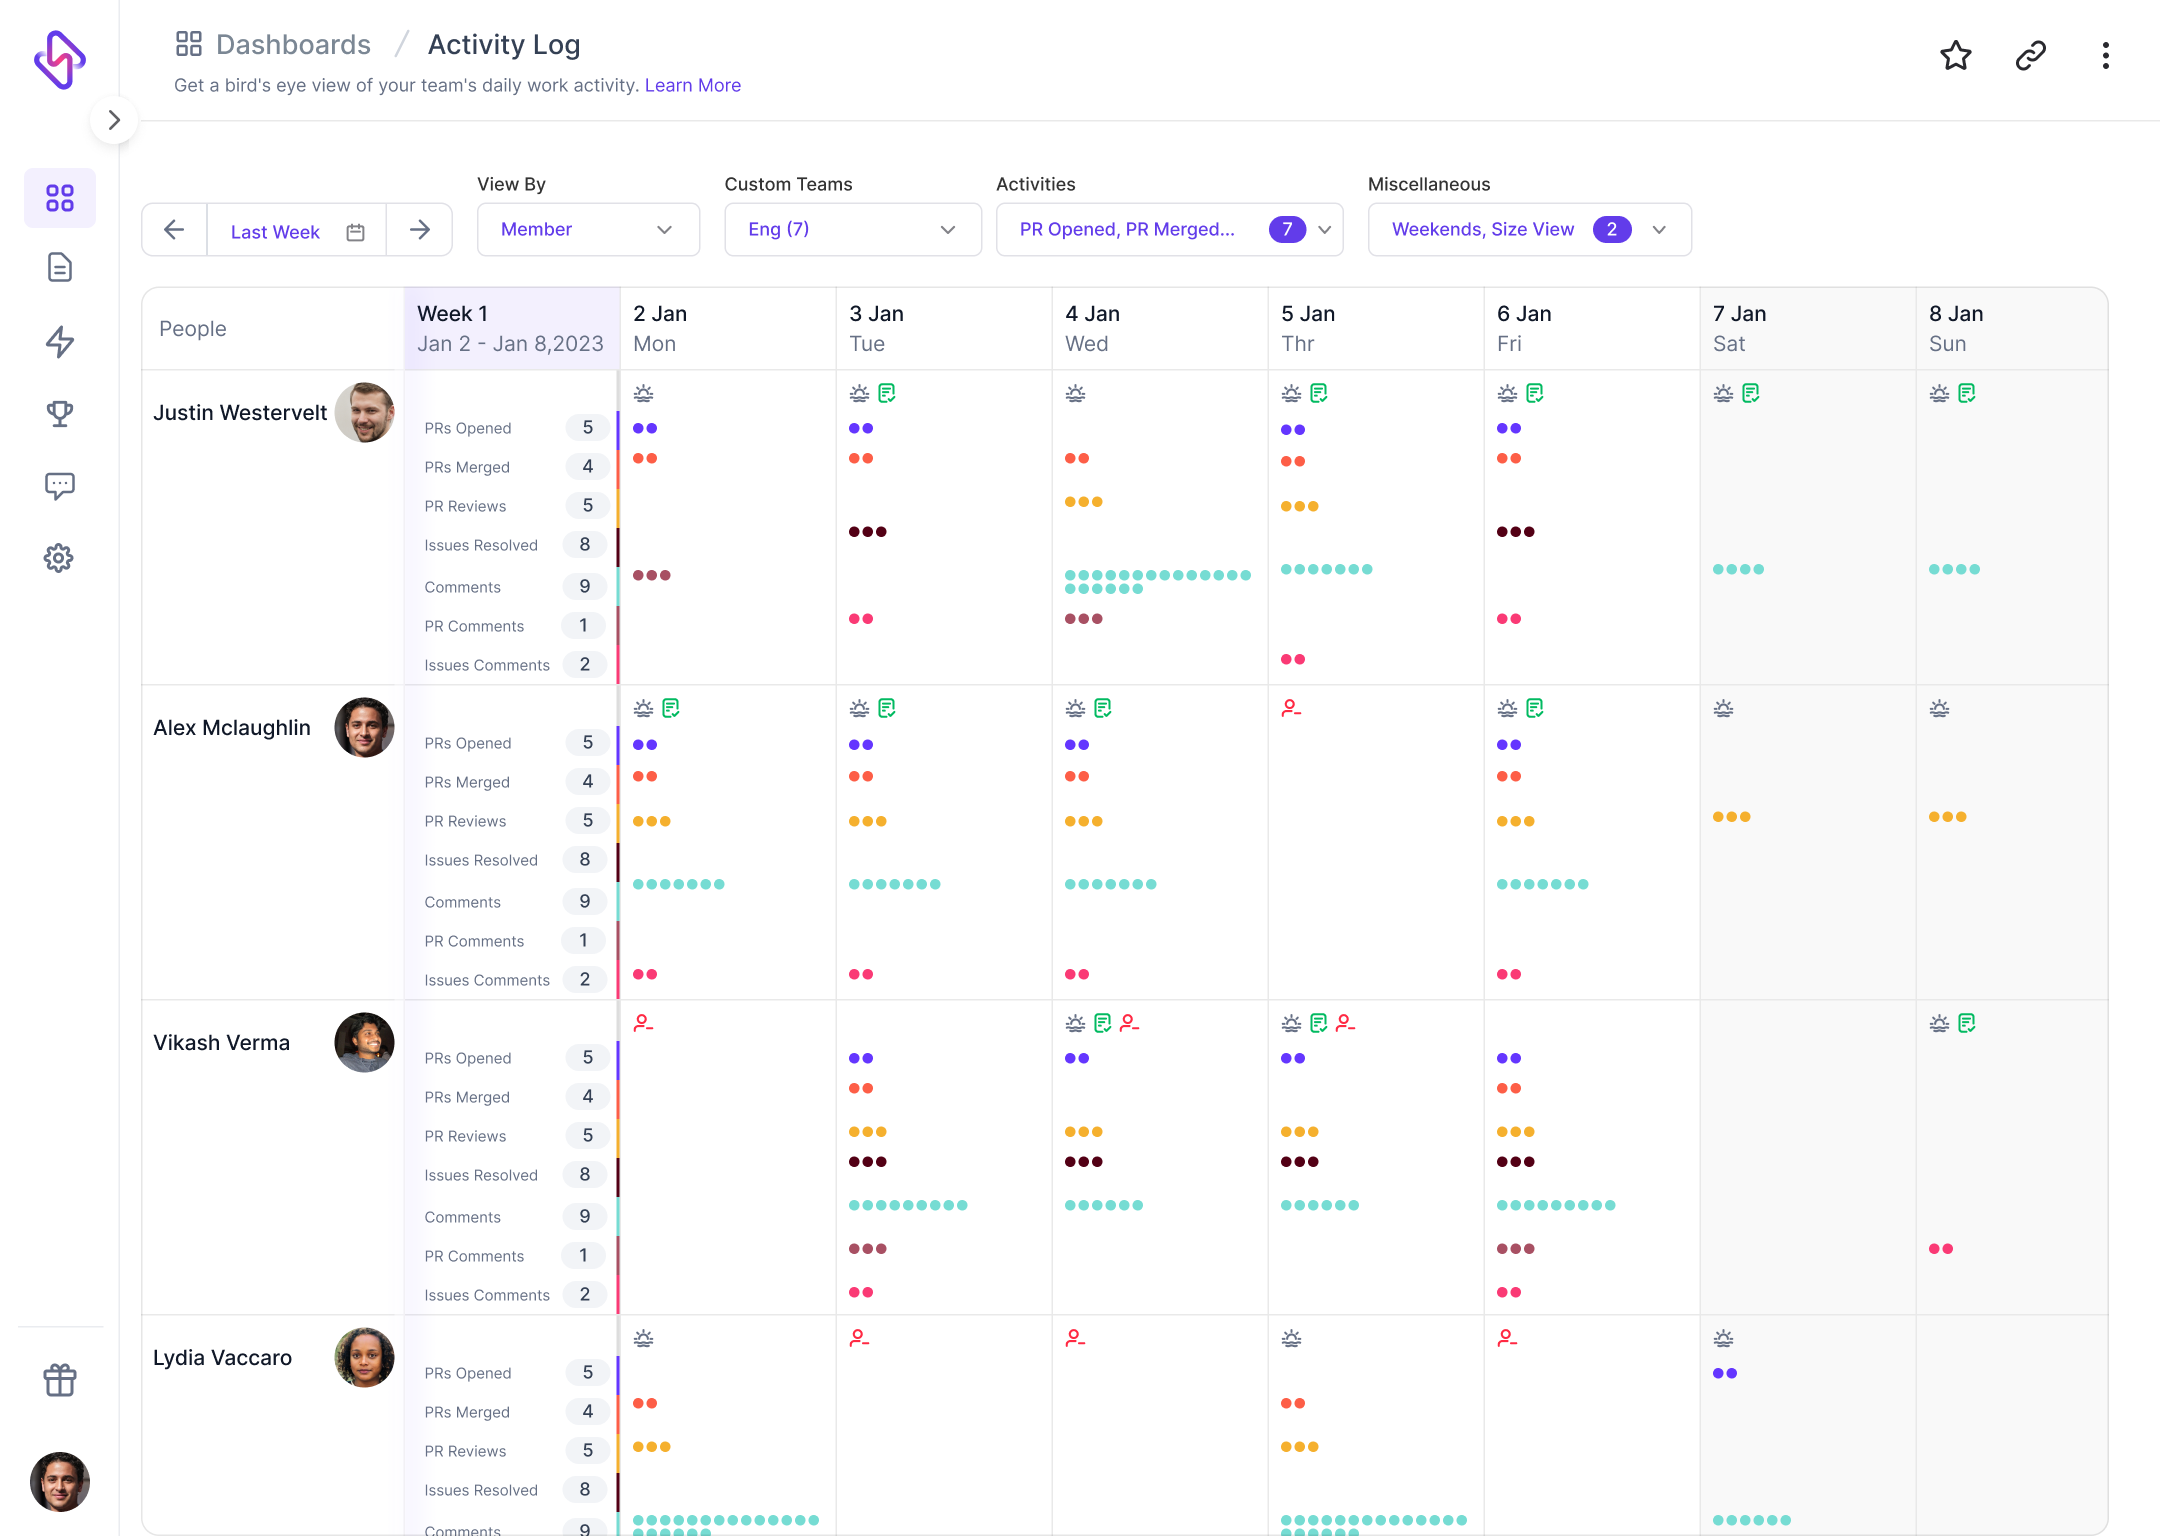 |