TrustRadius: an HG Insights company

ComponentOne vs. Flexmonster Pivot Table & Charts Component

Save this comparison

Save this comparison

Add Product

Recommended Comparisons

    Overview
    ProductRatingMost Used ByProduct SummaryStarting Price

    ComponentOne

    Score9 out of 10
    N/AComponentOne Studio, from software company GrapeCity in Pittsburgh, Pennsylvania, provides Visual Studio controls.

    $1,299

    per year per developer

    Flexmonster Pivot Table & Charts Component

    Score10 out of 10
    Mid-Size Companies (51-1,000 employees)
    Flexmonster Pivot Table & Charts is a component for interactive pivot reports that can be inserted into a web page or a web application. It’s a JavaScript tool that enables a user to visualize their business data. This solution supports Microsoft Analysis Services OLAP cubes, Mondrian, icCube, JSON, SQL (MS SQL, MySQL and others) databases or static JSON or CSV files. According to the vendor, this solution allows users to work extremely quickly with really large data…

    $0

    Annual SaaS Subscription

    Pricing
    ComponentOneFlexmonster Pivot Table & Charts Component
    Editions & Modules
    Enterprise
    $1,299.00
    per year per developer
    Pivot Table for SQL/CSV/JSON Unlimited
    $0
    Annual SaaS Subscription
    Pivot Table for Pentaho Mondrian
    $0
    Annual SaaS Subscription
    Pivot Table for MS Analysis Services
    $0
    Annual SaaS Subscription
    Pivot Table for SQL/CSV/JSON Basic
    $299
    Annual subscription
    Pivot Table for Pentaho Mondrian
    $799
    Annual subscription
    Pivot Table for SQL/CSV/JSON Unlimited
    $799
    Annual subscription
    Pivot Table for MS Analysis Services
    $799
    Annual subscription
    Offerings
    Pricing Offerings
    ComponentOneFlexmonster Pivot Table & Charts Component
    Free Trial
    YesYes
    Free/Freemium Version
    NoNo
    Premium Consulting/Integration Services
    NoYes
    Entry-level Setup FeeNo setup feeNo setup fee
    Additional Details——
    More Pricing Information
    Features
    ComponentOneFlexmonster Pivot Table & Charts Component
    BI Standard Reporting
    Comparison of BI Standard Reporting features of ComponentOne and Flexmonster Pivot Table & Charts Component
    Feature
    ComponentOne
    -
    Ratings
    Flexmonster Pivot Table & Charts Component
    10.0
    1 Ratings
    20% above category average
    Report Formatting Templates00 Ratings10.01 Ratings
    Ad-hoc Reporting
    Comparison of Ad-hoc Reporting features of ComponentOne and Flexmonster Pivot Table & Charts Component
    Feature
    ComponentOne
    -
    Ratings
    Flexmonster Pivot Table & Charts Component
    9.5
    1 Ratings
    17% above category average
    Formatting capabilities00 Ratings9.01 Ratings
    Report sharing and collaboration00 Ratings10.01 Ratings
    Report Output and Scheduling
    Comparison of Report Output and Scheduling features of ComponentOne and Flexmonster Pivot Table & Charts Component
    Feature
    ComponentOne
    -
    Ratings
    Flexmonster Pivot Table & Charts Component
    10.0
    1 Ratings
    20% above category average
    Publish to PDF00 Ratings10.01 Ratings
    Mobile Capabilities
    Comparison of Mobile Capabilities features of ComponentOne and Flexmonster Pivot Table & Charts Component
    Feature
    ComponentOne
    -
    Ratings
    Flexmonster Pivot Table & Charts Component
    10.0
    1 Ratings
    26% above category average
    Responsive Design for Web Access00 Ratings10.01 Ratings
    Best Alternatives
    ComponentOneFlexmonster Pivot Table & Charts Component
    Small Businesses
    Syncfusion Essential Studio
    Score7.3 out of 10
    Cyfe
    Score4 out of 10
    Medium-sized Companies
    Progress Telerik
    Score9.4 out of 10
    Qlik Cloud Analytics (Qlik Sense)
    Score8.1 out of 10
    Enterprises
    Progress Telerik
    Score9.4 out of 10
    Jaspersoft Community Edition
    Score7 out of 10
    All AlternativesView all alternativesView all alternatives
    User Ratings
    ComponentOneFlexmonster Pivot Table & Charts Component
    Likelihood to Recommend
    9.0
    (1 ratings)
    10.0
    (1 ratings)
    Usability
    -
    (0 ratings)
    9.0
    (1 ratings)
    Support Rating
    -
    (0 ratings)
    10.0
    (1 ratings)
    User Testimonials
    ComponentOneFlexmonster Pivot Table & Charts Component
    Likelihood to Recommend
    MESCIUS
    C1 is great for creating custom reports. We have client apps where we've created some fairly complicated reports such as invoices and real estate inspections. We also use the True DBGrid in many of our apps since it is so customizable. Its grouping and filtering features are very nice and can provide summary counts and totals at the bottom or right side of the grid that are very handy.
    Incentivized
    Read full review
    Flexmonster
    Fantastic product to embed in any SaaS solution for reporting and data exports. Excellent performance, ability to customize fields and tons of other features out of the box that makes it a well-rounded tool that is easy to use. To top it off their support is amazing for answering technical questions quickly and they provide great examples to learn how to interact with the code. We are very happy with our choice to use Flexmonster!
    Incentivized
    Read full review
    Pros
    MESCIUS
    • The True DBGrid control is nice for showing parent/child relationships and being able to drill down and show the child data. It also is nice for showing summary totals.
    • The report engine is great for building custom reports for Win Forms or web apps. It can do everything that Crystal Reports can do.
    • They have a good selection of controls that can do just about anything you can imagine.
    Incentivized
    Read full review
    Flexmonster
    No answers on this topic
    Cons
    MESCIUS
    • Sometimes it is difficult to figure out where things are in the properties of controls since there are so many things you can drill down into.
    • I find myself using Bing or Google a lot to look up how to do something. Some things are not very intuitive.
    • Of course, I would always like the price to be cheaper. The high price has caused us to not keep current and have the latest version.
    Incentivized
    Read full review
    Flexmonster
    No answers on this topic
    Usability
    MESCIUS
    No answers on this topic
    Flexmonster
    Checks all the boxes! Easy to use, great out of the box feature set and fantastic support team
    Incentivized
    Read full review
    Support Rating
    MESCIUS
    No answers on this topic
    Flexmonster
    Quick response to questions and feedback, excellent documentation for learning about the product and tons of examples to leverage.
    Incentivized
    Read full review
    Alternatives Considered
    MESCIUS
    We have been in business since 1992, so we have used many different products over the years. The two other products we've primary used that are similar to ComponentOne, are Infragistics and Crystal Reports. Infragistics has a vast array of controls similar to ComponentOne. We use both to be honest and I'm not sure which one I would pick over the other. I guess that would depend on what you're trying to accomplish and if one had some control or capability that the other didn't. ComponentOne does have the reporting capabilities, where Infragistics does not.
    Incentivized
    Read full review
    Flexmonster
    No answers on this topic
    Return on Investment
    MESCIUS
    • ComponentOne allows us to add additional features to our apps that wouldn't be found in apps written with just Visual Studio itself. That allows our clients to get more creative in their requirements, which in turn, means more work and billable hours for us!
    • Our apps appear more professional when using ComponentOne which helps us get projects for new clients.
    • ComponentOne also helps us to save clients some money since we are not having to develop things that it can do from scratch.
    Incentivized
    Read full review
    Flexmonster
    No answers on this topic
    ScreenShots

    Flexmonster Pivot Table & Charts Component Screenshots

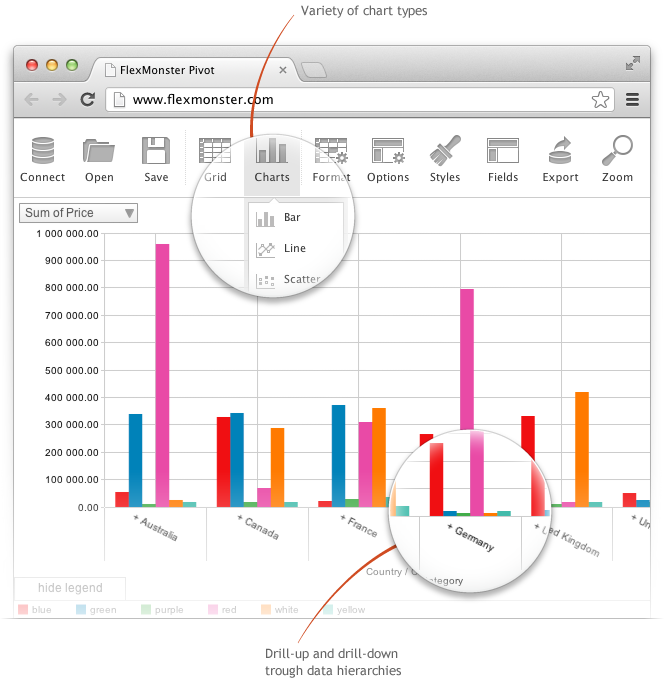
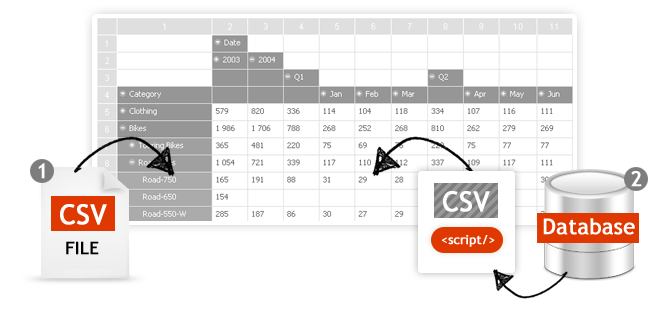
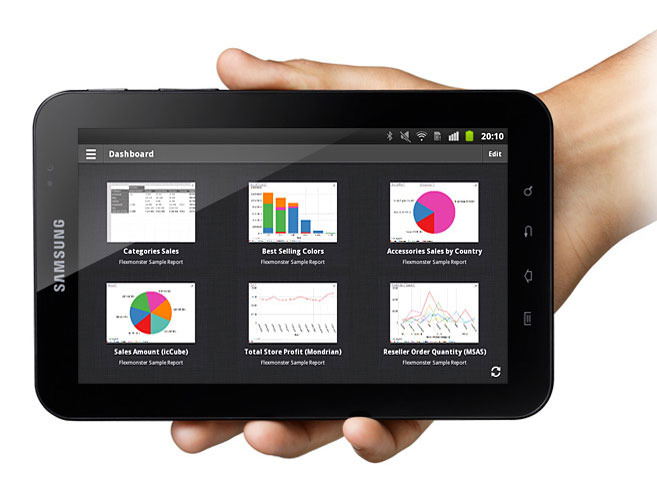
    Screenshot of Pivot Component supports the printing of the Pivot view. Additionally users can export the reports into a variety of formats.Screenshot of Pivot Table Component helps you to create interactive pivot tables and charts reports for web and Flex applications. Pivot Component will provide your customers with an extremely intuitive end-user experience while creating and analyzing reports.Screenshot of Pivot Charts provide an alternative, interactive way to visualize data.Screenshot of The component will connect to any database: MS SQL, MySQL, Oracle, PostgreSQL - using simple script generating CSV output to enable real-time business analysis. Pivot Component is full browser-side component, thus you can use any desired server-side to generate CSV data.Screenshot of Pivot Table Component can connect to OLAP cubes via XMLA protocol. XMLA is XML for Analysis - an industry standard for data access in analytical systems, such as OLAP and Data Mining.Screenshot of Start mobile business reporting with the Flexmonster mobile application. It can be downloaded to your tablets from Google Play or Apple App Store.