Chose CubeAPM
Satisfactory
| Product | Rating | Most Used By | Product Summary | Starting Price |
|---|---|---|---|---|
 CubeAPM | N/A | CubeAPM is a full-stack observability platform built on OpenTelemetry that enables engineering teams to monitor services, infrastructure, logs, and metrics from a single pane of glass. Teams can self-host CubeAPM inside their own cloud or on-premises environment, or use it as a managed deployment. It delivers full-stack visibility with smart sampling, alerting, tracing, and unlimited data retention at a flat usage-based price of $0.15 per GB. Many teams face a trade-off in… | $0.15 per month Per GB | |
 Grafana Cloud | N/A | Grafana Cloud is a fully managed Observability Platform designed to aggregate, visualize, and analyze telemetry data across distributed architectures. The platform provides a unified environment for Metrics, Logs, Traces, and Continuous Profiling, utilizing the LGTM (Loki, Grafana, Tempo, Mimir) and Pyroscope stack to provide high-cardinality analysis of system state. | $8 per month up to 1 active user |
| CubeAPM | Grafana Cloud | |||||||||||||||
|---|---|---|---|---|---|---|---|---|---|---|---|---|---|---|---|---|
| Editions & Modules |
|
| ||||||||||||||
| Offerings |
| |||||||||||||||
| Entry-level Setup Fee | No setup fee | No setup fee | ||||||||||||||
| Additional Details | CubeAPM follows a transparent & predictable usage-based pricing model starting at $0.15 per GB of data ingested per month. Unlike traditional APM tools that charge by host or agent, CubeAPM pricing scales linearly with data volume—no hidden fees, overages, or lock-ins. Teams can deploy self-hosted or managed versions with unlimited data retention and predictable monthly billing. Enterprise plans include ISO 27001-certified infrastructure, dedicated support, and volume-based discounts. | — | ||||||||||||||
| More Pricing Information | ||||||||||||||||
| CubeAPM | Grafana Cloud | |
|---|---|---|
| Considered Both Products |  CubeAPM | Grafana Cloud  ANurag Tamrakar Software Engineer - DevOps Chose Grafana Cloud Kibana and Foglight  Matthew Goodhall infastructure consultant Chose Grafana Cloud Grafana has a direct plugin to Icinga monitoring solution and allowed for easy configuration for us. At the time of implementation, other services did not have such an integration. As we already had a very customized and heavily introduced monitoring solution in place, we … |
| CubeAPM | Grafana Cloud | |
|---|---|---|
| Small Businesses |  InfluxDB Score 9.0 out of 10 |  Amazon CloudWatch Score 7.7 out of 10 |
| Medium-sized Companies |  Logz.io Score 8.4 out of 10 |  ManageEngine Site24x7 Score 10.0 out of 10 |
| Enterprises |  NetBrain Technologies Score 8.9 out of 10 | ManageEngine Site24x7 Score 10.0 out of 10 |
| All Alternatives | View all alternatives | View all alternatives |
| CubeAPM | Grafana Cloud | |
|---|---|---|
| Likelihood to Recommend | - (0 ratings) | 9.4 (0 ratings) |
| Usability | - (0 ratings) | 9.6 (0 ratings) |
| CubeAPM | Grafana Cloud | |
|---|---|---|
| Likelihood to Recommend |
|
|
| Pros |
|
|
| Cons |
|
|
| Usability |
|
|
| Alternatives Considered |
|
|
| Return on Investment |
|
ANurag Tamrakar Software Engineer - DevOps |
| ScreenShots | CubeAPM Screenshots 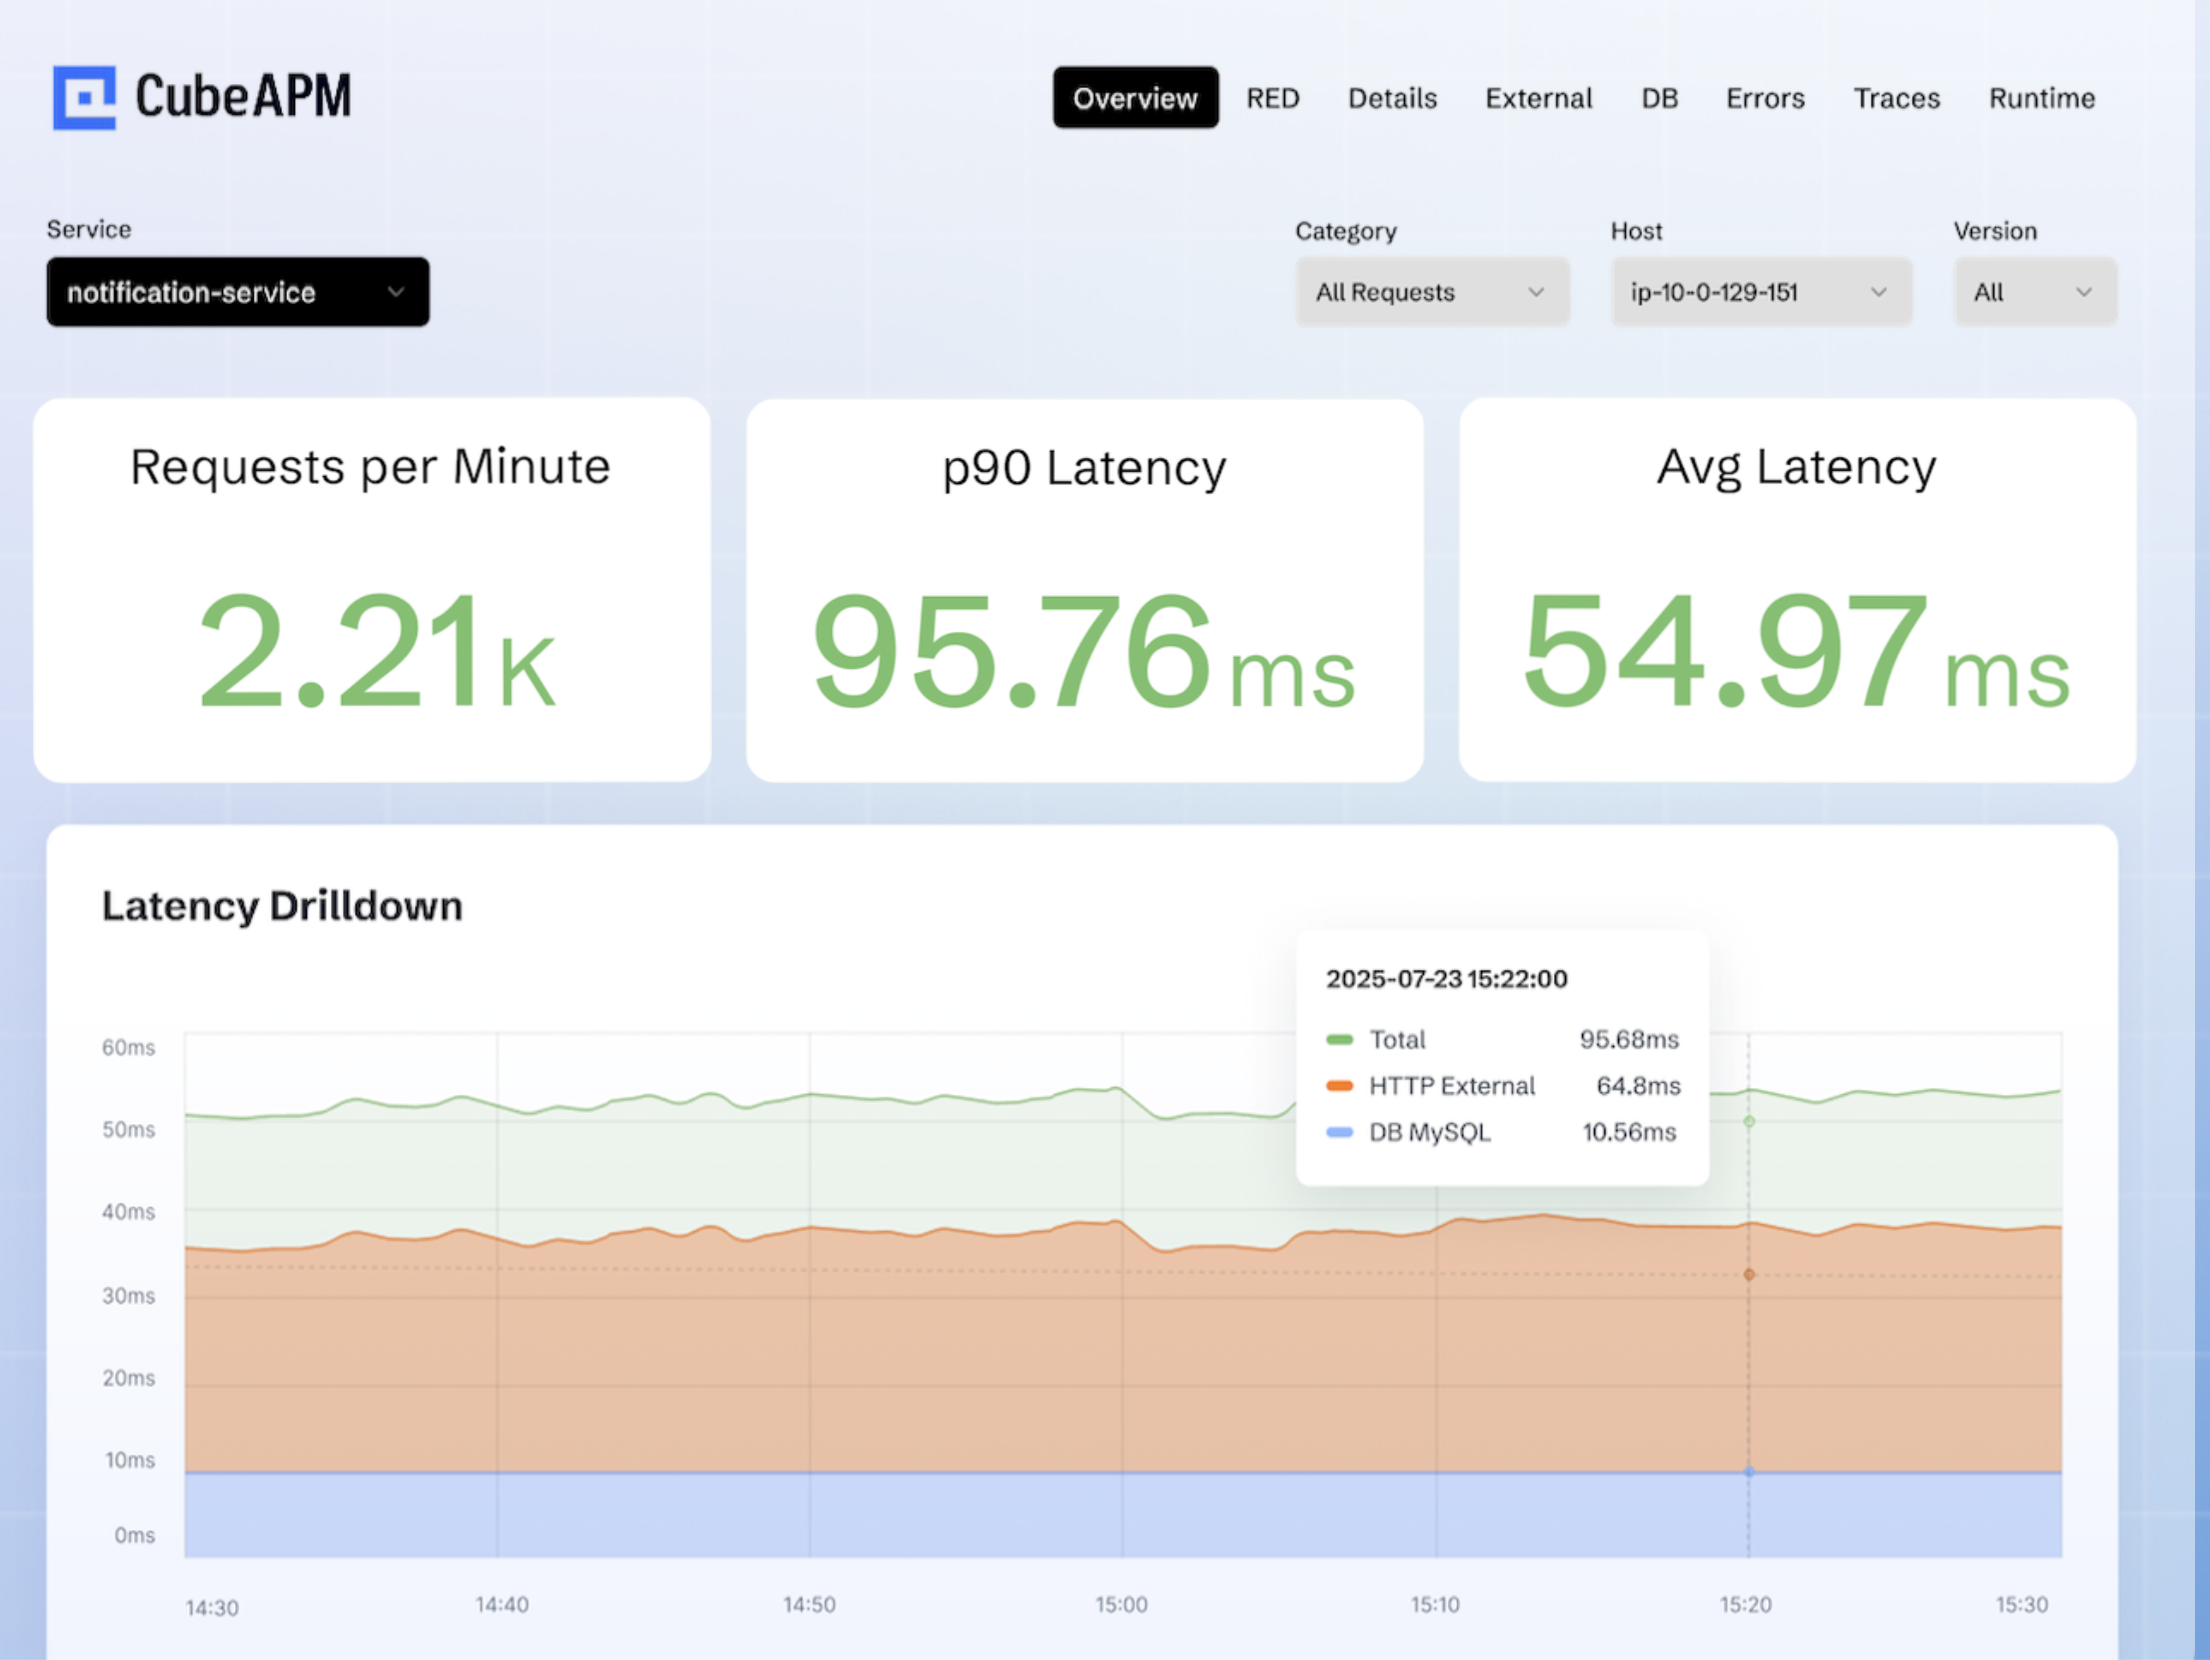  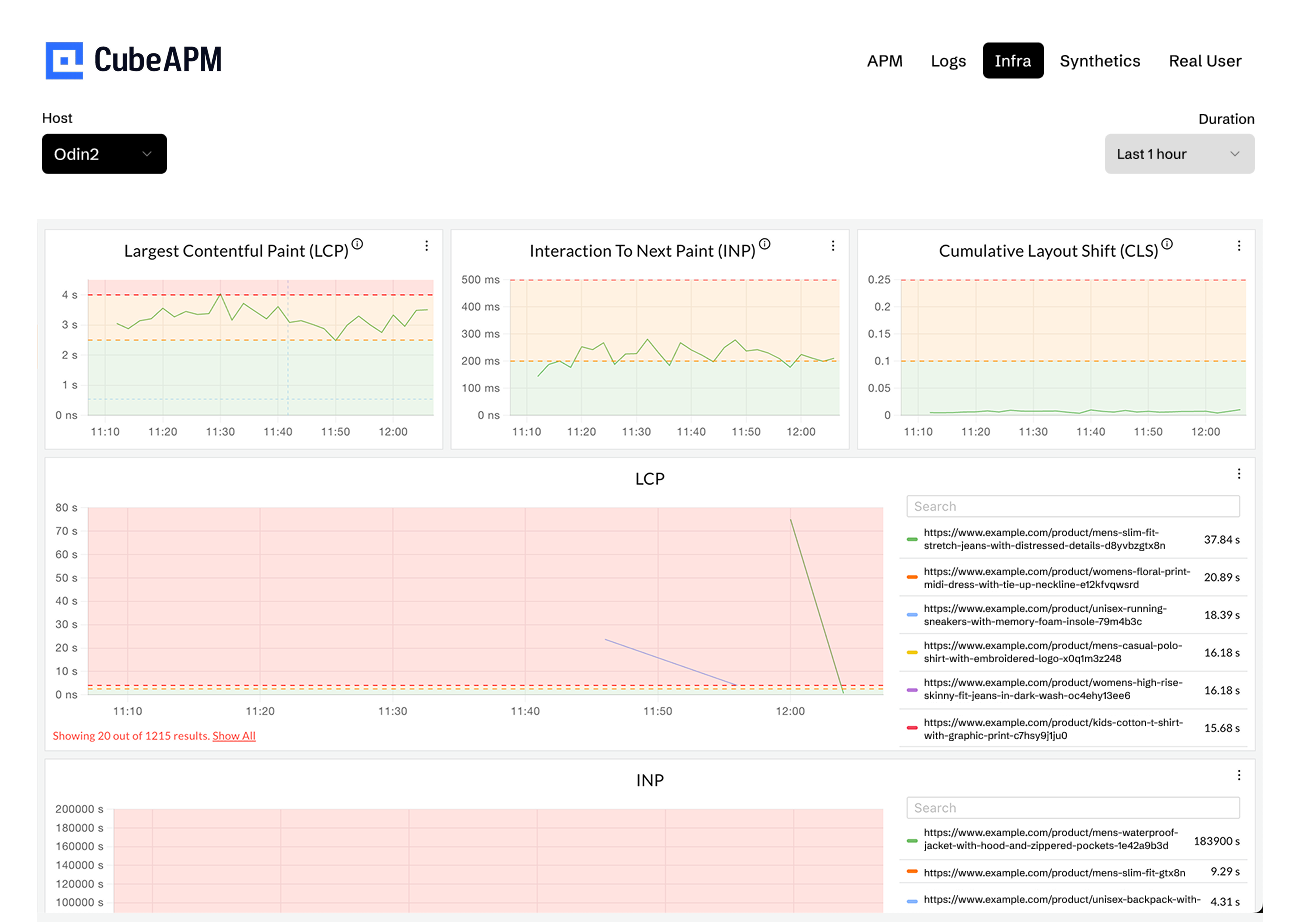  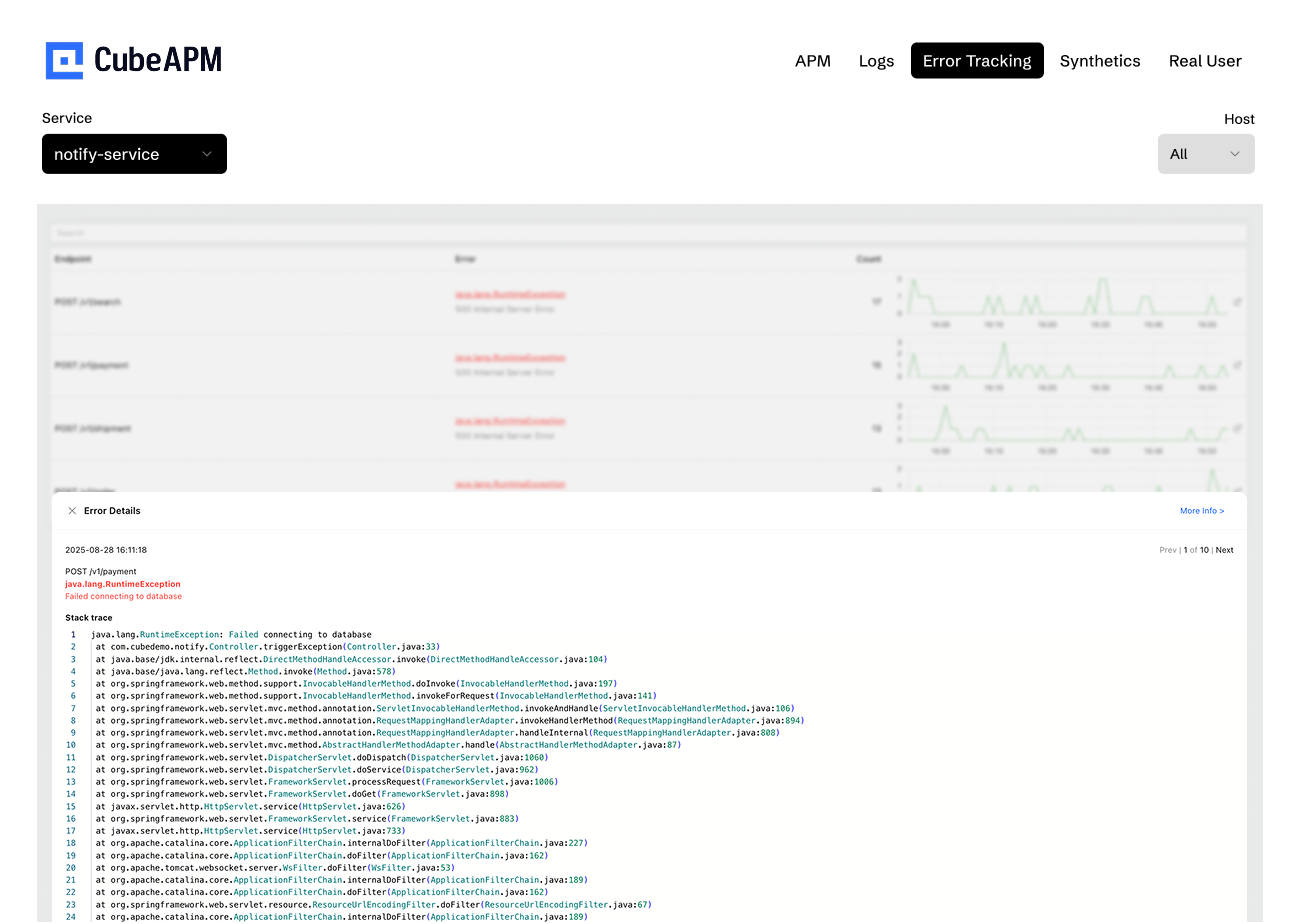 |