Flexmonster Pivot Table & Charts Component vs. Spread
Flexmonster Pivot Table & Charts Component vs. Spread
| Product | Rating | Most Used By | Product Summary | Starting Price |
|---|---|---|---|---|
 Flexmonster Pivot Table & Charts Component | Mid-Size Companies (51-1,000 employees) | Flexmonster Pivot Table & Charts is a component for interactive pivot reports that can be inserted into a web page or a web application. It’s a JavaScript tool that enables a user to visualize their business data. This solution supports Microsoft Analysis Services OLAP cubes, Mondrian, icCube, JSON, SQL (MS SQL, MySQL and others) databases or static JSON or CSV files. According to the vendor, this solution allows users to work extremely quickly with really large data… | $0 Annual SaaS Subscription | |
 Spread | N/A | Spread is a JavaScript and .NET spreadsheet solution line for building rich, Excel-like applications. It includes data grids, spreadsheet UI controls, and reporting tools for enterprise, web, desktop, and mobile platforms—no Microsoft Excel or Office dependencies required. | N/A |
| Flexmonster Pivot Table & Charts Component | Spread | |||||||||||||||
|---|---|---|---|---|---|---|---|---|---|---|---|---|---|---|---|---|
| Editions & Modules |
| No answers on this topic | ||||||||||||||
| Offerings |
| |||||||||||||||
| Entry-level Setup Fee | No setup fee | No setup fee | ||||||||||||||
| Additional Details | — | — | ||||||||||||||
| More Pricing Information | ||||||||||||||||
| Flexmonster Pivot Table & Charts Component | Spread |
|---|
| Flexmonster Pivot Table & Charts Component | Spread | |||||||||
|---|---|---|---|---|---|---|---|---|---|---|
| BI Standard Reporting |
| |||||||||
| Ad-hoc Reporting |
| |||||||||
| Report Output and Scheduling |
| |||||||||
| Mobile Capabilities |
|
| Flexmonster Pivot Table & Charts Component | Spread | |
|---|---|---|
| Small Businesses |  Yellowfin Score 8.6 out of 10 |  Syncfusion Essential Studio Score 6.9 out of 10 |
| Medium-sized Companies |  Reveal Score 10.0 out of 10 |  React (React.js) Score 8.9 out of 10 |
| Enterprises |  Kyvos Semantic Layer Score 9.5 out of 10 | React (React.js) Score 8.9 out of 10 |
| All Alternatives | View all alternatives | View all alternatives |
| Flexmonster Pivot Table & Charts Component | Spread | |
|---|---|---|
| Likelihood to Recommend | 10.0 (1 ratings) | - (0 ratings) |
| Usability | 9.0 (1 ratings) | - (0 ratings) |
| Support Rating | 10.0 (1 ratings) | - (0 ratings) |
| Flexmonster Pivot Table & Charts Component | Spread | |
|---|---|---|
| Likelihood to Recommend |  Flexmonster
| MESCIUS No answers on this topic |
| Usability | Flexmonster
| MESCIUS No answers on this topic |
| Support Rating | Flexmonster
| MESCIUS No answers on this topic |
| ScreenShots | Flexmonster Pivot Table & Charts Component Screenshots      | Spread Screenshots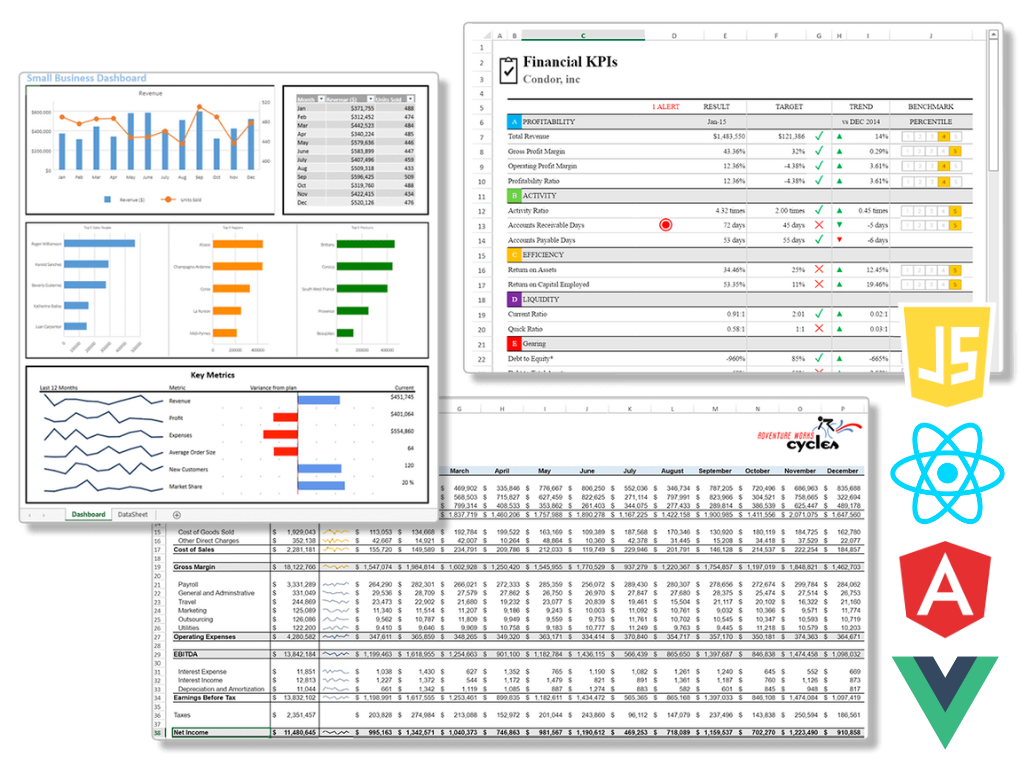 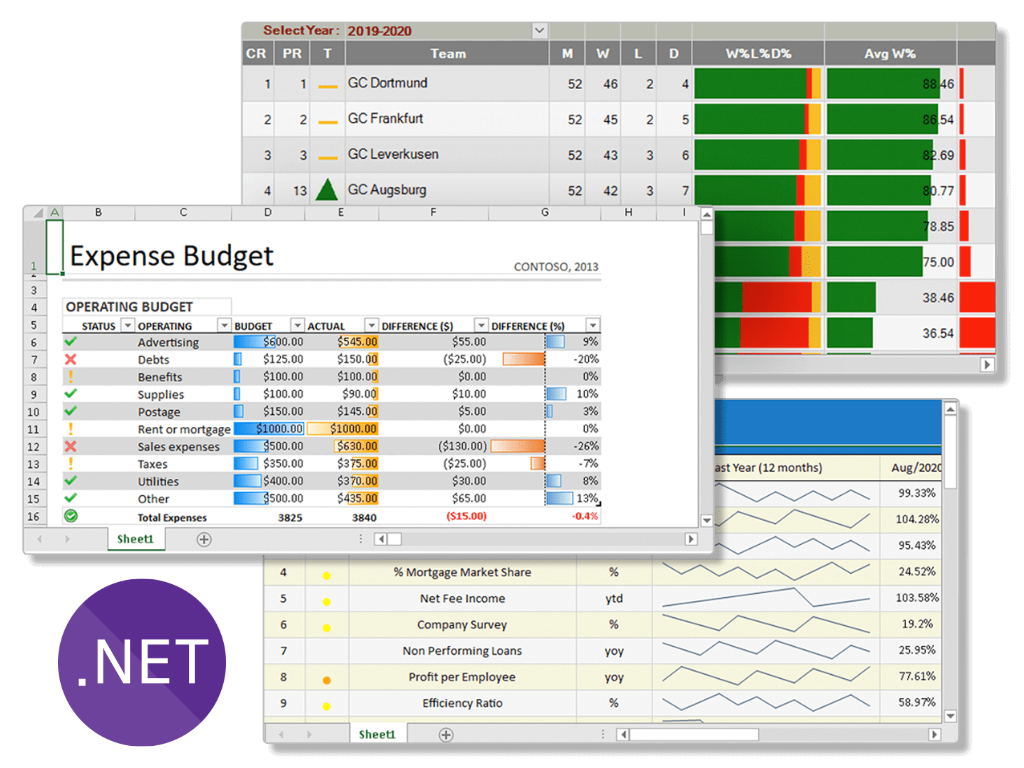 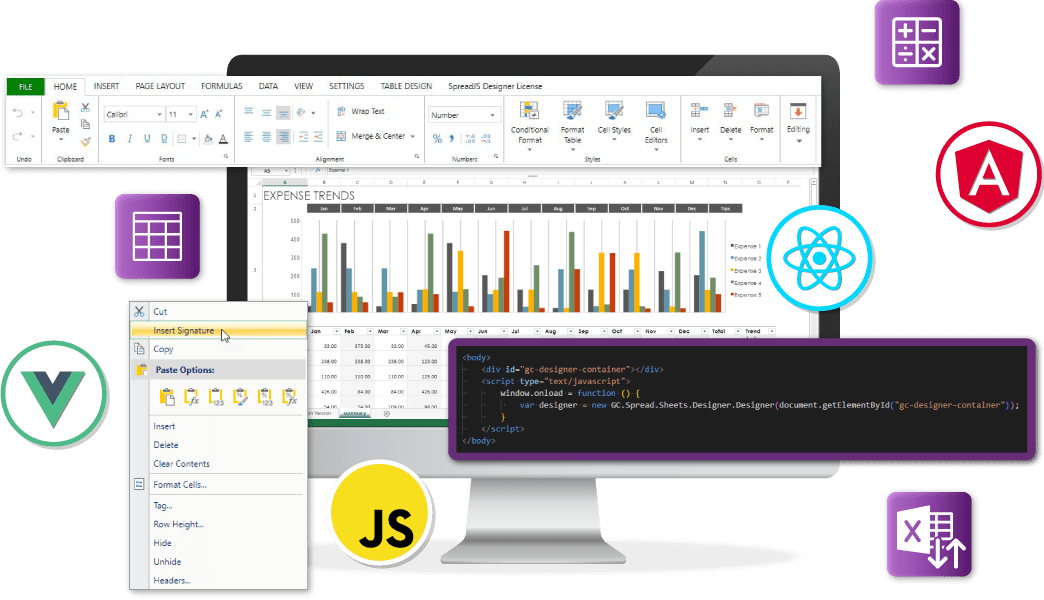 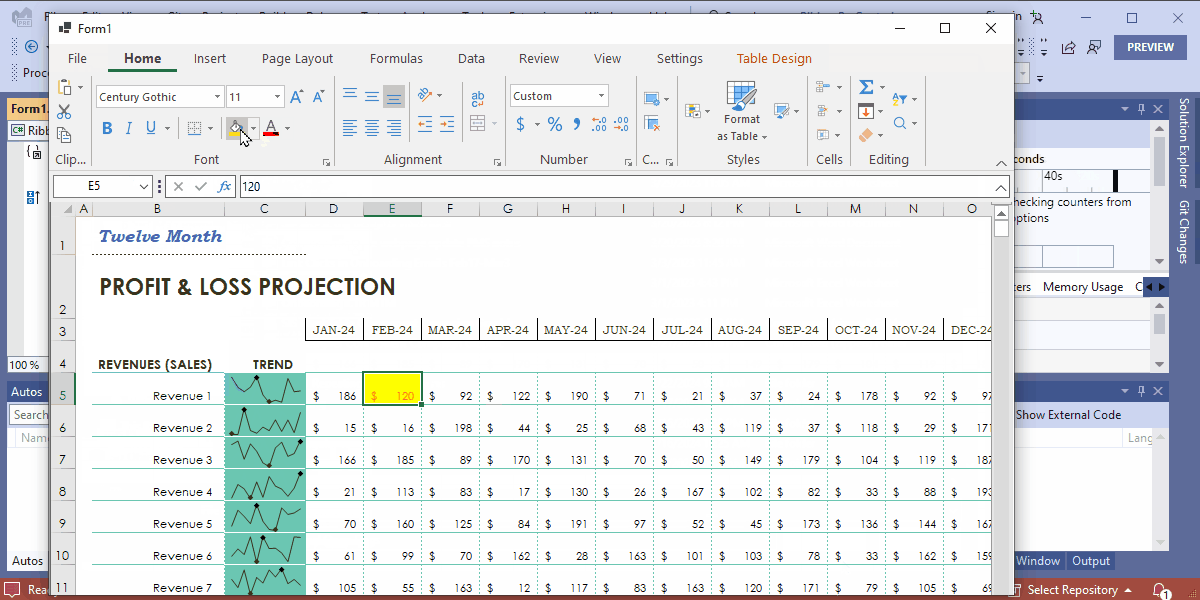 |