TrustRadius: an HG Insights company

Flexmonster Pivot Table & Charts Component vs. SAP Predictive Analytics

Save this comparison

Save this comparison

Add Product

Recommended Comparisons

    Overview
    ProductRatingMost Used ByProduct SummaryStarting Price

    Flexmonster Pivot Table & Charts Component

    Score10 out of 10
    Mid-Size Companies (51-1,000 employees)
    Flexmonster Pivot Table & Charts is a component for interactive pivot reports that can be inserted into a web page or a web application. It’s a JavaScript tool that enables a user to visualize their business data. This solution supports Microsoft Analysis Services OLAP cubes, Mondrian, icCube, JSON, SQL (MS SQL, MySQL and others) databases or static JSON or CSV files. According to the vendor, this solution allows users to work extremely quickly with really large data…

    $0

    Annual SaaS Subscription

    SAP Predictive Analytics

    Score7.7 out of 10
    N/ASAP Predictive Analytics is, as the name would suggest, a statistical analysis and data mining platform that can be deployed with SAP HANA.N/A
    Pricing
    Flexmonster Pivot Table & Charts ComponentSAP Predictive Analytics
    Editions & Modules
    Pivot Table for SQL/CSV/JSON Unlimited
    $0
    Annual SaaS Subscription
    Pivot Table for Pentaho Mondrian
    $0
    Annual SaaS Subscription
    Pivot Table for MS Analysis Services
    $0
    Annual SaaS Subscription
    Pivot Table for SQL/CSV/JSON Basic
    $299
    Annual subscription
    Pivot Table for Pentaho Mondrian
    $799
    Annual subscription
    Pivot Table for SQL/CSV/JSON Unlimited
    $799
    Annual subscription
    Pivot Table for MS Analysis Services
    $799
    Annual subscription
    No answers on this topic
    Offerings
    Pricing Offerings
    Flexmonster Pivot Table & Charts ComponentSAP Predictive Analytics
    Free Trial
    YesNo
    Free/Freemium Version
    NoNo
    Premium Consulting/Integration Services
    YesNo
    Entry-level Setup FeeNo setup feeNo setup fee
    Additional Details——
    More Pricing Information
    Features
    Flexmonster Pivot Table & Charts ComponentSAP Predictive Analytics
    BI Standard Reporting
    Comparison of BI Standard Reporting features of Flexmonster Pivot Table & Charts Component and SAP Predictive Analytics
    Feature
    Flexmonster Pivot Table & Charts Component
    10.0
    1 Ratings
    20% above category average
    SAP Predictive Analytics
    -
    Ratings
    Report Formatting Templates10.01 Ratings00 Ratings
    Ad-hoc Reporting
    Comparison of Ad-hoc Reporting features of Flexmonster Pivot Table & Charts Component and SAP Predictive Analytics
    Feature
    Flexmonster Pivot Table & Charts Component
    9.5
    1 Ratings
    17% above category average
    SAP Predictive Analytics
    -
    Ratings
    Formatting capabilities9.01 Ratings00 Ratings
    Report sharing and collaboration10.01 Ratings00 Ratings
    Report Output and Scheduling
    Comparison of Report Output and Scheduling features of Flexmonster Pivot Table & Charts Component and SAP Predictive Analytics
    Feature
    Flexmonster Pivot Table & Charts Component
    10.0
    1 Ratings
    20% above category average
    SAP Predictive Analytics
    -
    Ratings
    Publish to PDF10.01 Ratings00 Ratings
    Mobile Capabilities
    Comparison of Mobile Capabilities features of Flexmonster Pivot Table & Charts Component and SAP Predictive Analytics
    Feature
    Flexmonster Pivot Table & Charts Component
    10.0
    1 Ratings
    25% above category average
    SAP Predictive Analytics
    -
    Ratings
    Responsive Design for Web Access10.01 Ratings00 Ratings
    Best Alternatives
    Flexmonster Pivot Table & Charts ComponentSAP Predictive Analytics
    Small Businesses
    Cyfe
    Score4 out of 10
    No answers on this topic
    Medium-sized Companies
    Qlik Cloud Analytics (Qlik Sense)
    Score8.1 out of 10
    SAS Enterprise Guide
    Score9.4 out of 10
    Enterprises
    Sisense
    Score6.9 out of 10
    SAS Enterprise Guide
    Score9.4 out of 10
    All AlternativesView all alternativesView all alternatives
    User Ratings
    Flexmonster Pivot Table & Charts ComponentSAP Predictive Analytics
    Likelihood to Recommend
    10.0
    (1 ratings)
    9.0
    (3 ratings)
    Usability
    9.0
    (1 ratings)
    6.0
    (1 ratings)
    Support Rating
    10.0
    (1 ratings)
    7.0
    (1 ratings)
    User Testimonials
    Flexmonster Pivot Table & Charts ComponentSAP Predictive Analytics
    Likelihood to Recommend
    Flexmonster
    Fantastic product to embed in any SaaS solution for reporting and data exports. Excellent performance, ability to customize fields and tons of other features out of the box that makes it a well-rounded tool that is easy to use. To top it off their support is amazing for answering technical questions quickly and they provide great examples to learn how to interact with the code. We are very happy with our choice to use Flexmonster!
    Incentivized
    Read full review
    SAP
    It's a great tool to merge actual data analysis (which Lumira doesn't do that well) with visualization (which Lumira does well) - so it can be seen as Lumira for data analysts. However, a lot of the 'predictive' side is hidden/black box which can be frustrating for those analysts, so you could argue it is too complex for casual users, but too 'black box' for analysts.
    Incentivized
    Read full review
    Pros
    Flexmonster
    No answers on this topic
    SAP
    • It doesn't require you to have a Ph.D. to build models!
    • You can use it to address a very large and wide dataset without worrying about sampling.
    • Automation is in the product DNA. You can prepare your data, ingest it into the "Kernel", then get insights about what was found, decide to publish it and schedule scoring tasks or model refresh in the same product.
    Incentivized
    Read full review
    Cons
    Flexmonster
    No answers on this topic
    SAP
    • Working with this software is very simple and enjoyable for me as [an] IT consultant and expert, but it is a bit complicated for novice users.
    • Some big data takes more time‌to load, which I think could be faster
    Incentivized
    Read full review
    Usability
    Flexmonster
    Checks all the boxes! Easy to use, great out of the box feature set and fantastic support team
    Incentivized
    Read full review
    SAP
    the UI is a bit dated and available as a desktop tool mostly.
    Incentivized
    Read full review
    Support Rating
    Flexmonster
    Quick response to questions and feedback, excellent documentation for learning about the product and tons of examples to leverage.
    Incentivized
    Read full review
    SAP
    The documentation provides an explanation about what features are available but not necessarily what's happening behind the scenes. On the other side, the "community" has grown since the acquisition and most questions are properly addressed by SAP folks. Since the "product maintenance" mode announcement was made, there wasn't much new content published except on the Smart Predict side (which is built by the SAP Predictive Analytics team)
    Incentivized
    Read full review
    Alternatives Considered
    Flexmonster
    No answers on this topic
    SAP
    We have typically used Spotfire for data analysis but decided to move to SAP Business Objects due to its innate connection with SAP. I found Lumira to be good for visualizations but it is not meant for data analysis. Therefore, we have introduced Predictive Analytics to see if it can fill that gap. So far, it's been far less intuitive than Spotfire to get started, and as far as I am aware so far, it does not bring many additional capabilities. I do, however, like that it utilizes the Lumira look/feel and integrates very well.
    Incentivized
    Read full review
    Return on Investment
    Flexmonster
    No answers on this topic
    SAP
    • Proper forecasting increases our credibility with partners and customers
    • Forecasting determines the amount of investment in each sector and reduces the cost of additional costs
    Incentivized
    Read full review
    ScreenShots

    Flexmonster Pivot Table & Charts Component Screenshots

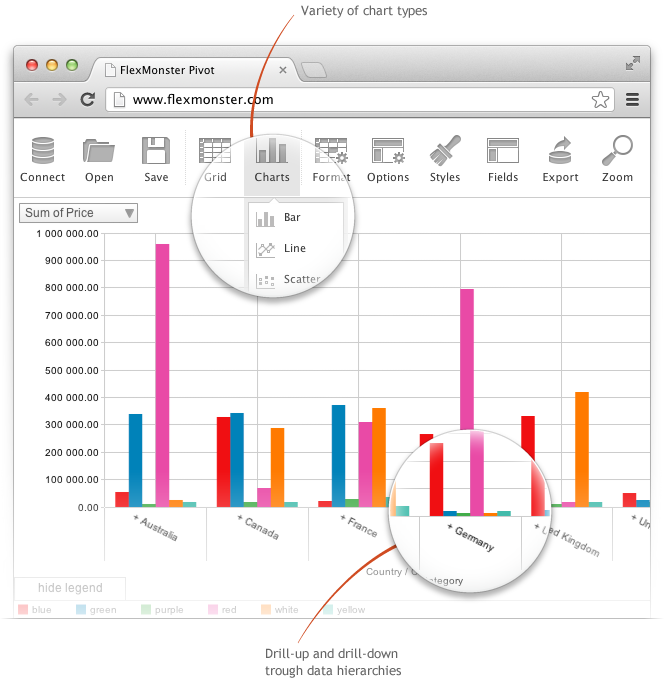
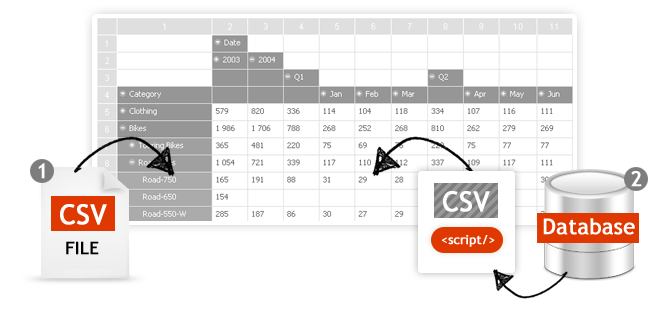
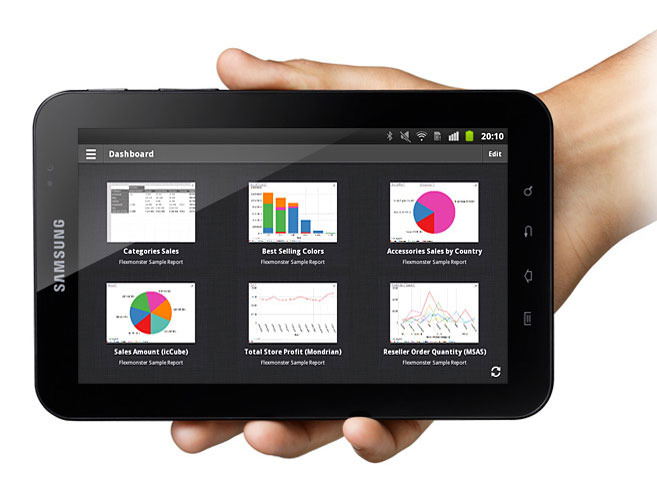
    Screenshot of Pivot Component supports the printing of the Pivot view. Additionally users can export the reports into a variety of formats.Screenshot of Pivot Table Component helps you to create interactive pivot tables and charts reports for web and Flex applications. Pivot Component will provide your customers with an extremely intuitive end-user experience while creating and analyzing reports.Screenshot of Pivot Charts provide an alternative, interactive way to visualize data.Screenshot of The component will connect to any database: MS SQL, MySQL, Oracle, PostgreSQL - using simple script generating CSV output to enable real-time business analysis. Pivot Component is full browser-side component, thus you can use any desired server-side to generate CSV data.Screenshot of Pivot Table Component can connect to OLAP cubes via XMLA protocol. XMLA is XML for Analysis - an industry standard for data access in analytical systems, such as OLAP and Data Mining.Screenshot of Start mobile business reporting with the Flexmonster mobile application. It can be downloaded to your tablets from Google Play or Apple App Store.