Grafana vs. Pandora FMS
Grafana vs. Pandora FMS
| Product | Rating | Most Used By | Product Summary | Starting Price |
|---|---|---|---|---|
 Grafana | N/A | Grafana is a data visualization tool developed by Grafana Labs in New York. It is available open source, managed (Grafana Cloud), or via an enterprise edition with enhanced features. Grafana has pluggable data source model and comes bundled with support for popular time series databases like Graphite. It also has built-in support for cloud monitoring vendors like Amazon Cloudwatch, Microsoft Azure and SQL databases like MySQL. Grafana can combine data from many places into a single dashboard. | $0 | |
 Pandora FMS | Enterprise companies (1,001+ employees) | Pandora FMS is a monitoring solution. It is presented as ideal for medium and big-sized environments with at least 100 devices. Users can monitor any device, infrastructure, application, IT as well as business processes and services. It allows business users to obtain information from their concerns in real time, visualizing the data in a direct way. The solution boasts users among companies and organizations in more than 40 countries around the world, who according… | $2,990 100 nodes |
| Grafana | Pandora FMS | |||||||||||||||
|---|---|---|---|---|---|---|---|---|---|---|---|---|---|---|---|---|
| Editions & Modules |
|
| ||||||||||||||
| Offerings |
| |||||||||||||||
| Entry-level Setup Fee | No setup fee | Required | ||||||||||||||
| Additional Details | — | Licensed for individual nodes (agents), starting from 100 nodes. | ||||||||||||||
| More Pricing Information | ||||||||||||||||
| Grafana | Pandora FMS |
|---|
| Grafana | Pandora FMS | |||||||||||||||||||||||||||||||||
|---|---|---|---|---|---|---|---|---|---|---|---|---|---|---|---|---|---|---|---|---|---|---|---|---|---|---|---|---|---|---|---|---|---|---|
| BI Standard Reporting |
| |||||||||||||||||||||||||||||||||
| Ad-hoc Reporting |
| |||||||||||||||||||||||||||||||||
| Report Output and Scheduling |
| |||||||||||||||||||||||||||||||||
| Data Discovery and Visualization |
| |||||||||||||||||||||||||||||||||
| Network Performance Monitoring |
|
| Grafana | Pandora FMS | |
|---|---|---|
| Small Businesses |  Supermetrics Score 9.8 out of 10 |  NinjaOne Score 9.1 out of 10 |
| Medium-sized Companies | Supermetrics Score 9.8 out of 10 |  SolarWinds NetFlow Traffic Analyzer (NTA) Score 9.4 out of 10 |
| Enterprises |  IBM Analytics Engine Score 7.2 out of 10 | SolarWinds NetFlow Traffic Analyzer (NTA) Score 9.4 out of 10 |
| All Alternatives | View all alternatives | View all alternatives |
| Grafana | Pandora FMS | |
|---|---|---|
| Likelihood to Recommend | 9.3 (7 ratings) | 9.0 (2 ratings) |
| Likelihood to Renew | - (0 ratings) | 9.0 (1 ratings) |
| Usability | 9.6 (3 ratings) | 9.0 (1 ratings) |
| Support Rating | - (0 ratings) | 9.0 (2 ratings) |
| Implementation Rating | - (0 ratings) | 8.0 (1 ratings) |
| Grafana | Pandora FMS | |
|---|---|---|
| Likelihood to Recommend | Grafana Labs
| Pandora FMS LLC
 Vctor Carrin Hontoria Sysadmin |
| Pros | Grafana Labs
| Pandora FMS LLC
 Guillermo Sanchez CEO, CTO & Co-Fundador |
| Cons | Grafana Labs
 ANurag Tamrakar Software Engineer - DevOps | Pandora FMS LLC
Vctor Carrin Hontoria Sysadmin |
| Usability | Grafana Labs
| Pandora FMS LLC
Vctor Carrin Hontoria Sysadmin |
| Support Rating | Grafana Labs No answers on this topic | Pandora FMS LLC
Guillermo Sanchez CEO, CTO & Co-Fundador |
| Alternatives Considered | Grafana Labs
| Pandora FMS LLC
Guillermo Sanchez CEO, CTO & Co-Fundador |
| Return on Investment | Grafana Labs
| Pandora FMS LLC
Vctor Carrin Hontoria Sysadmin |
| ScreenShots | Pandora FMS Screenshots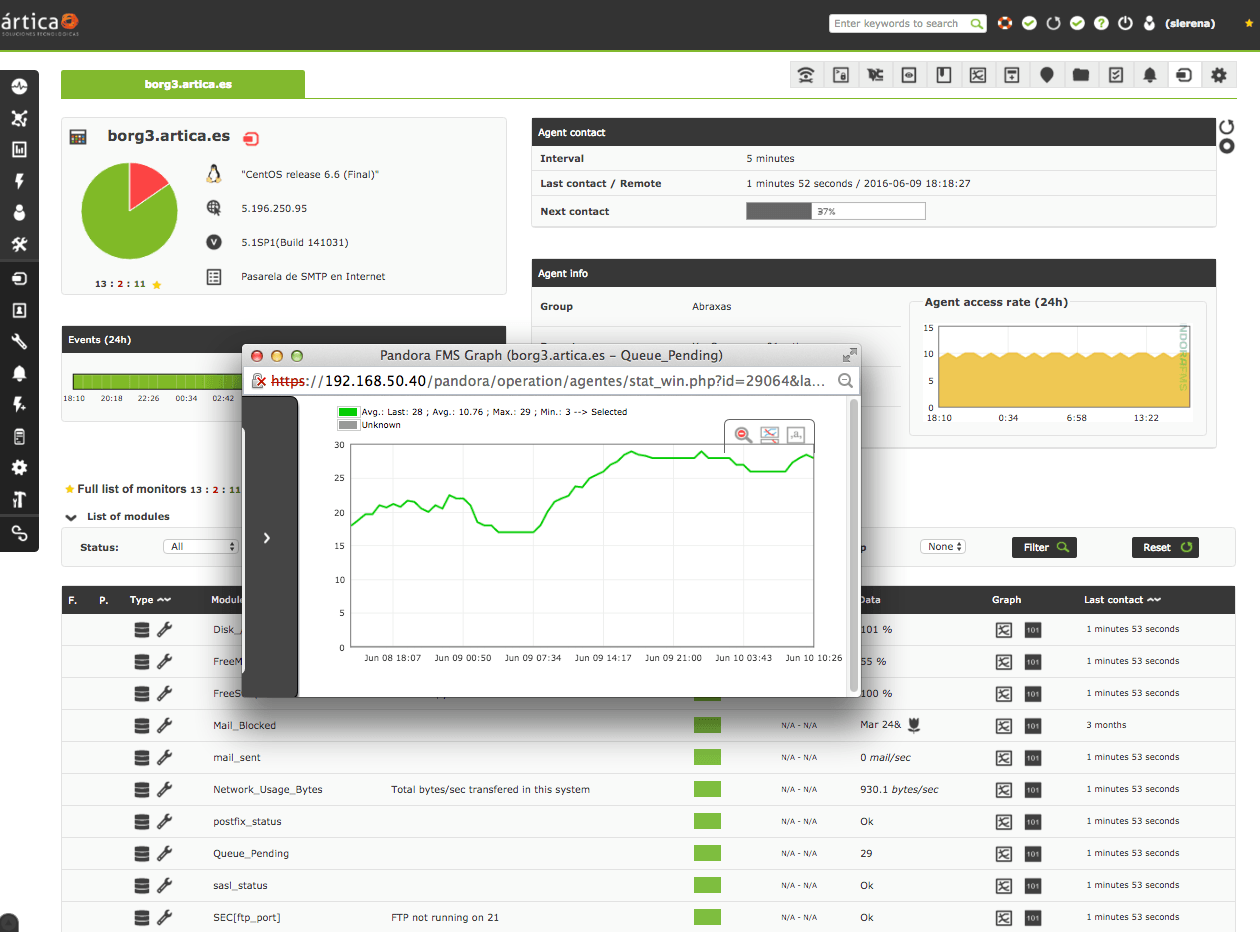   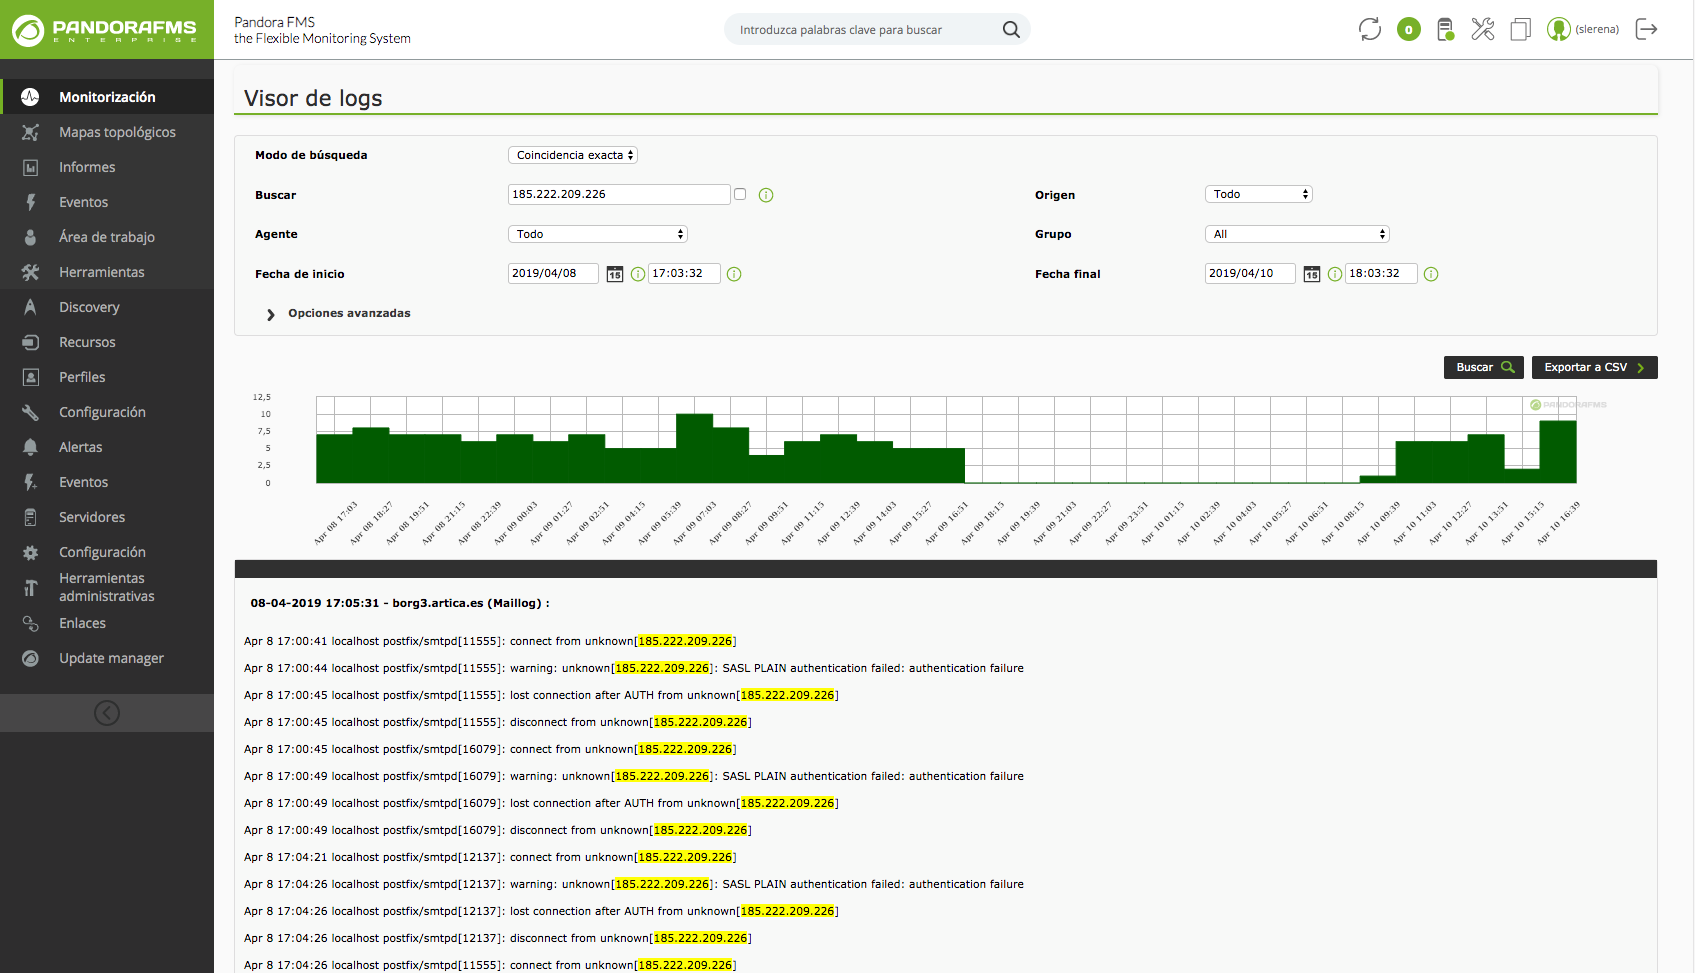   |