Idera DB Optimizer vs. Releem
Idera DB Optimizer vs. Releem
| Product | Rating | Most Used By | Product Summary | Starting Price |
|---|---|---|---|---|
 Idera DB Optimizer | N/A | Optimize database SQL queries for multiple platforms from a single user interface Streamline tuning of SQL code on major DBMSs from one interface Tune SQL with automated performance optimization suggestions Tackle SQL queries with visual SQL tuning diagrams Pinpoint problem SQL with database profiling of wait-time analysis Load test alternative SQL queries in simulated production environment | N/A | |
 Releem | N/A | Database performance management was a major pain point for developers: sifting through endless metrics and alerts, calculating variables, dealing with tons of documentation, query optimization, and index management. Releem is an AI-powered MySQL performance monitoring tool that helps keep database servers fast, secure and reliable. According to the vendor, its features beyond database performance monitoring and management include: 📊 Quick and simple to use with all the… | $0 per month 1 DB instance |
| Idera DB Optimizer | Releem | |||||||||||||||
|---|---|---|---|---|---|---|---|---|---|---|---|---|---|---|---|---|
| Editions & Modules | No answers on this topic |
| ||||||||||||||
| Offerings |
| |||||||||||||||
| Entry-level Setup Fee | No setup fee | Optional | ||||||||||||||
| Additional Details | — | 25% discount for annual plan. | ||||||||||||||
| More Pricing Information | ||||||||||||||||
| Idera DB Optimizer | Releem | |
|---|---|---|
| ScreenShots | Releem Screenshots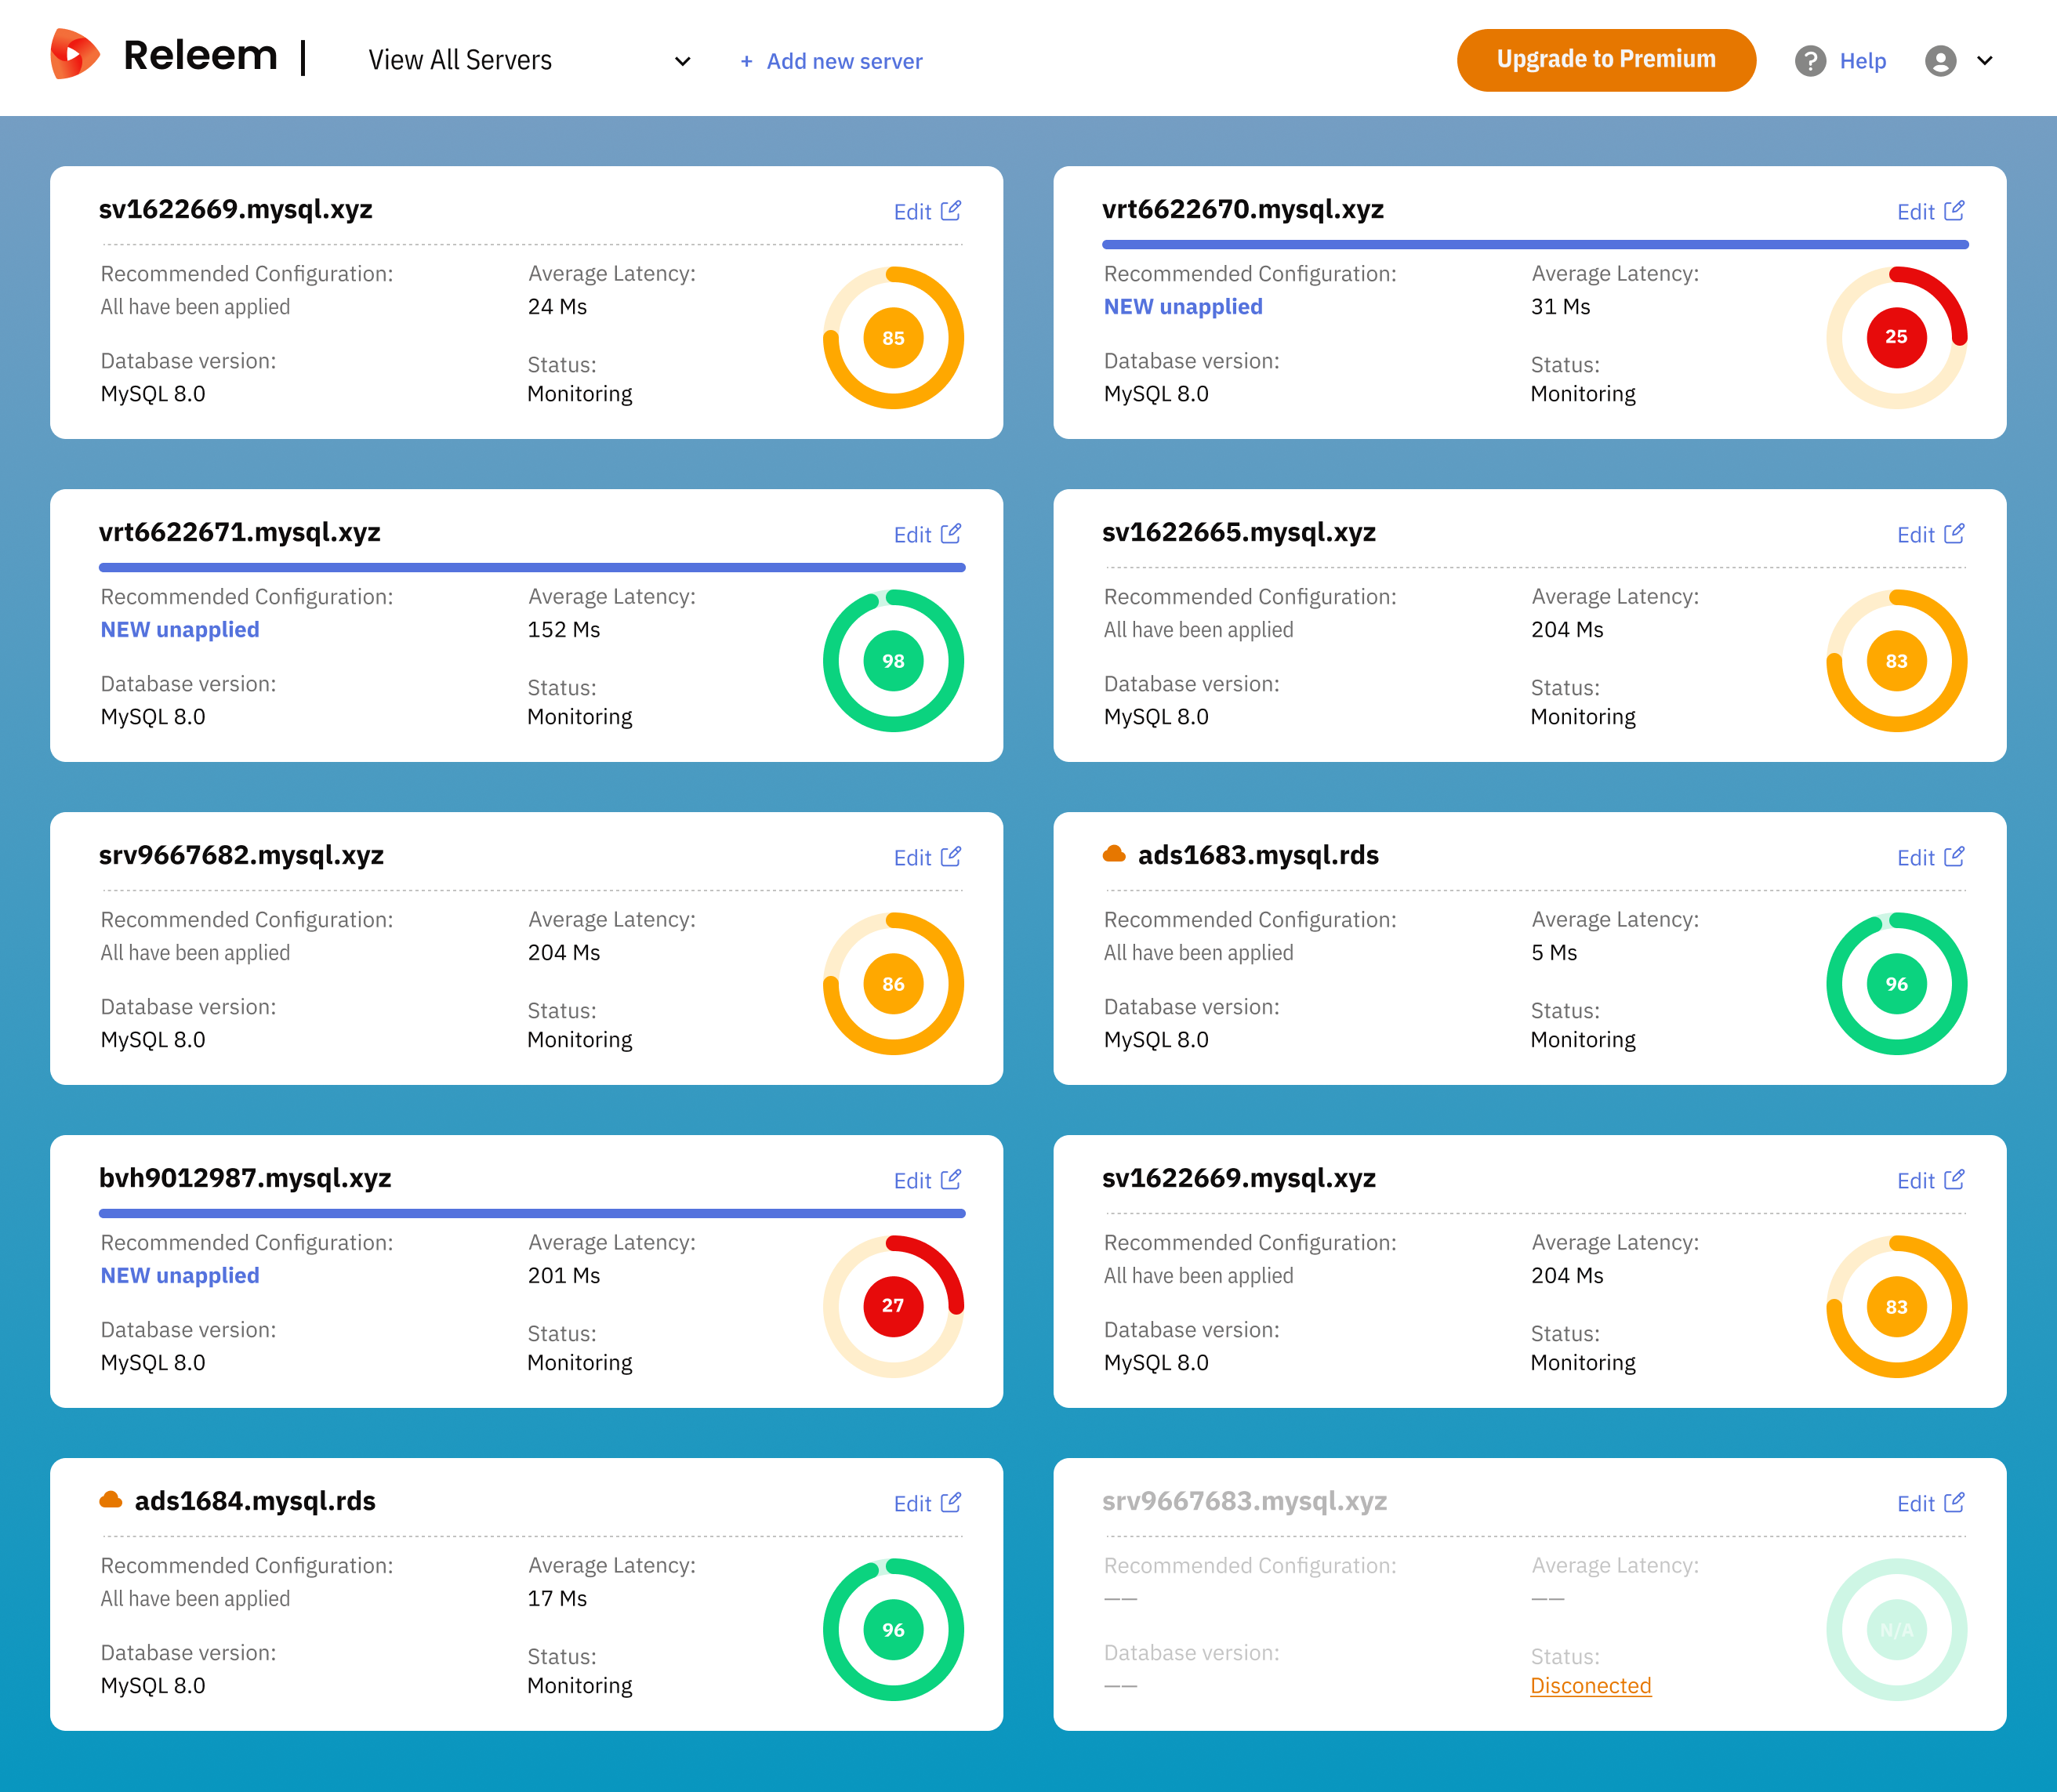 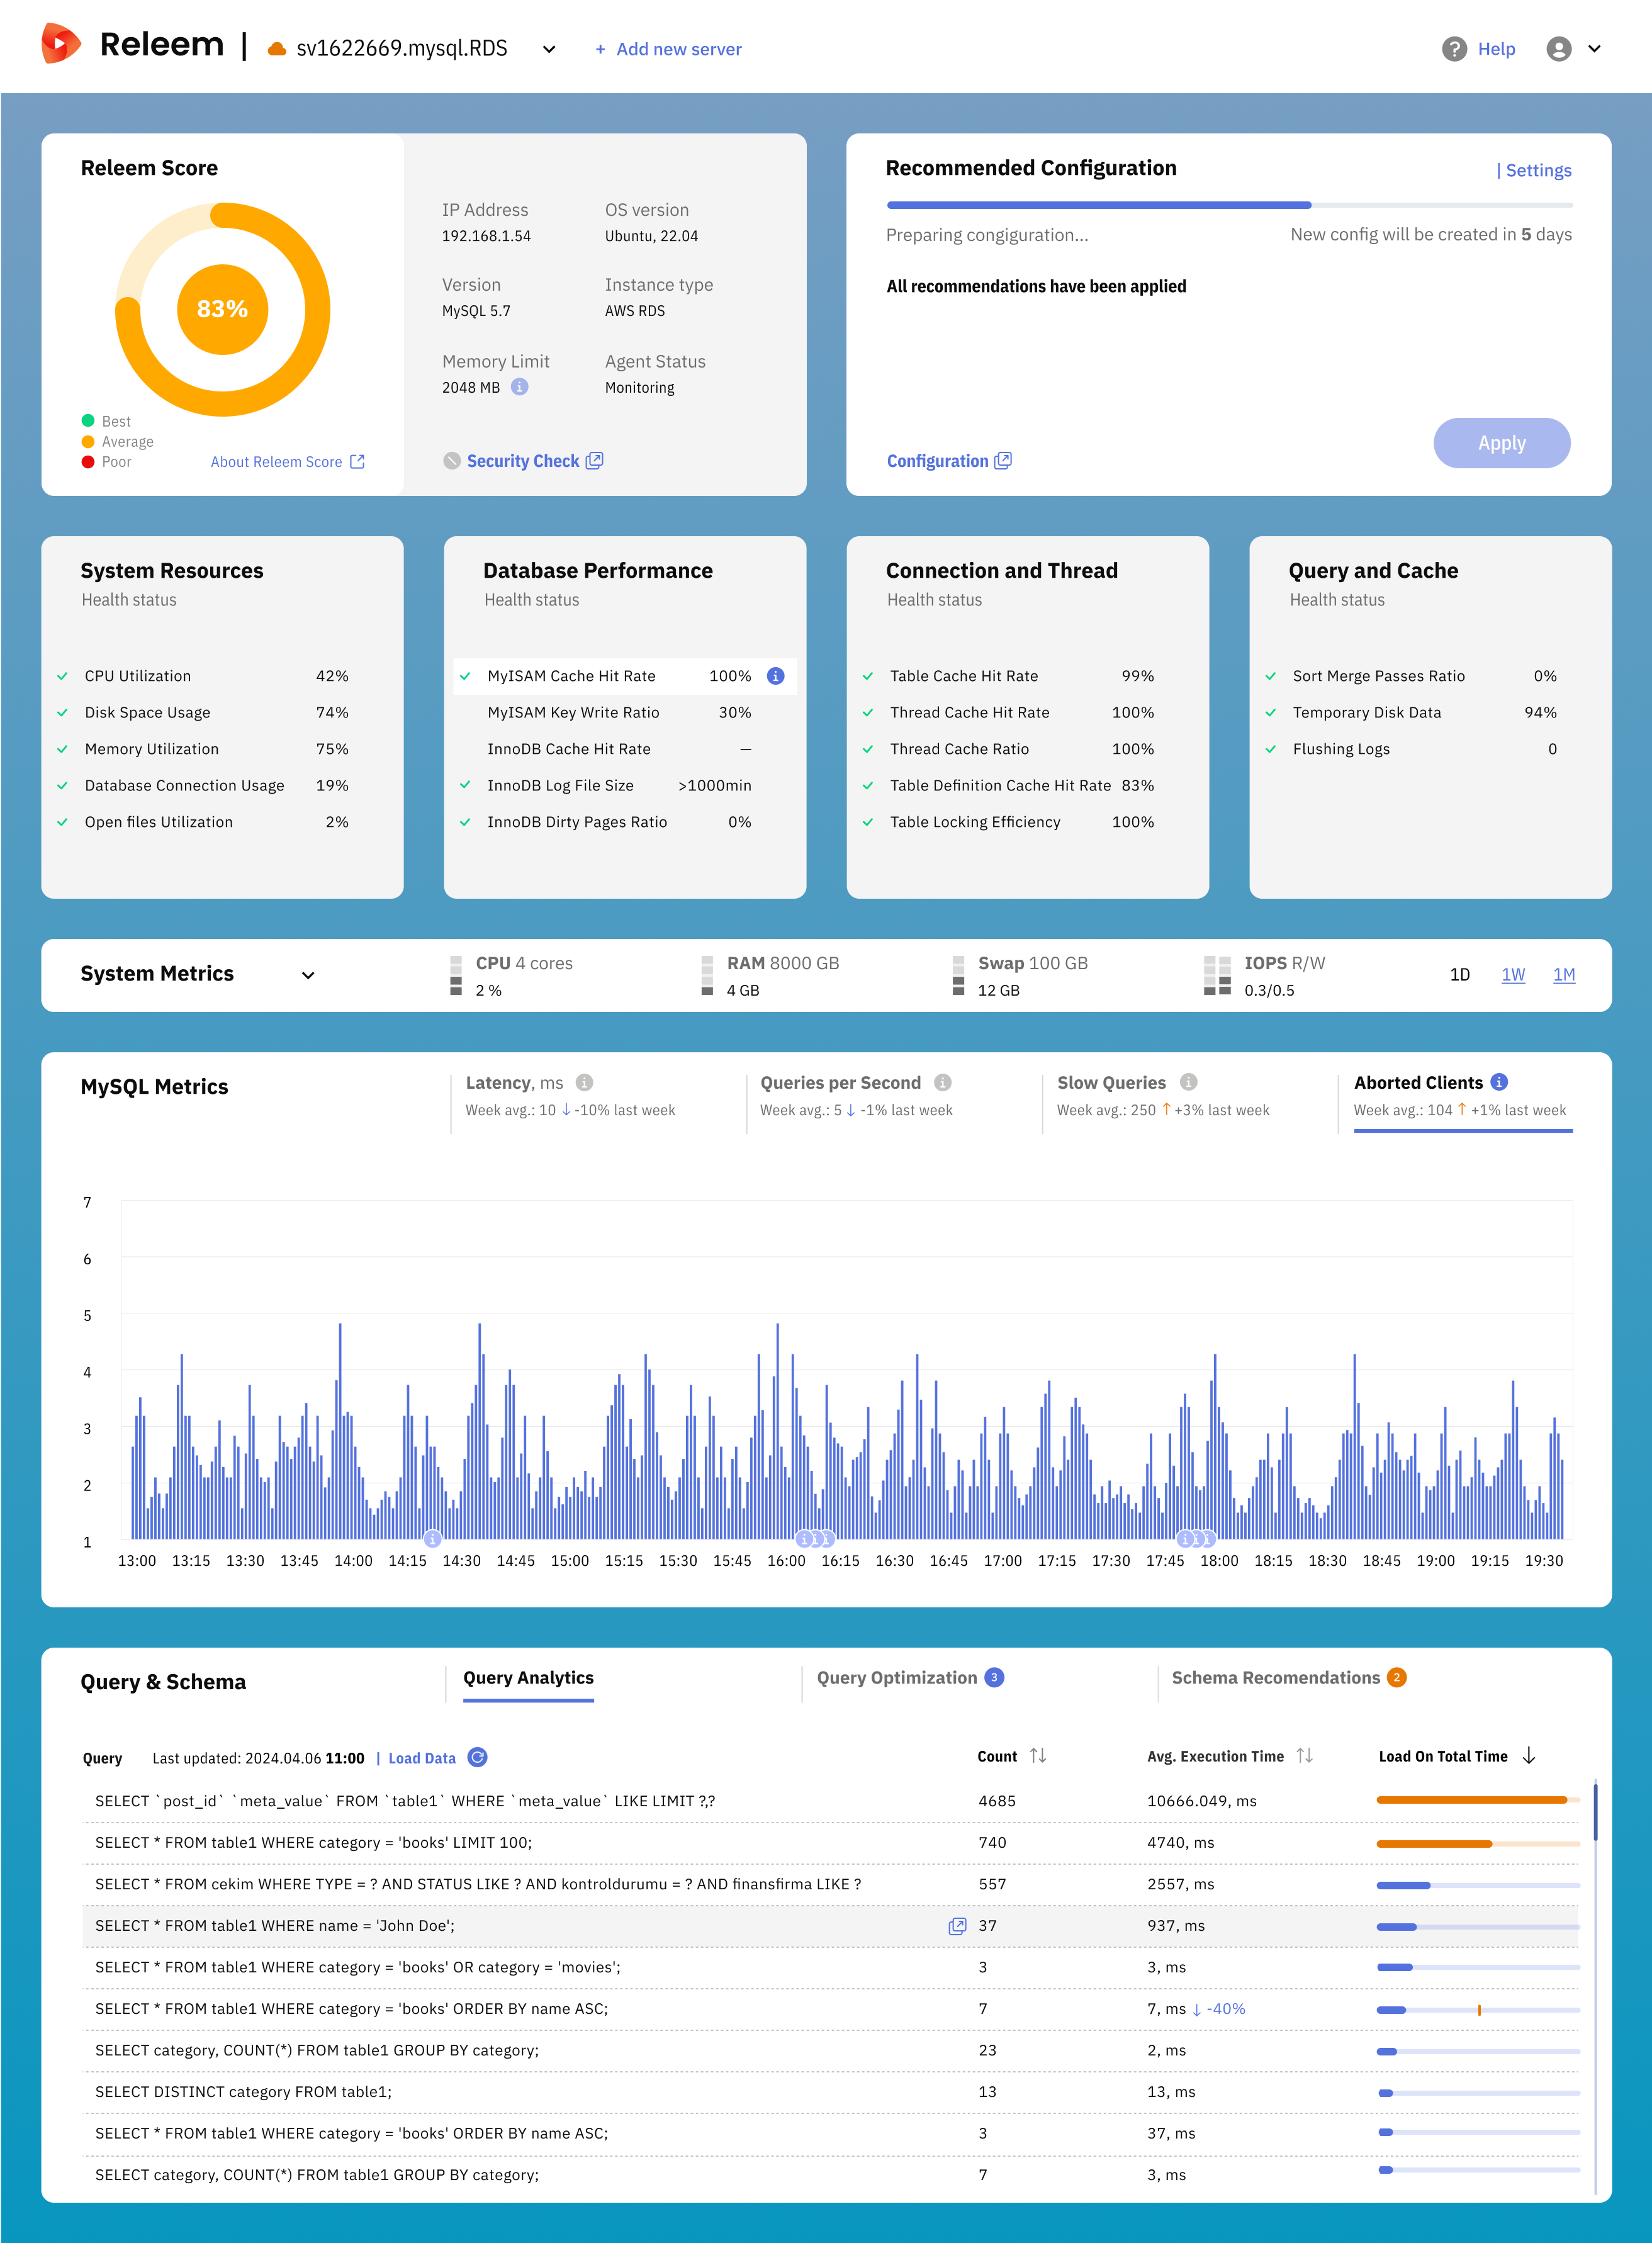 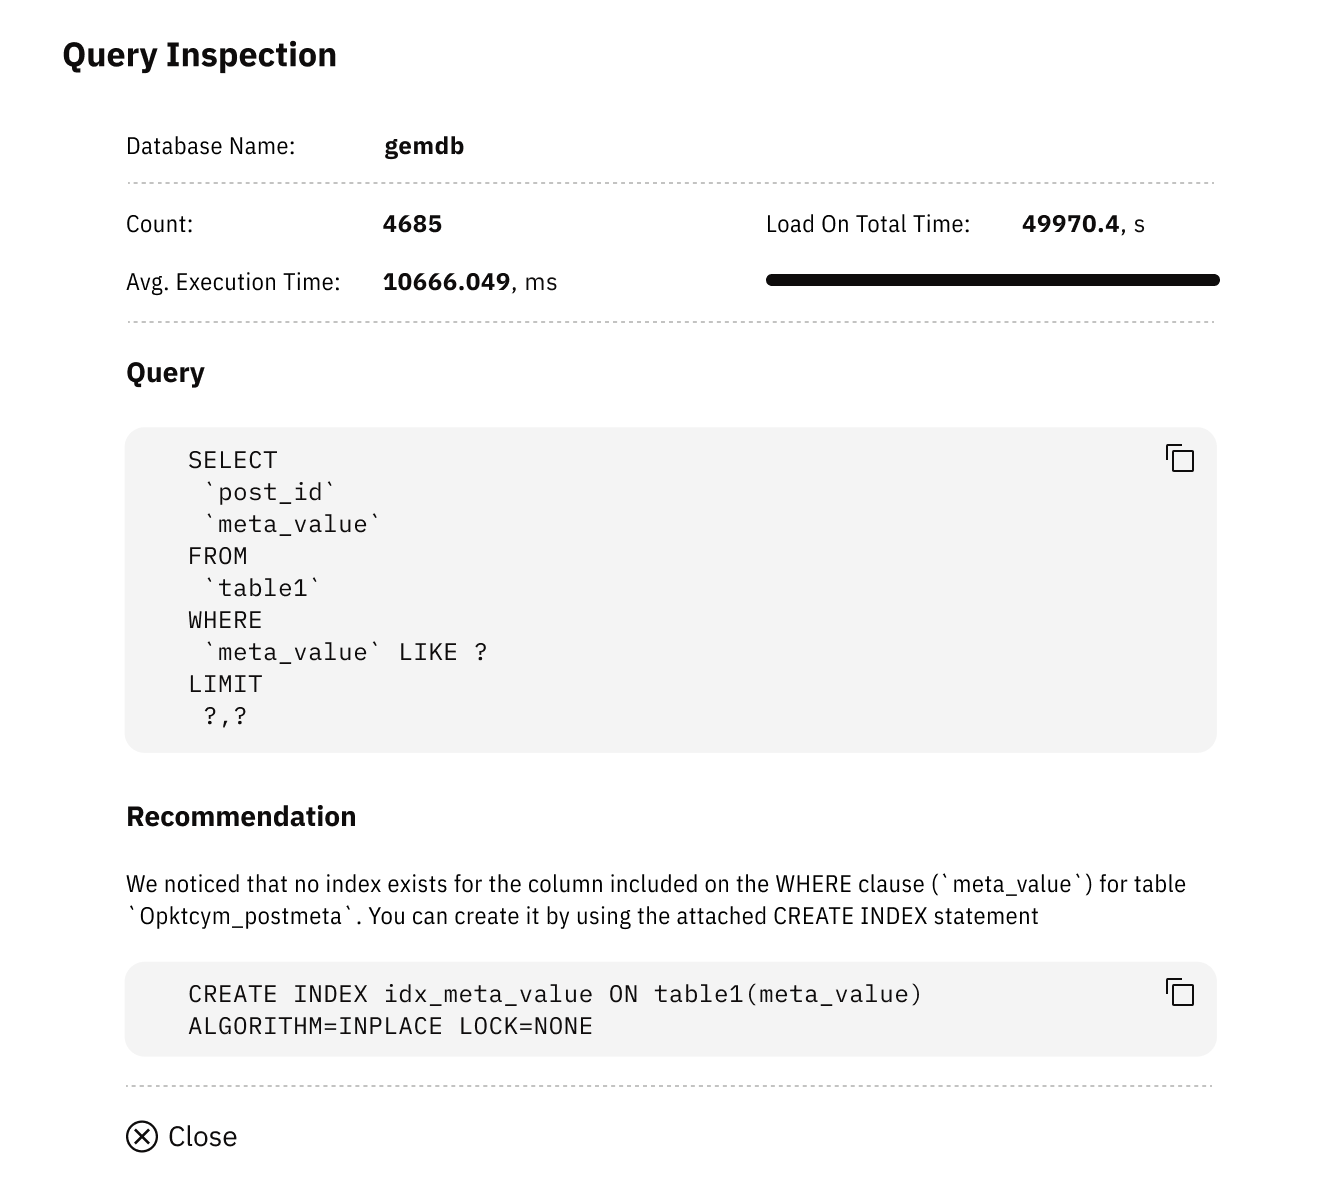 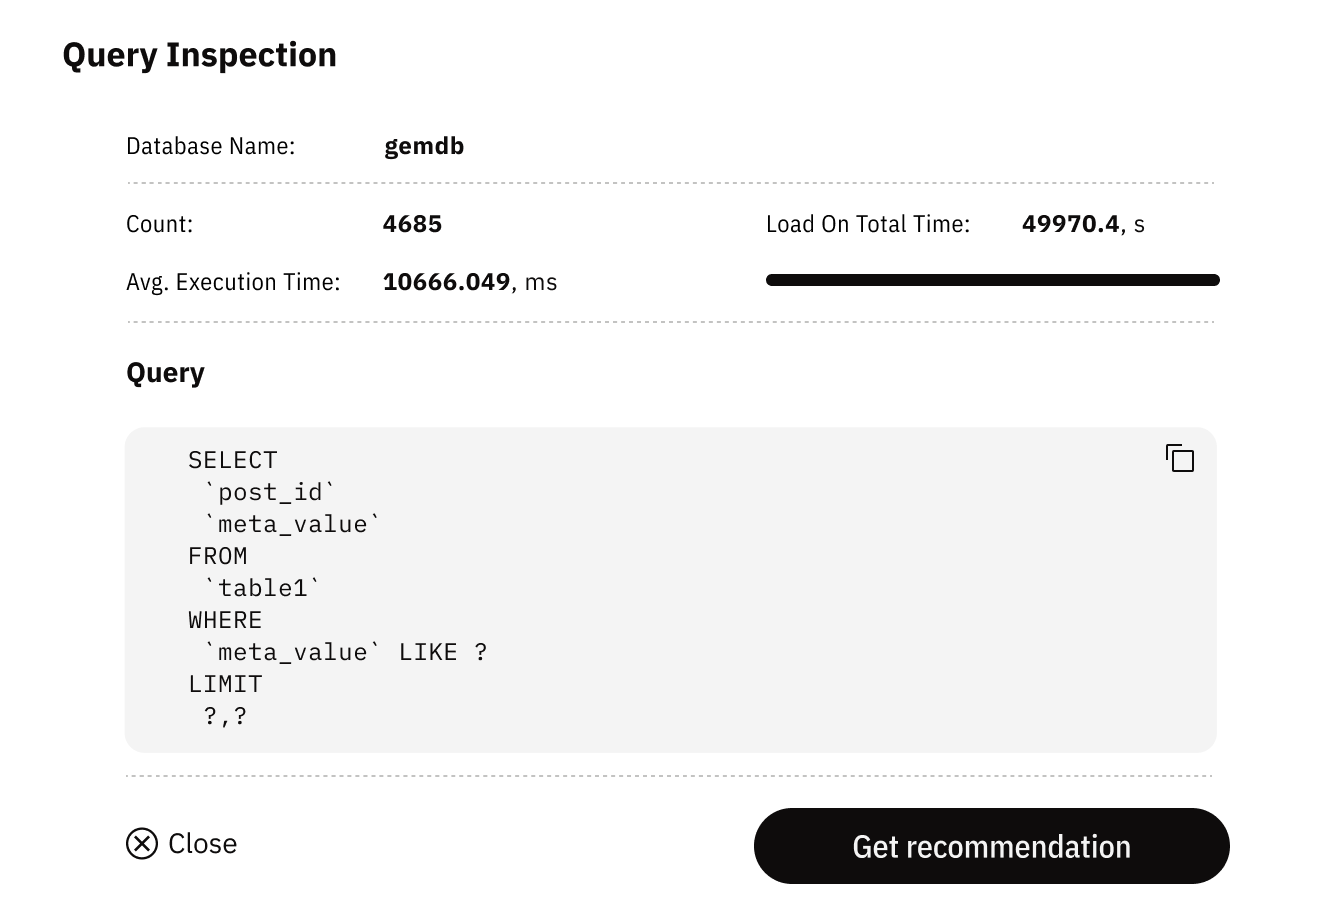 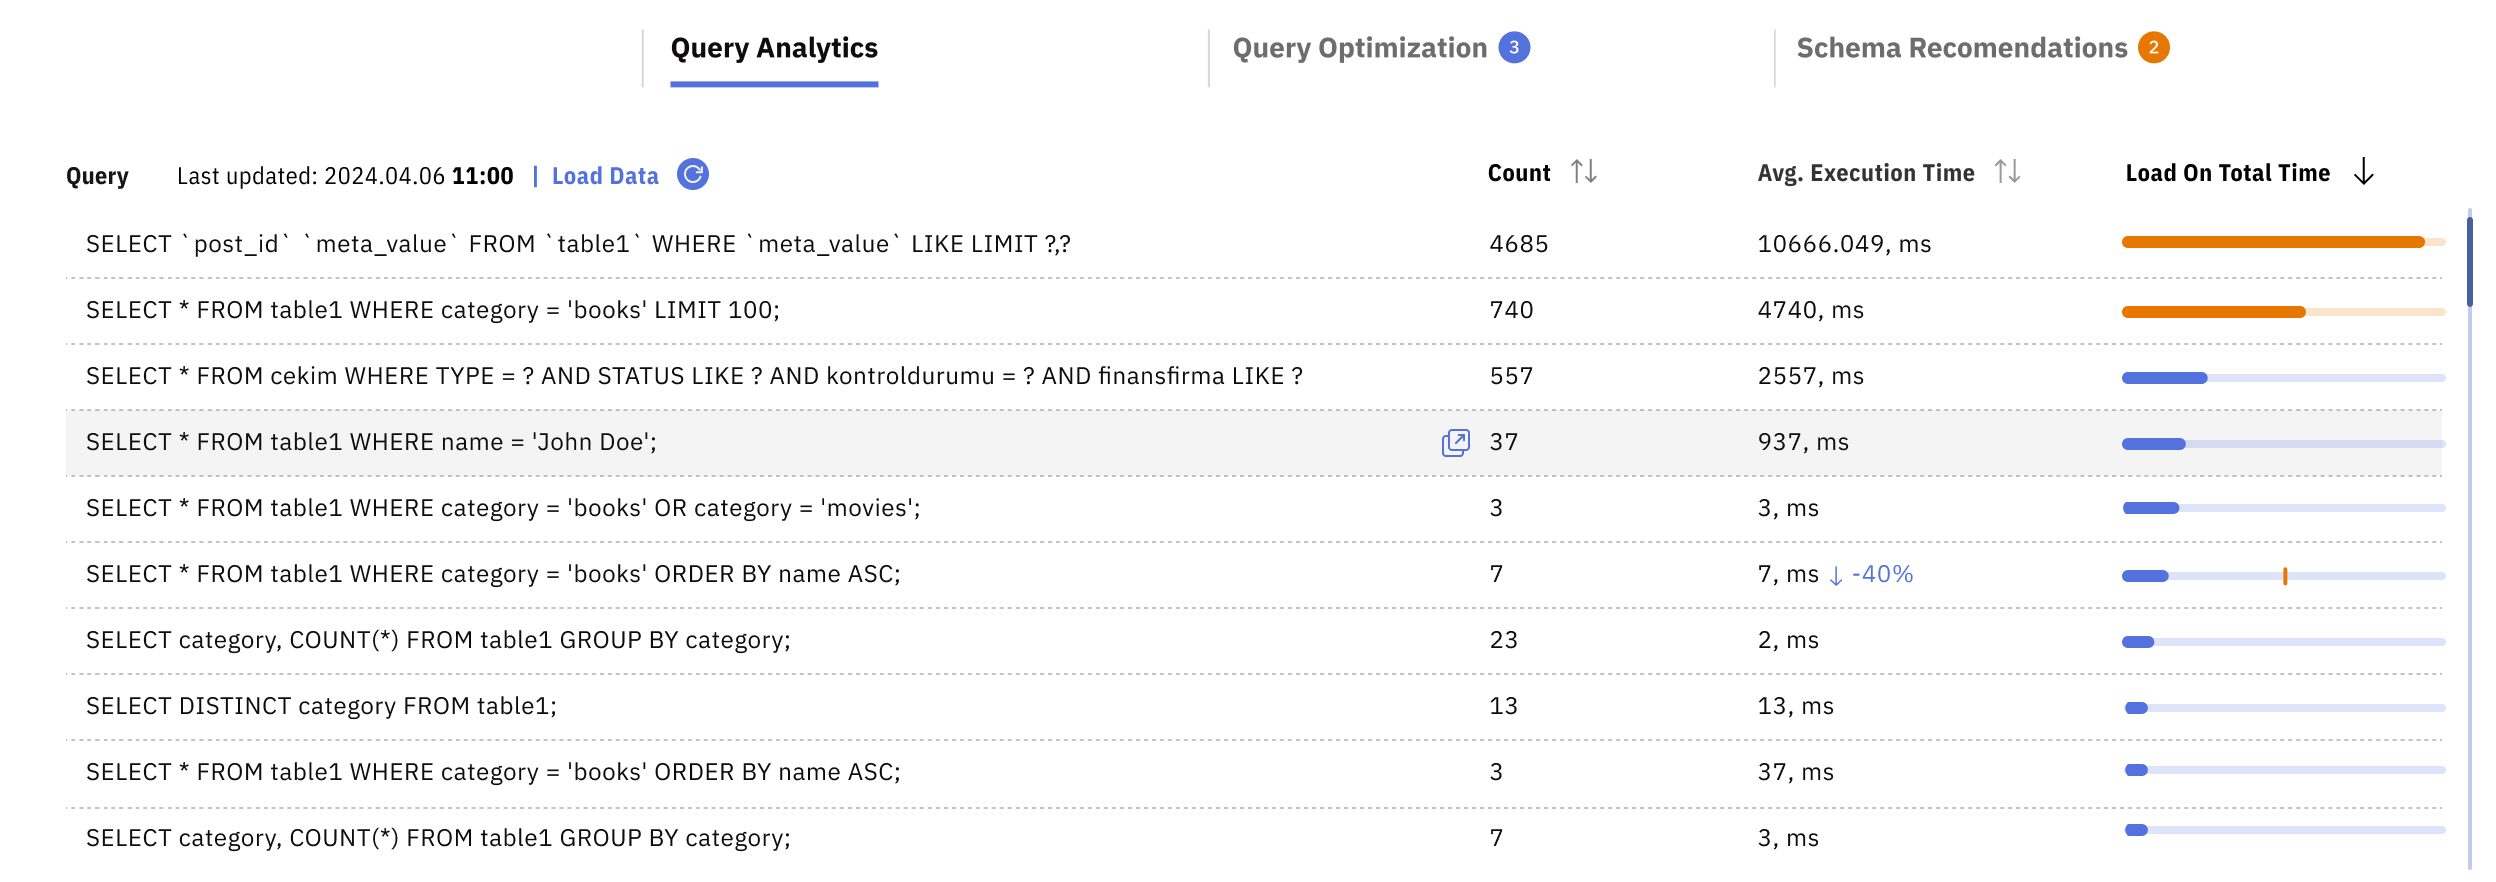 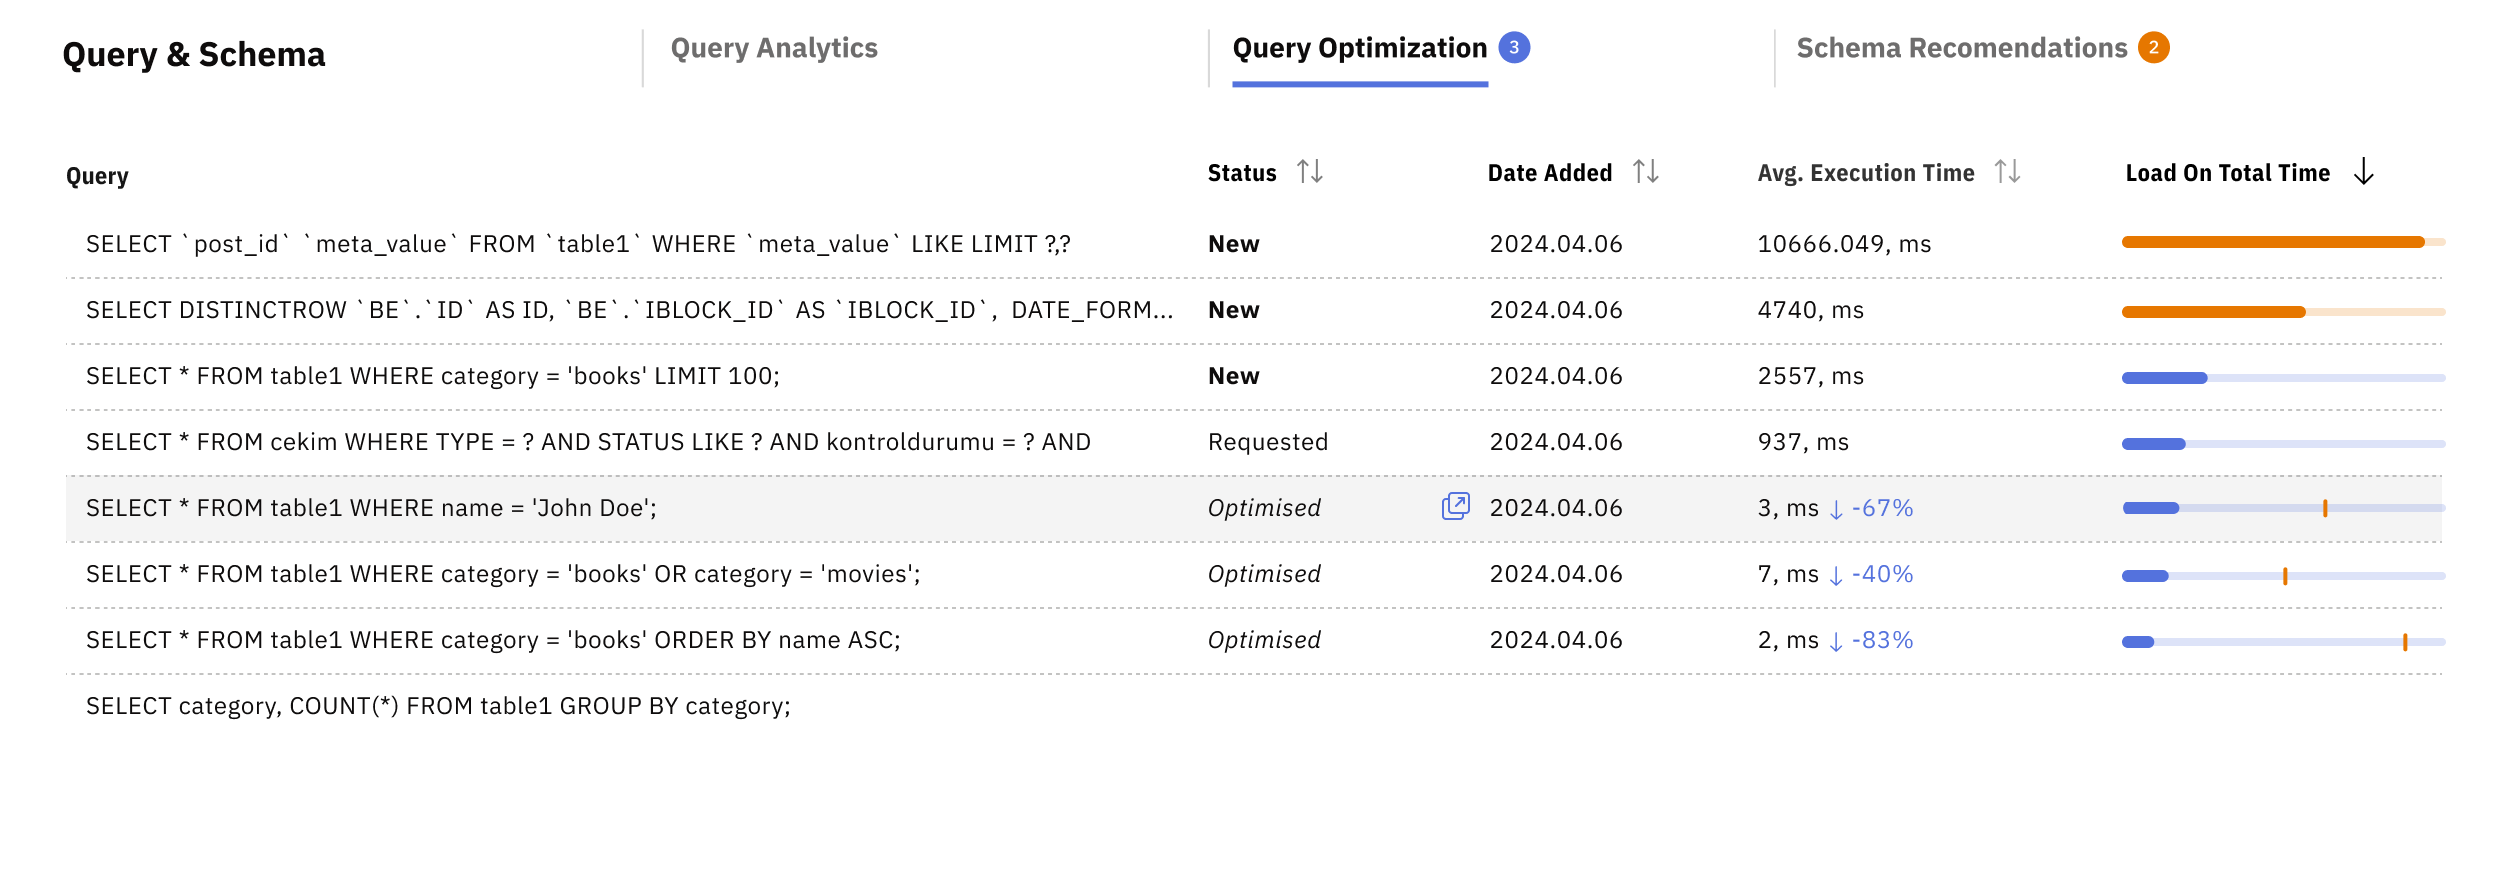 |