TrustRadius: an HG Insights company

Save this comparison

Save this comparison

Add Product

Recommended Comparisons

    Overview
    ProductRatingMost Used ByProduct SummaryStarting Price

    Logi Report

    Score9 out of 10
    N/ALogi Report (formerly JReport) is an embedded reporting platform provides developers and users with advanced pixel perfect, operational reporting capabilities for any data source. According to the vendor, JReport delivers insights for hundreds of thousands of users at over 10,000 installations worldwide. The vendor's goal is to empower ISVs and enterprise companies to embed the most sophisticated reports and dashboards into web applications. JReport developer Jinfonet…N/A

    Powerslide

    Score9.5 out of 10
    N/ACreated in 2019, Powerslide is a data storytelling and data visualization solution. This software helps business users to create usages around data. Powerslide is a solution for data analysis, visualization and presentation. Interactive and collaborative, Powerslide aims to answer data issues in a simple, practical and design interface, and help users simplify the analysis and communication of…N/A
    Pricing
    Logi ReportPowerslide
    Editions & Modules
    No answers on this topic
    No answers on this topic
    Offerings
    Pricing Offerings
    Logi ReportPowerslide
    Free Trial
    YesYes
    Free/Freemium Version
    NoNo
    Premium Consulting/Integration Services
    YesNo
    Entry-level Setup FeeOptionalOptional
    Additional Details—Our rates are flexible and adapt to the size and use of your organization. Contact us and let’s discuss about it.
    More Pricing Information
    Features
    Logi ReportPowerslide
    BI Standard Reporting
    Comparison of BI Standard Reporting features of Logi Report and Powerslide
    Feature
    Logi Report
    8.8
    6 Ratings
    20% above category average
    Powerslide
    8.8
    2 Ratings
    9% above category average
    Pixel Perfect reports8.55 Ratings8.52 Ratings
    Customizable dashboards9.16 Ratings9.02 Ratings
    Report Formatting Templates8.86 Ratings9.02 Ratings
    Ad-hoc Reporting
    Comparison of Ad-hoc Reporting features of Logi Report and Powerslide
    Feature
    Logi Report
    9.4
    6 Ratings
    19% above category average
    Powerslide
    9.5
    2 Ratings
    19% above category average
    Drill-down analysis9.16 Ratings9.52 Ratings
    Formatting capabilities9.16 Ratings00 Ratings
    Report sharing and collaboration9.46 Ratings9.52 Ratings
    Data Discovery and Visualization
    Comparison of Data Discovery and Visualization features of Logi Report and Powerslide
    Feature
    Logi Report
    8.8
    6 Ratings
    13% above category average
    Powerslide
    9.0
    2 Ratings
    15% above category average
    Pre-built visualization formats (heatmaps, scatter plots etc.)9.56 Ratings00 Ratings
    Location Analytics / Geographic Visualization9.25 Ratings9.02 Ratings
    Predictive Analytics7.63 Ratings00 Ratings
    Access Control and Security
    Comparison of Access Control and Security features of Logi Report and Powerslide
    Feature
    Logi Report
    9.3
    6 Ratings
    20% above category average
    Powerslide
    -
    Ratings
    Multi-User Support (named login)9.66 Ratings00 Ratings
    Role-Based Security Model9.66 Ratings00 Ratings
    Multiple Access Permission Levels (Create, Read, Delete)9.66 Ratings00 Ratings
    Single Sign-On (SSO)8.45 Ratings00 Ratings
    Application Program Interfaces (APIs) / Embedding
    Comparison of Application Program Interfaces (APIs) / Embedding features of Logi Report and Powerslide
    Feature
    Logi Report
    9.3
    5 Ratings
    25% above category average
    Powerslide
    -
    Ratings
    REST API10.01 Ratings00 Ratings
    Javascript API9.14 Ratings00 Ratings
    iFrames8.63 Ratings00 Ratings
    Java API8.95 Ratings00 Ratings
    Report Output and Scheduling
    Comparison of Report Output and Scheduling features of Logi Report and Powerslide
    Feature
    Logi Report
    -
    Ratings
    Powerslide
    9.2
    2 Ratings
    12% above category average
    Publish to Web00 Ratings9.02 Ratings
    Publish to PDF00 Ratings9.52 Ratings
    Report Versioning00 Ratings9.01 Ratings
    Best Alternatives
    Logi ReportPowerslide
    Small Businesses
    GoodData.AI
    Score8.8 out of 10
    Chartio (discontinued)
    Score7.5 out of 10
    Medium-sized Companies
    Reveal
    Score10 out of 10
    Jet Reports
    Score9.5 out of 10
    Enterprises
    Microsoft Power BI Embedded
    Score8 out of 10
    Kibana
    Score8.4 out of 10
    All AlternativesView all alternativesView all alternatives
    User Ratings
    Logi ReportPowerslide
    Likelihood to Recommend
    9.0
    (7 ratings)
    9.5
    (2 ratings)
    Data Sharing and Collaboration
    9.5
    (6 ratings)
    -
    (0 ratings)
    Data Sources
    9.4
    (6 ratings)
    -
    (0 ratings)
    User Testimonials
    Logi ReportPowerslide
    Likelihood to Recommend
    Insightsoftware, Inc
    JReport is well suited to enterprise-wide deployment such as we deliver in our data warehouse solution JOHO OneSource(TM). It provides for a seamless end-user experience to enterprise-wide corporate data, maintain user-level security regardless of location or device used. Reporting elements are always "business-friendly", reducing confusion for the less sophisticated information consumer. Since JReport is highly scalable, it is hard to imagine a deployment where it would not be well suited. The only case I can think of is possibly one where there are limited or no reporting staff onsite to create report elements.
    Read full review
    Datarocks
    It has allowed us as an organization to clearly deliver our numbers to our collaborators, but above all to the heads of our teams and company. Not being entirely professional, it is easy to use for someone who does not understand the function of these numbers or hard data.
    Incentivized
    Read full review
    Pros
    Insightsoftware, Inc
    • Creates powerful reports and charts
    • Highly customizable and can fit multiple needs
    • Distributed Architecture offers higher reliability and avoids single point of failure
    Incentivized
    Read full review
    Datarocks
    • Collaborative fractures helped a lot.
    • Dashboards are really unique.
    Read full review
    Cons
    Insightsoftware, Inc
    • Initially, the product lacked some features but their support team reacted quickly to meet our needs.
    • The JReport desktop designer looks a bit dated, however, the Web GUI looks very modern.
    Read full review
    Datarocks
    • Increase the variety of fonts
    • Make templates less serious or business
    Incentivized
    Read full review
    Alternatives Considered
    Insightsoftware, Inc
    We have been using Logi Report for many years. We did review Microsoft PowerBI recently and are currently considering if it will meet our needs. We are still evaluating at the moment.
    Incentivized
    Read full review
    Datarocks
    Powerslide stands out for having templates that help you easily organize hard data and more delicate information such as numbers and statistics. By having many ways to present and edit it in one place, it makes this a page with variety and empathy with its user.
    Incentivized
    Read full review
    Return on Investment
    Insightsoftware, Inc
    • Handy dashboard
    • Create reports in various formats
    • Would like to see a longer listing of reports per screen on the scheduler in JReport Server/Admin Console as we have a lot of reports we run.
    Incentivized
    Read full review
    Datarocks
    • Our collaborators do not get bored in meetings and even if it is a lot of information, seeing it in an interesting design makes them pay attention and like to be informed of the numbers they manage to obtain with their work.
    Incentivized
    Read full review
    ScreenShots

    Logi Report Screenshots

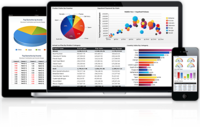
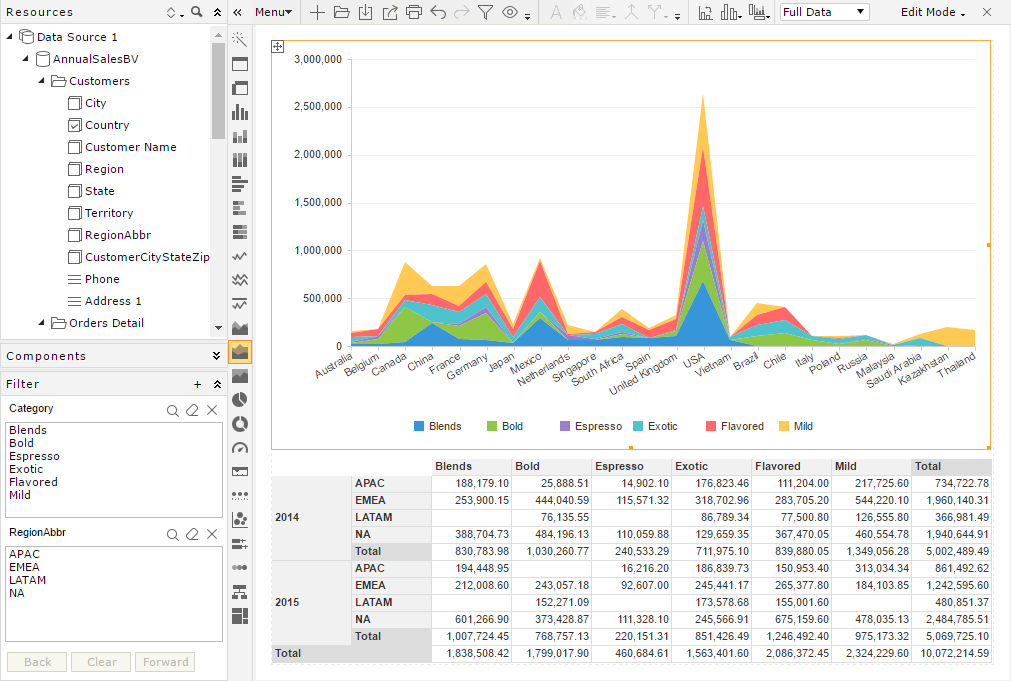
    Product screenshotProduct screenshotProduct screenshotProduct screenshotProduct screenshotProduct screenshot

    Powerslide Screenshots

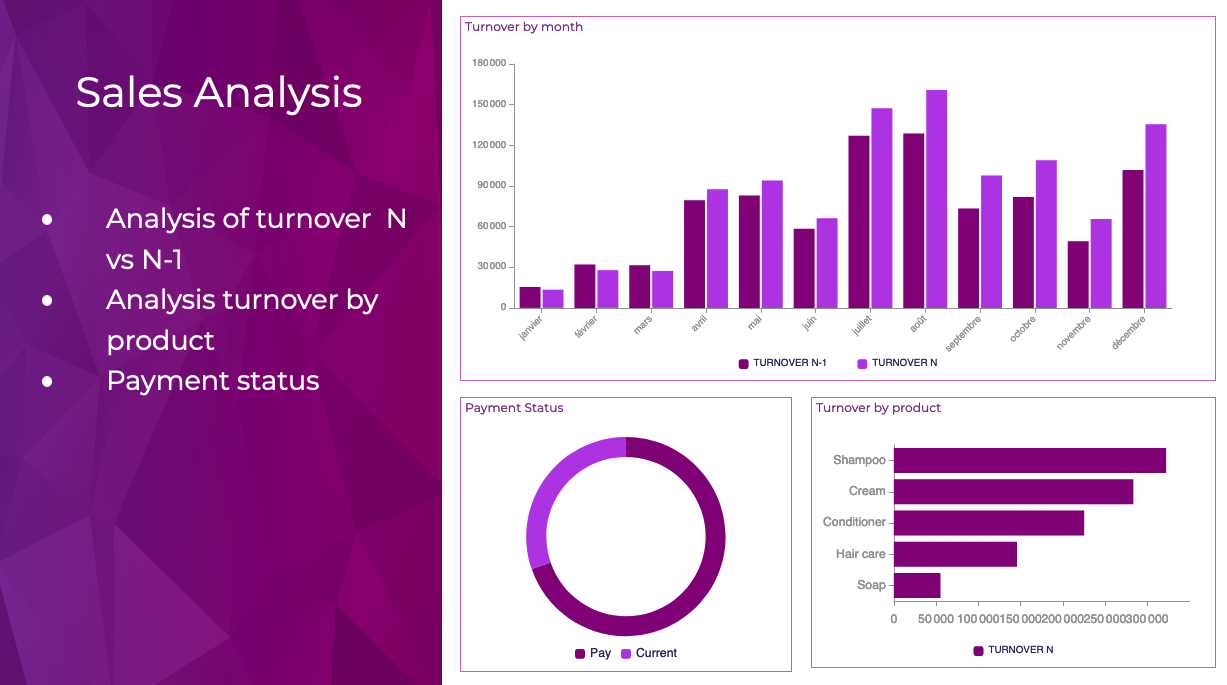
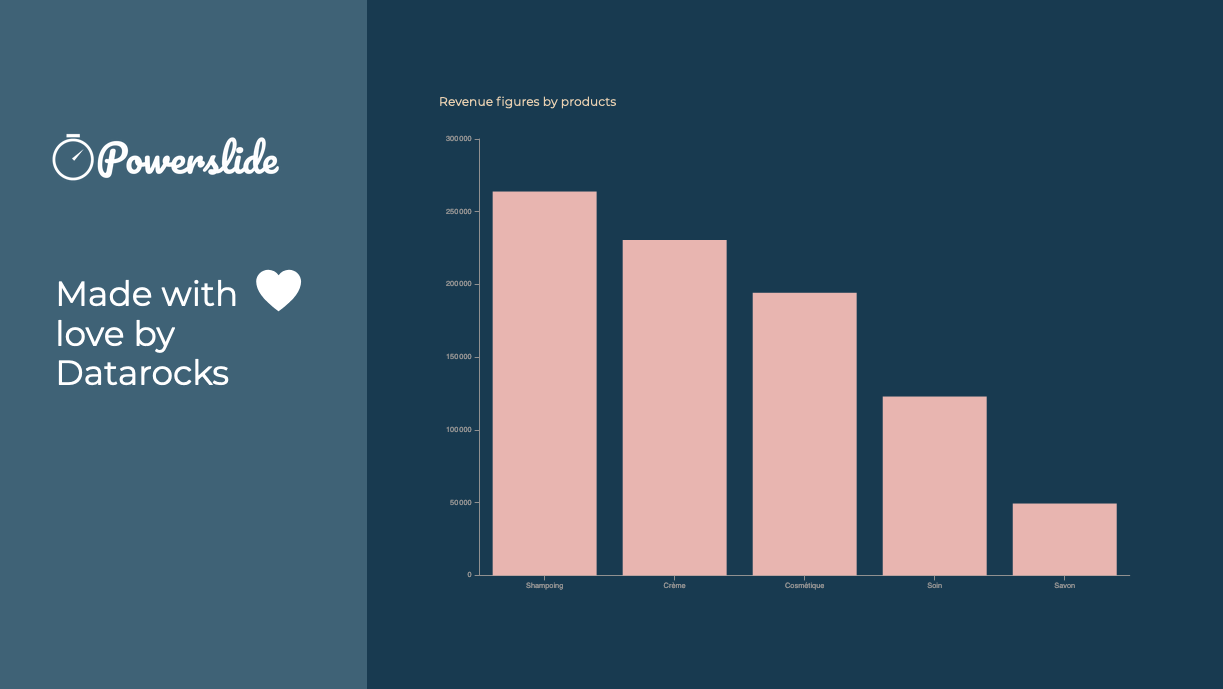
    Screenshot of Reporting and dashboards have never been easier to achieve. Interactive, Powerslide takes you to the heart of your data and helps you take better decisions. Simple to use, you can build your graphics in seconds with drag-and-drop and let our suggestion algorithms guide you.Screenshot of Powerslide complies to your graphic chart. Define your color palette and Powerslide takes care of the rest.Screenshot of Powerslide is THE solution provided with love by DatarocksScreenshot of Take advantage of real-time collaboration to work as a team on the same project. Time-saving and flexibility await you !