orgvue vs. Plumsail Org Chart
orgvue vs. Plumsail Org Chart
| Product | Rating | Most Used By | Product Summary | Starting Price |
|---|---|---|---|---|
 orgvue | Enterprise companies (1,001+ employees) | orgvue is an organizational design and workforce planning platform. orgvue enables businesses to analyze, design, plan and monitor their organizations as they change and grow. | N/A | |
 Plumsail Org Chart | N/A | A tool used to create interactive org charts for businesses of all sizes in SharePoint, Microsoft Teams and on-premises editions (SE, 2019, 2016, others). Displayed as a tab is the organizational structure for teams and departments in Microsoft Teams channels. Each department channel may have a separate org structure tab. | $30 per month |
| orgvue | Plumsail Org Chart | |||||||||||||||
|---|---|---|---|---|---|---|---|---|---|---|---|---|---|---|---|---|
| Editions & Modules | No answers on this topic |
| ||||||||||||||
| Offerings |
| |||||||||||||||
| Entry-level Setup Fee | Optional | No setup fee | ||||||||||||||
| Additional Details | — | — | ||||||||||||||
| More Pricing Information | ||||||||||||||||
| orgvue | Plumsail Org Chart |
|---|
| orgvue | Plumsail Org Chart | |
|---|---|---|
| Small Businesses |  Canva Score 9.1 out of 10 | Canva Score 9.1 out of 10 |
| Medium-sized Companies | Canva Score 9.1 out of 10 | Canva Score 9.1 out of 10 |
| Enterprises |  Lucid Visual Collaboration Suite Score 8.8 out of 10 | Lucid Visual Collaboration Suite Score 8.8 out of 10 |
| All Alternatives | View all alternatives | View all alternatives |
| orgvue | Plumsail Org Chart | |
|---|---|---|
| ScreenShots | orgvue Screenshots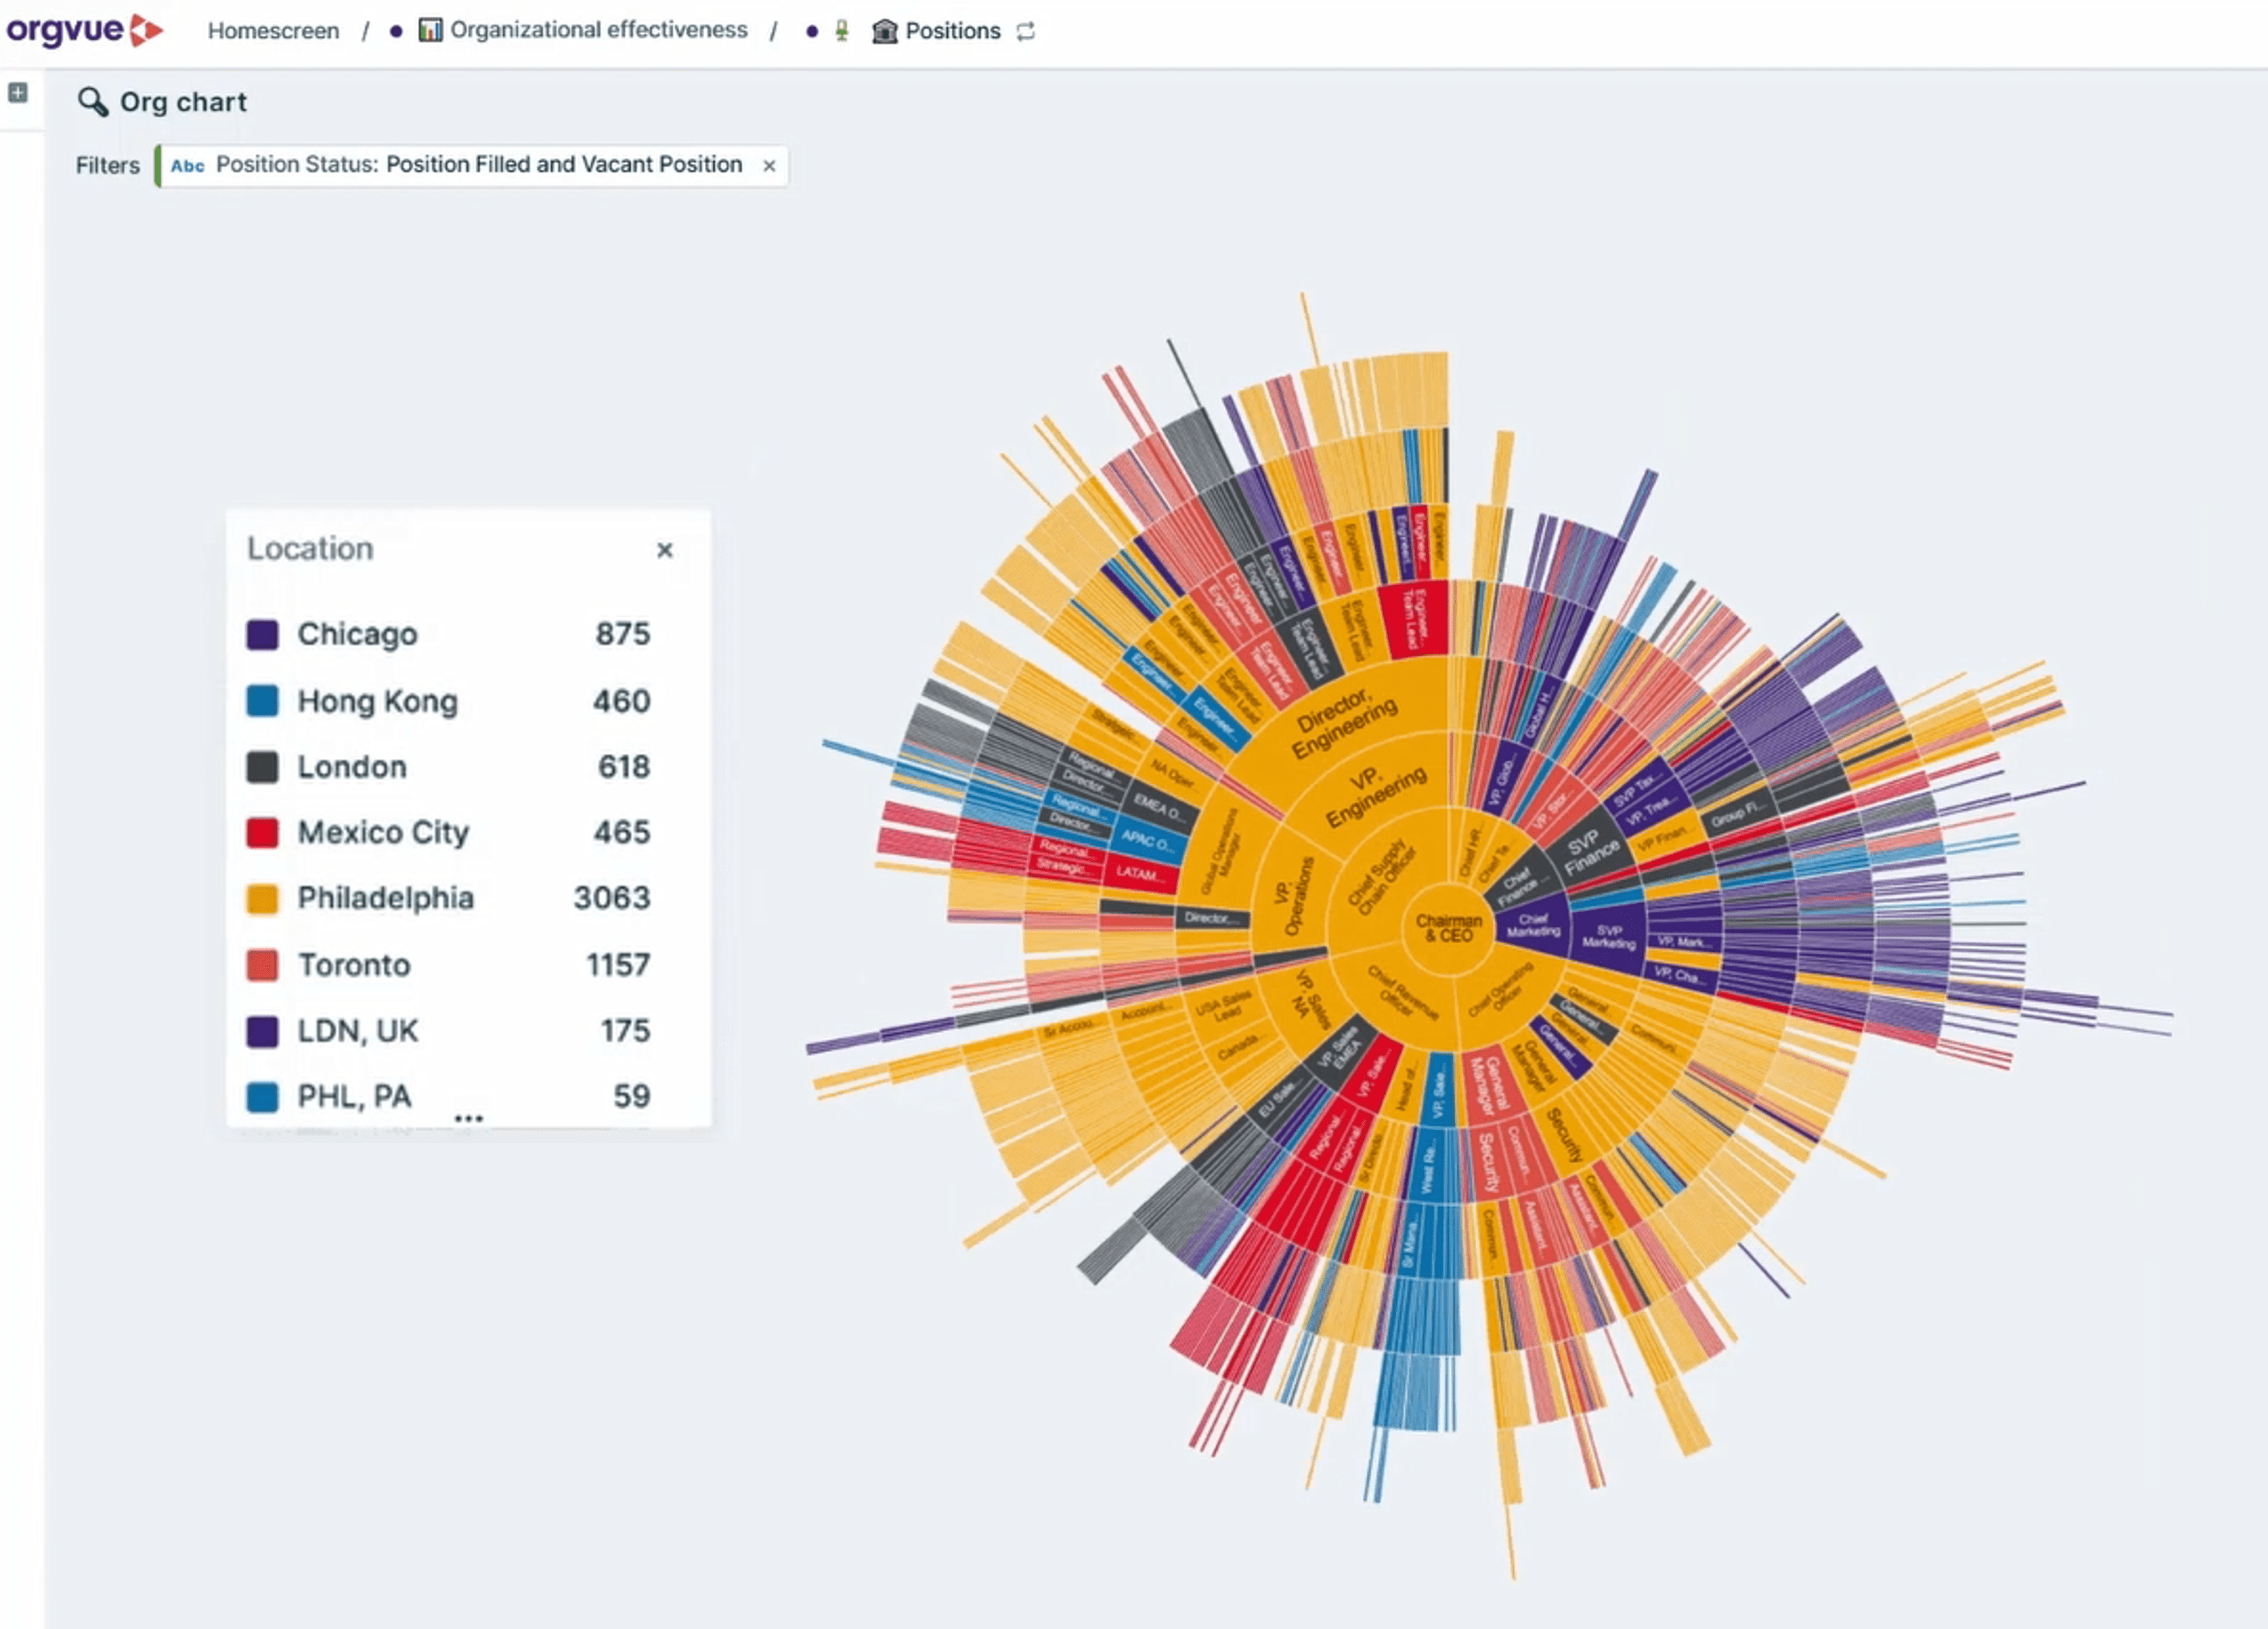 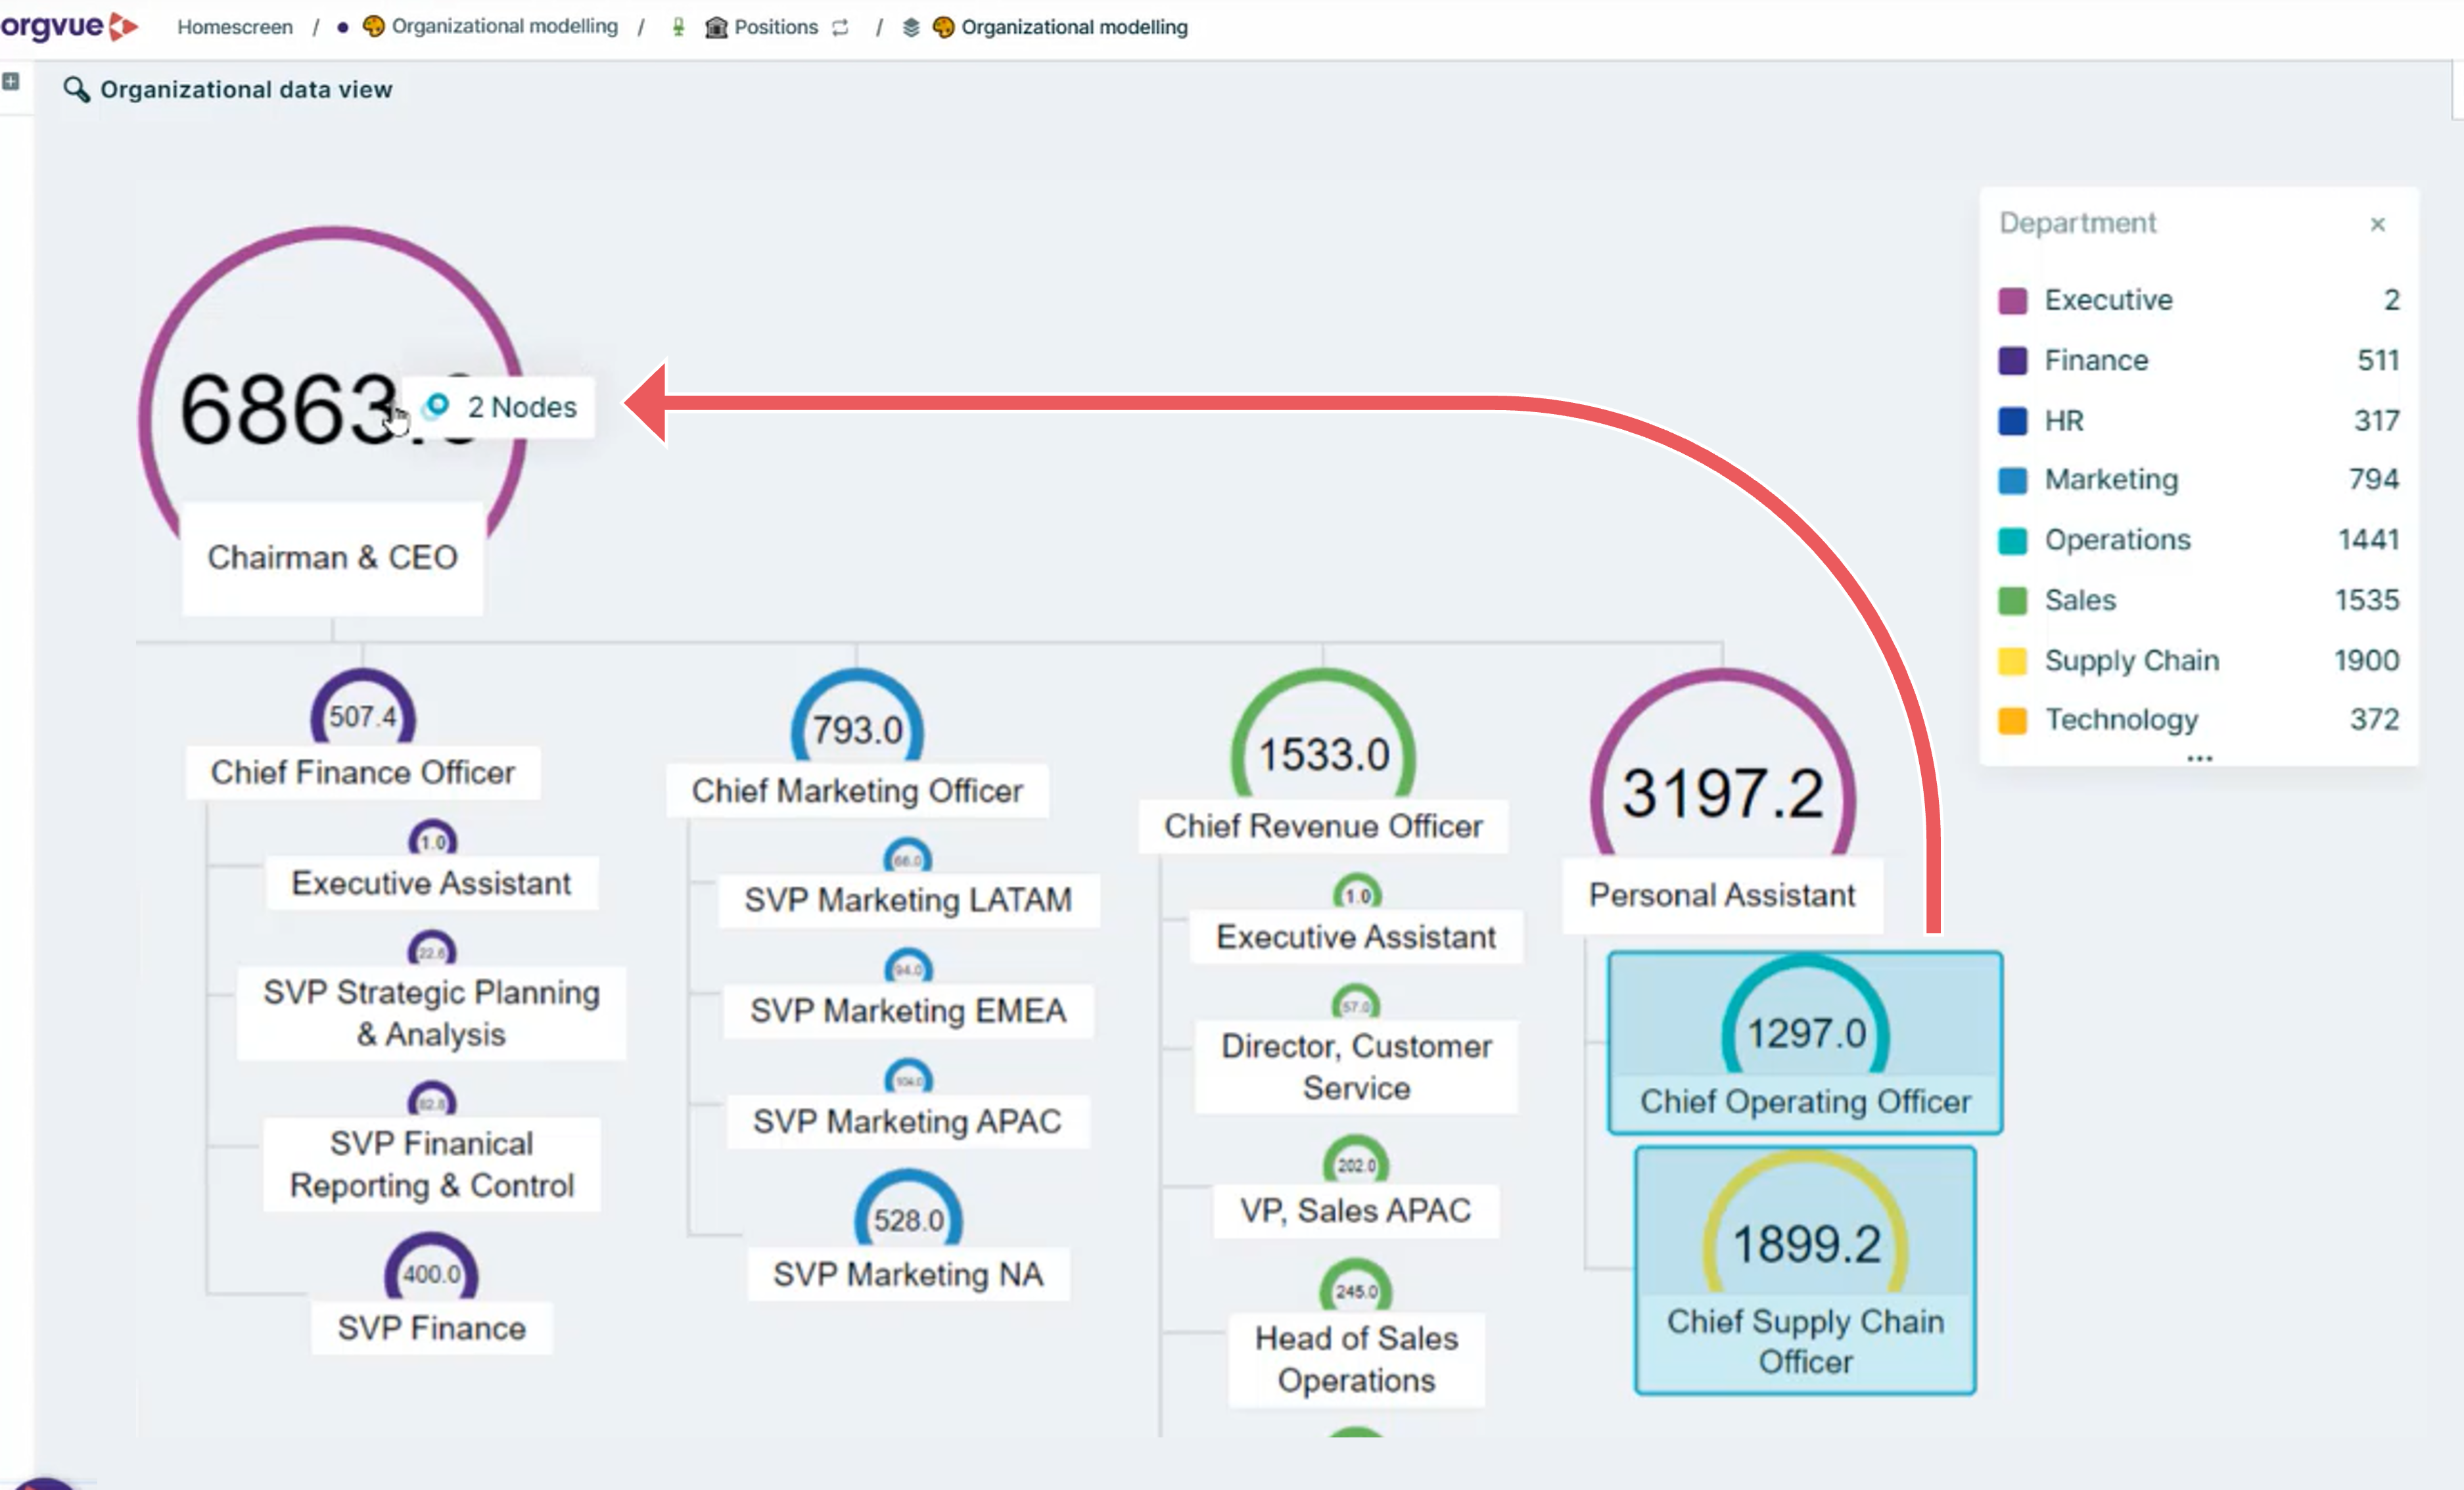 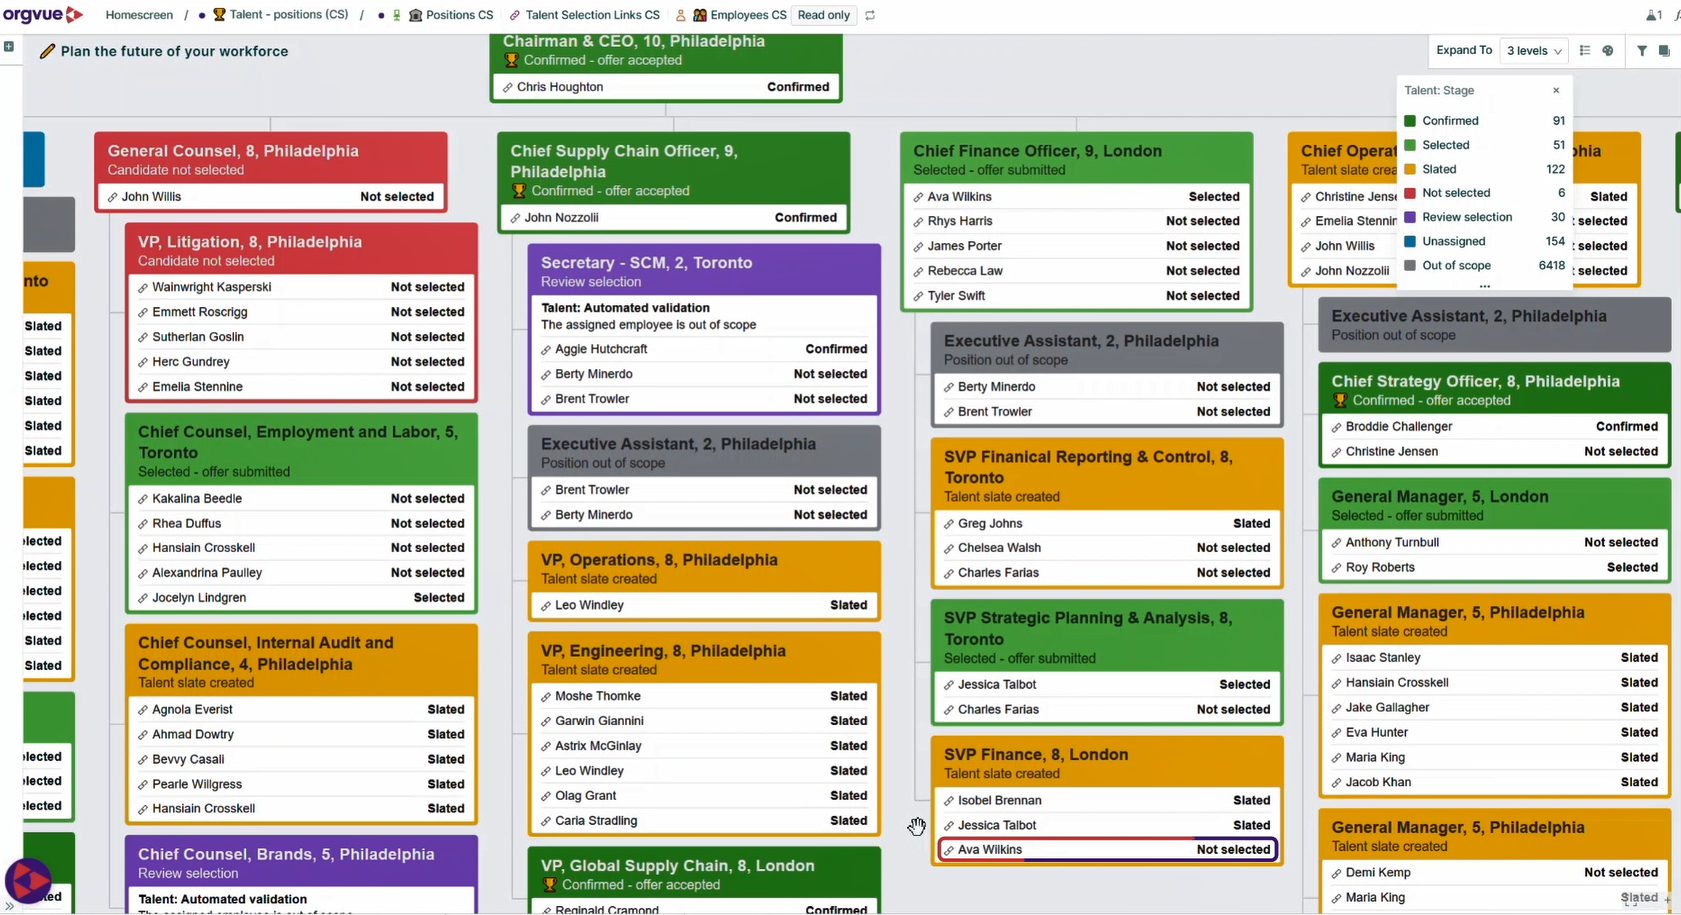 |