Study Catalyst
Study Catalyst
| Product | Rating | Most Used By | Product Summary | Starting Price |
|---|---|---|---|---|
 Study Catalyst | N/A | Study Catalyst is a clinical trial management system (CTMS) tailored to the operational and financial needs of small to midsize research sites. The platform centralizes visit tracking, invoicing, document oversight, and real-time study visibility—with the goal of enabling research sites to operate with greater efficiency and fewer tools. Key Features: Automated Financial Management: Tracks all invoiceable and non-invoiceable items, subject visits, triggered… | $300 per month |
| Study Catalyst | |||||||||||
|---|---|---|---|---|---|---|---|---|---|---|---|
| Editions & Modules |
| ||||||||||
| Offerings |
| ||||||||||
| Entry-level Setup Fee | No setup fee | ||||||||||
| Additional Details | Study Catalyst is designed to be accessible and scalable for research sites of all sizes. The core platform is free for sites looking to list studies, build visibility, and access basic referral tools. For sites ready to upgrade, our flat $300/month CTMS plan includes all features no hidden fees or per-user charges. There are no setup fees, and onboarding support is included. Custom integrations or additional support services may be discussed on a case-by-case basis, but the standard pricing is fully transparent and inclusive. | ||||||||||
| More Pricing Information | |||||||||||
| Study Catalyst | |
|---|---|
| ScreenShots | Study Catalyst Screenshots 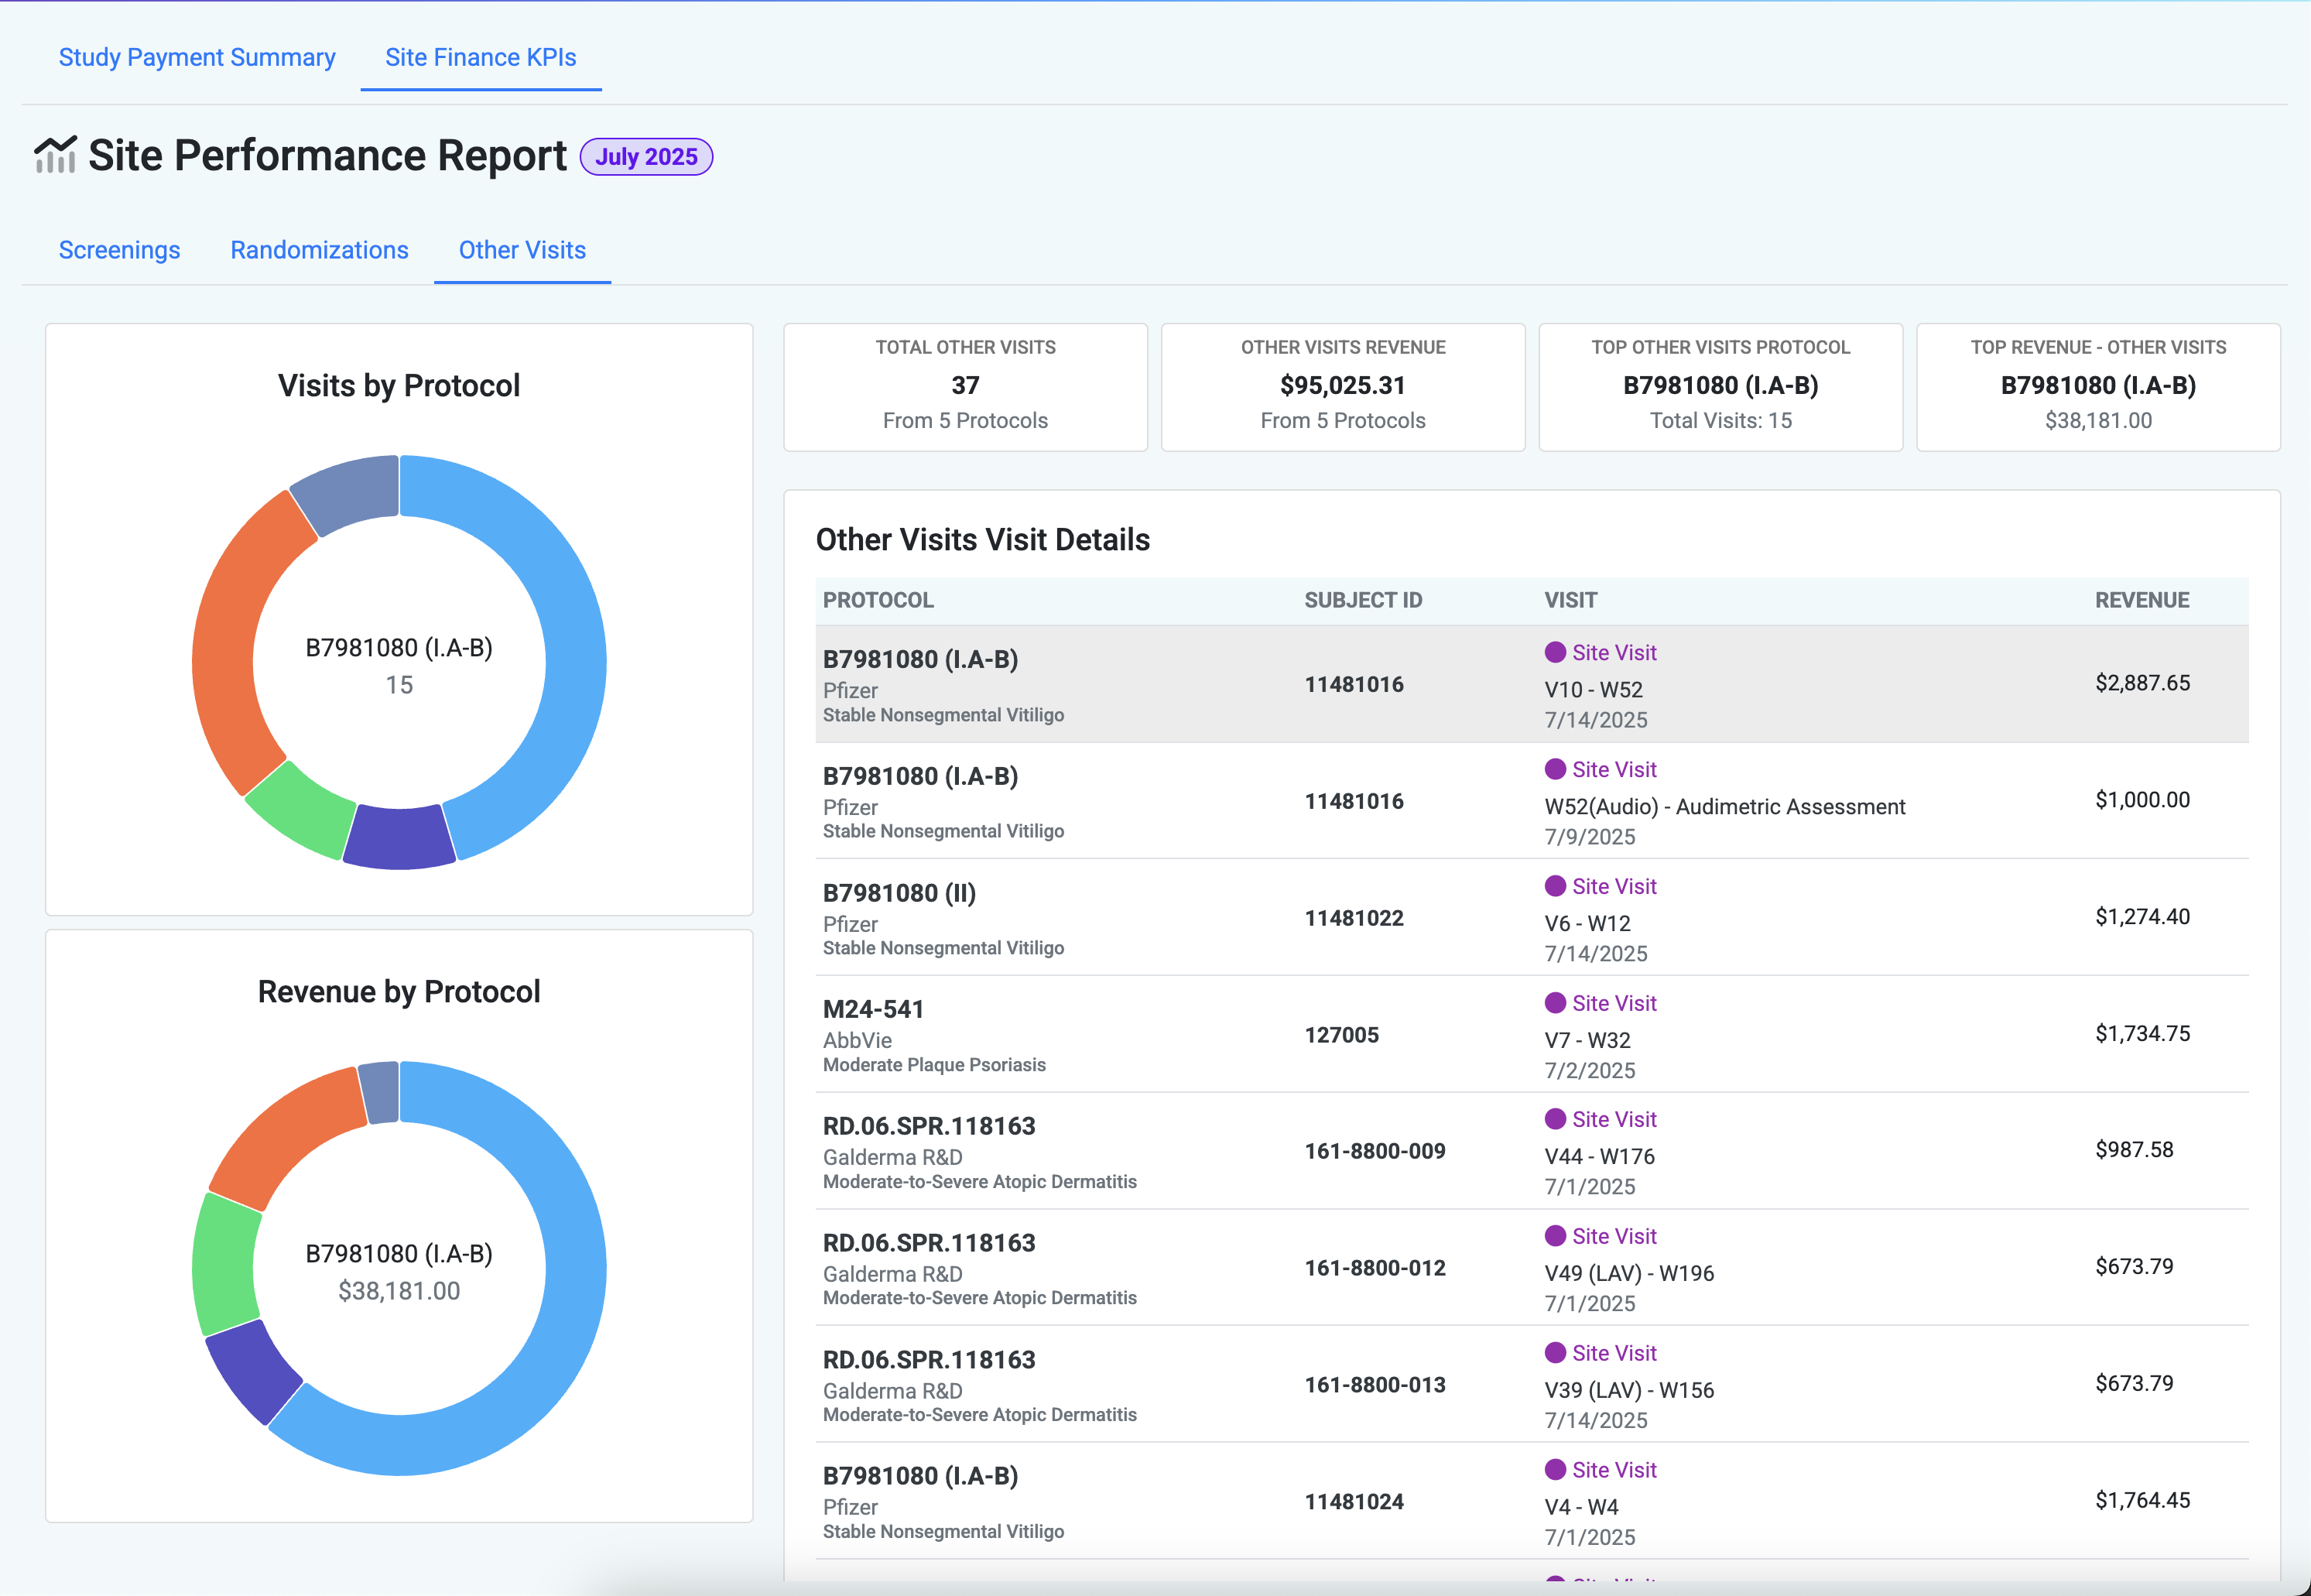   |