


The B2B Buying Disconnect: Year-over-year trends show vendors need to spin less to sell more
This is old news. We’ve got new research for 2021.
We are excited to release the 2018 B2B Buying Disconnect, our second annual report on the evolving relationship between technology buyers and vendors. In 2017, we focused on identifying the gaps between buyers and vendors, and discovered that vendors were not providing the resources and information their buyers wanted. This year, we took a closer look at buyer priorities, as well as the specific tactics that impact vendor trustworthiness and influence.
Over 650 buyers and vendors took aligning surveys on the B2B purchasing process that covered how buyers make purchasing decisions, what information sources buyers use and trust, what information sources vendors provide and believe are effective, how vendors can be more effective, during the purchasing process, and more.
What we discovered is a wake-up call to B2B marketers. Vendors who were very influential during the purchasing process were twice as likely to be open about product limitations and connect buyers with current customers. Today’s buyer wants the brutal truth, not the slick messaging most vendors rely on.
In addition to these new findings, many of the trends we saw last year held steady in 2018. Here are a few of the key insights and how they have changed year-over-year. In addition to downloading the report, you can get an inside view of these results from our experts by watching the on-demand webinar.
Information Sources
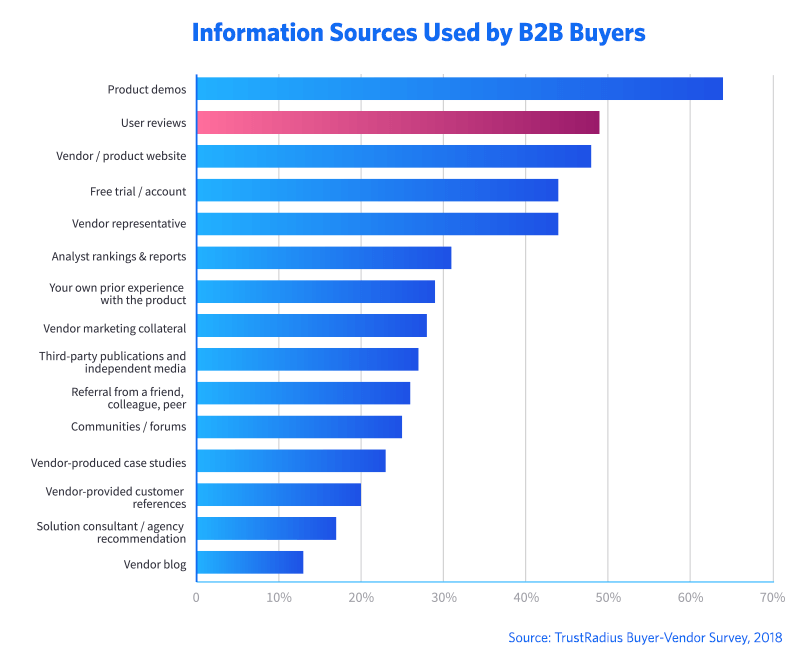
On average, buyers used about five sources of information in 2018, which was the same as 2017. Buyers want access to multiple information sources during the purchasing process, and they continue to mix vendor-provided assets with independent resources. Part of the buyer’s journey is now cross-referencing information sources to gain a more complete picture of the product.
You probably want the 2021 version of these stats.
While the top five information sources stayed the same, they did change position. In 2018, reviews moved from the fifth to second most popular information source during the selection process, topped only by product demos and surpassing vendor websites, free trials and vendor representatives. Not surprisingly, 42% vendors found reviews to be more effective in 2018, up from 21% in 2017.
Vendor-produced resources remained the least trustworthy information sources. This year we broke out vendor blogs and vendor-provided case studies from vendor marketing collateral, and all six were still at the bottom of the trustworthiness scale. Yet the data showed that vendors continue to invest in these resources despite the fact that they are not very trustworthy, are not highly influential, and oftentimes not widely used.
Vendor Trust & Influence
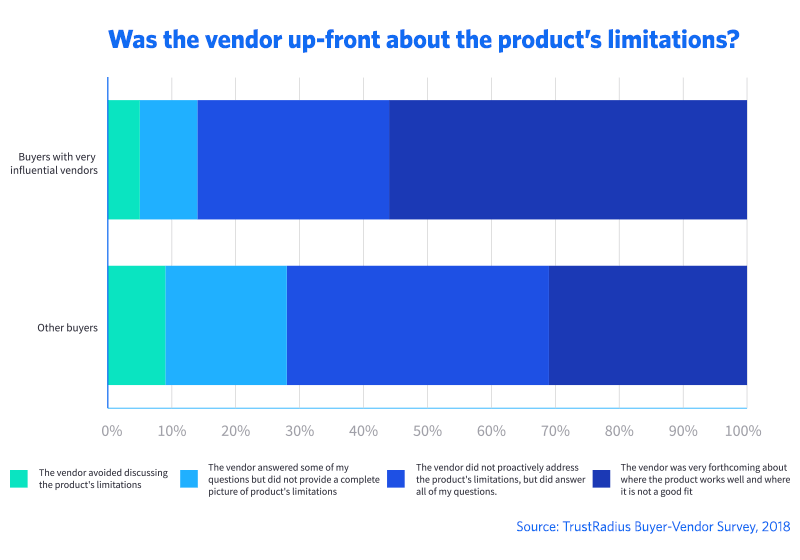
There is still a significant trust gap between buyers and vendors. Last year, 39% of buyers trusted every claim the vendor made. Similarly in 2018, 37% of buyers believed their vendor was very forthcoming about product limitations. This was in sharp contrast to the 85% of vendors who believe they are open and honest about their product’s limitations.
The data shows a direct link between trust and influence. Less than a quarter of buyers said their vendor was very influential during the purchasing process, but that percentage did rise slightly from 19% in 2017 to 23% in 2018.
This year, a new line of questioning helped us uncover some of the tactics that made those vendors very influential. Of the buyers who worked with a very influential vendor:
- 56% said the vendor was upfront about product limitations, versus 31% of buyers with less influential vendors
- 50% said the vendor provided customer evidence like reviews and case studies, versus 27% of buyers with less influential vendors
- 42% said they were connected with customer references, versus 20% of buyers with less influential vendors
It is clear that when vendors relinquish control of the message, they are rewarded.
Customer Satisfaction & Advocacy
Upwards of 90% of buyers intend to renew their purchase. 42% are promoters (rated the product they bought a 9 or 10), compared to 43% last year. However, the average Net Promoter Score did fall this year, from 38 in 2017 to 33 in 2018. While the percentage of promoters remained essentially flat, the percentage of detractors increased.
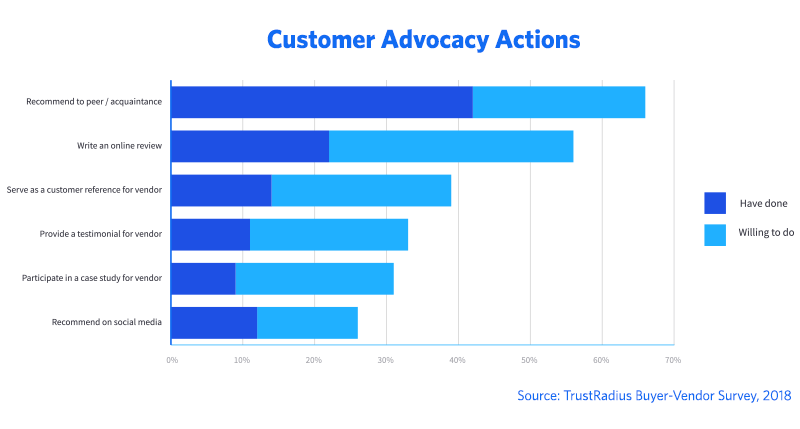
Last year, we asked how many customers had already advocated on behalf of their vendor. This year, in addition to asking how many had already shared their opinion in various ways, we asked how many buyers would be willing to do so. An impressive 84% said they would be willing to do more to share their perspective with other buyers.
Yet vendors still aren’t taking advantage of this customer goodwill. Overall, 22% of buyers have written a review, 14% have served as a reference, 11% have provided a testimonial and 9% have participated in a case study. These results were essentially flat from 2017, showing vendors still have a lot of work to do when it comes to activating their happy customers.
For more actionable insights, download the full report for free. You can also check out our on-demand webinar for a deep-dive on the survey data and what it means for your sales and marketing teams.
If you’re interested in this, you’ll love the 2021 version.
About the Author