Looker is a BI application with an analytics-oriented application server that sits on top of relational data stores. It includes an end-user interface for exploring data, a reusable development paradigm for data discovery, and an API for supporting data in other systems.
N/A
Zoho Analytics
Score 8.1 out of 10
Small Businesses (1-50 employees)
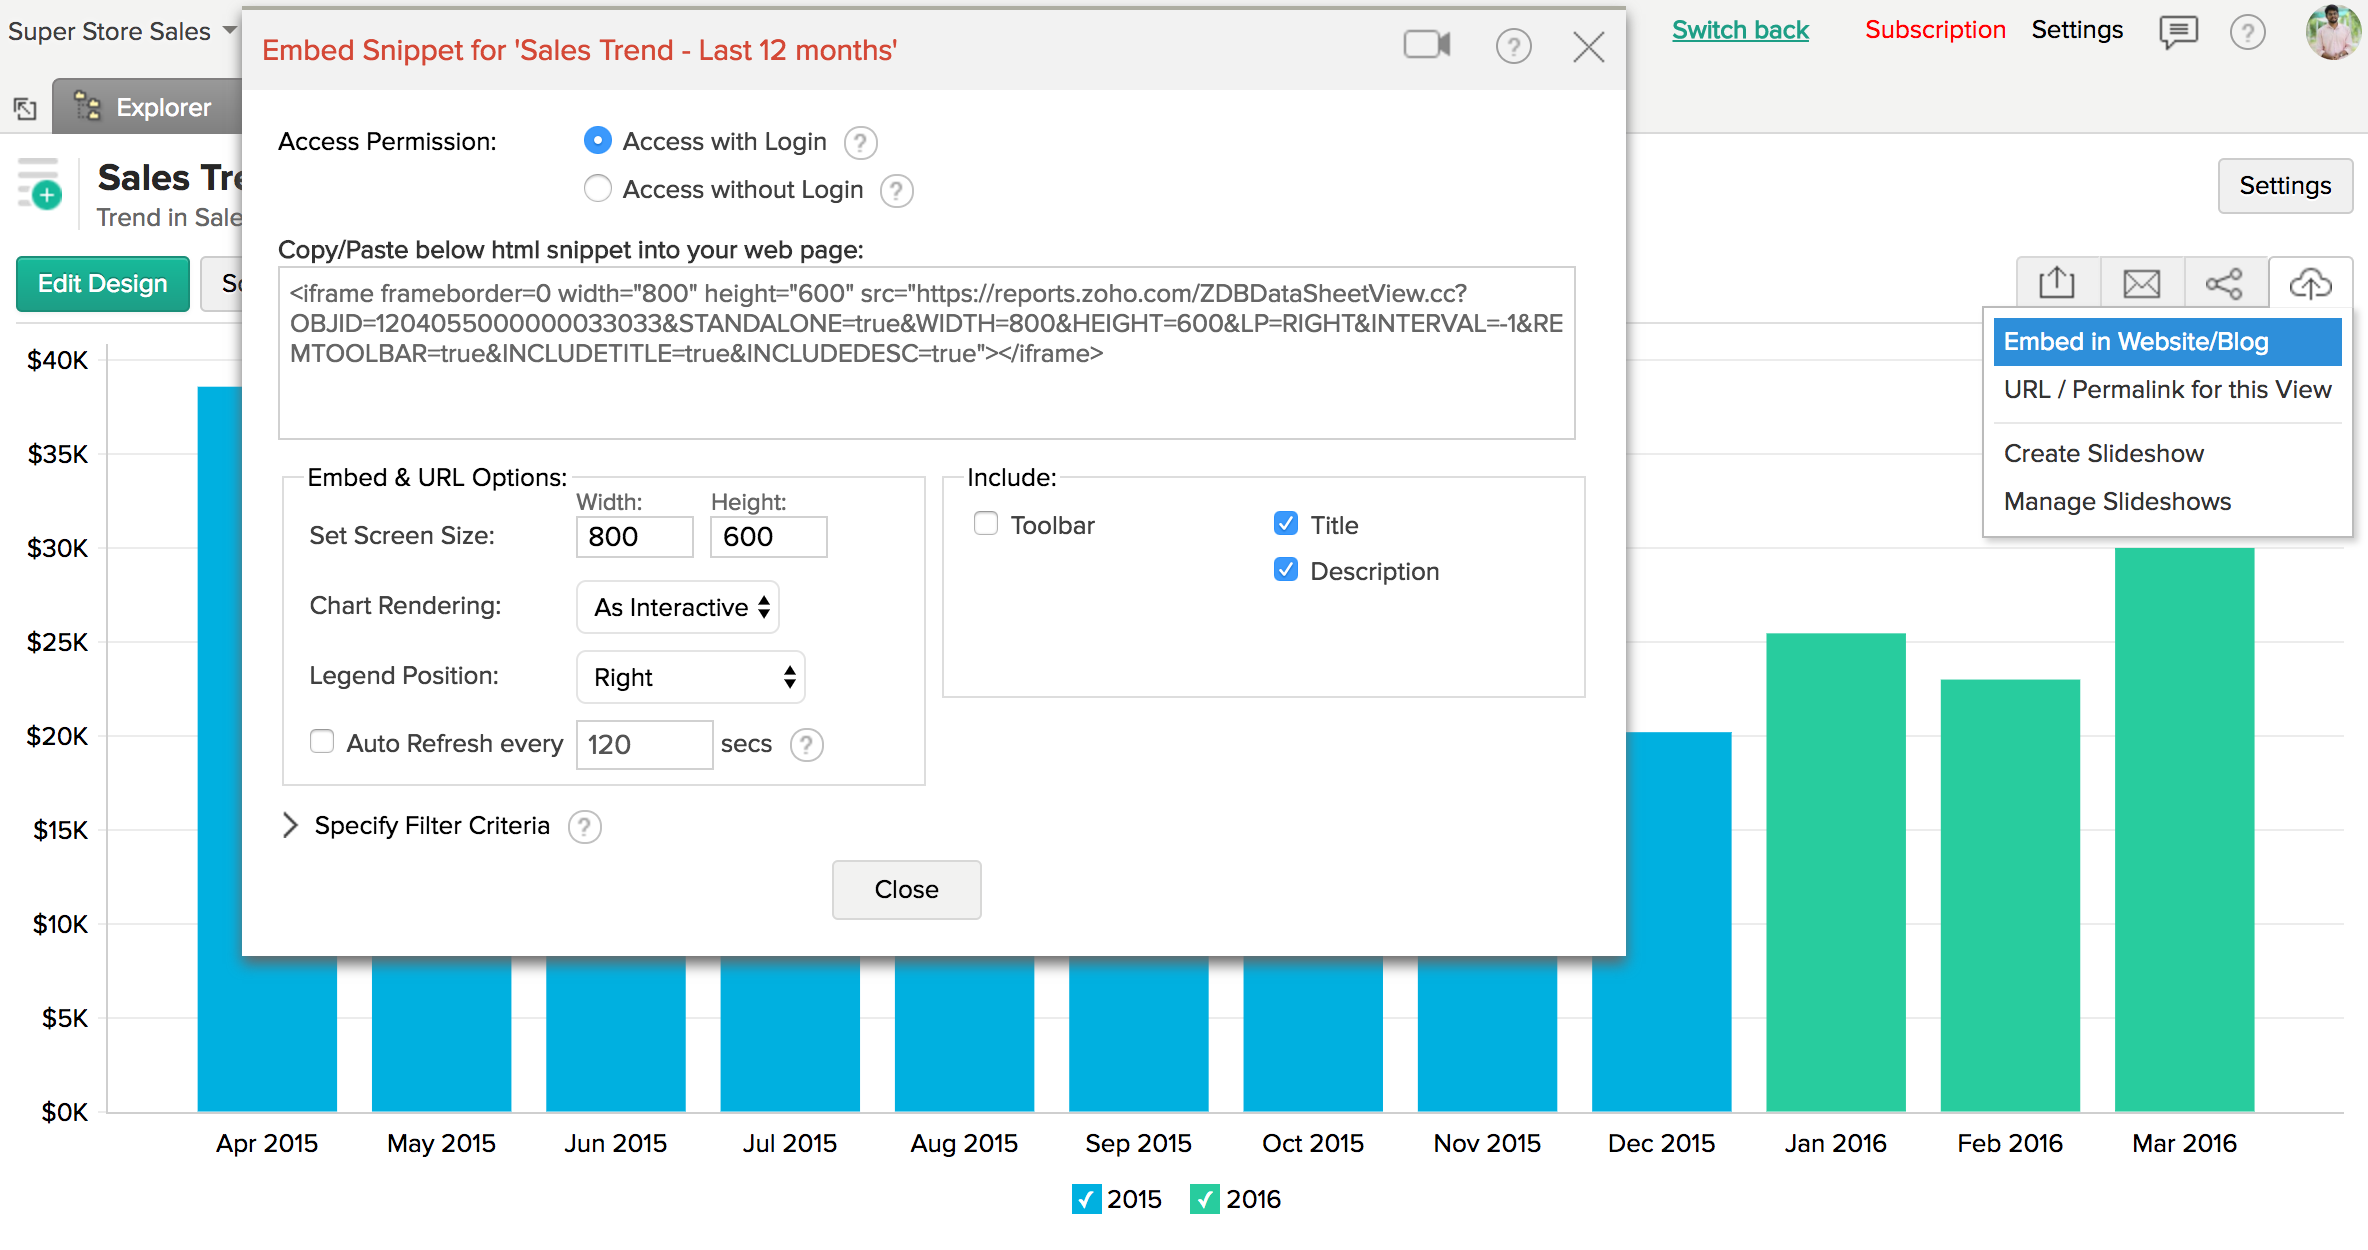
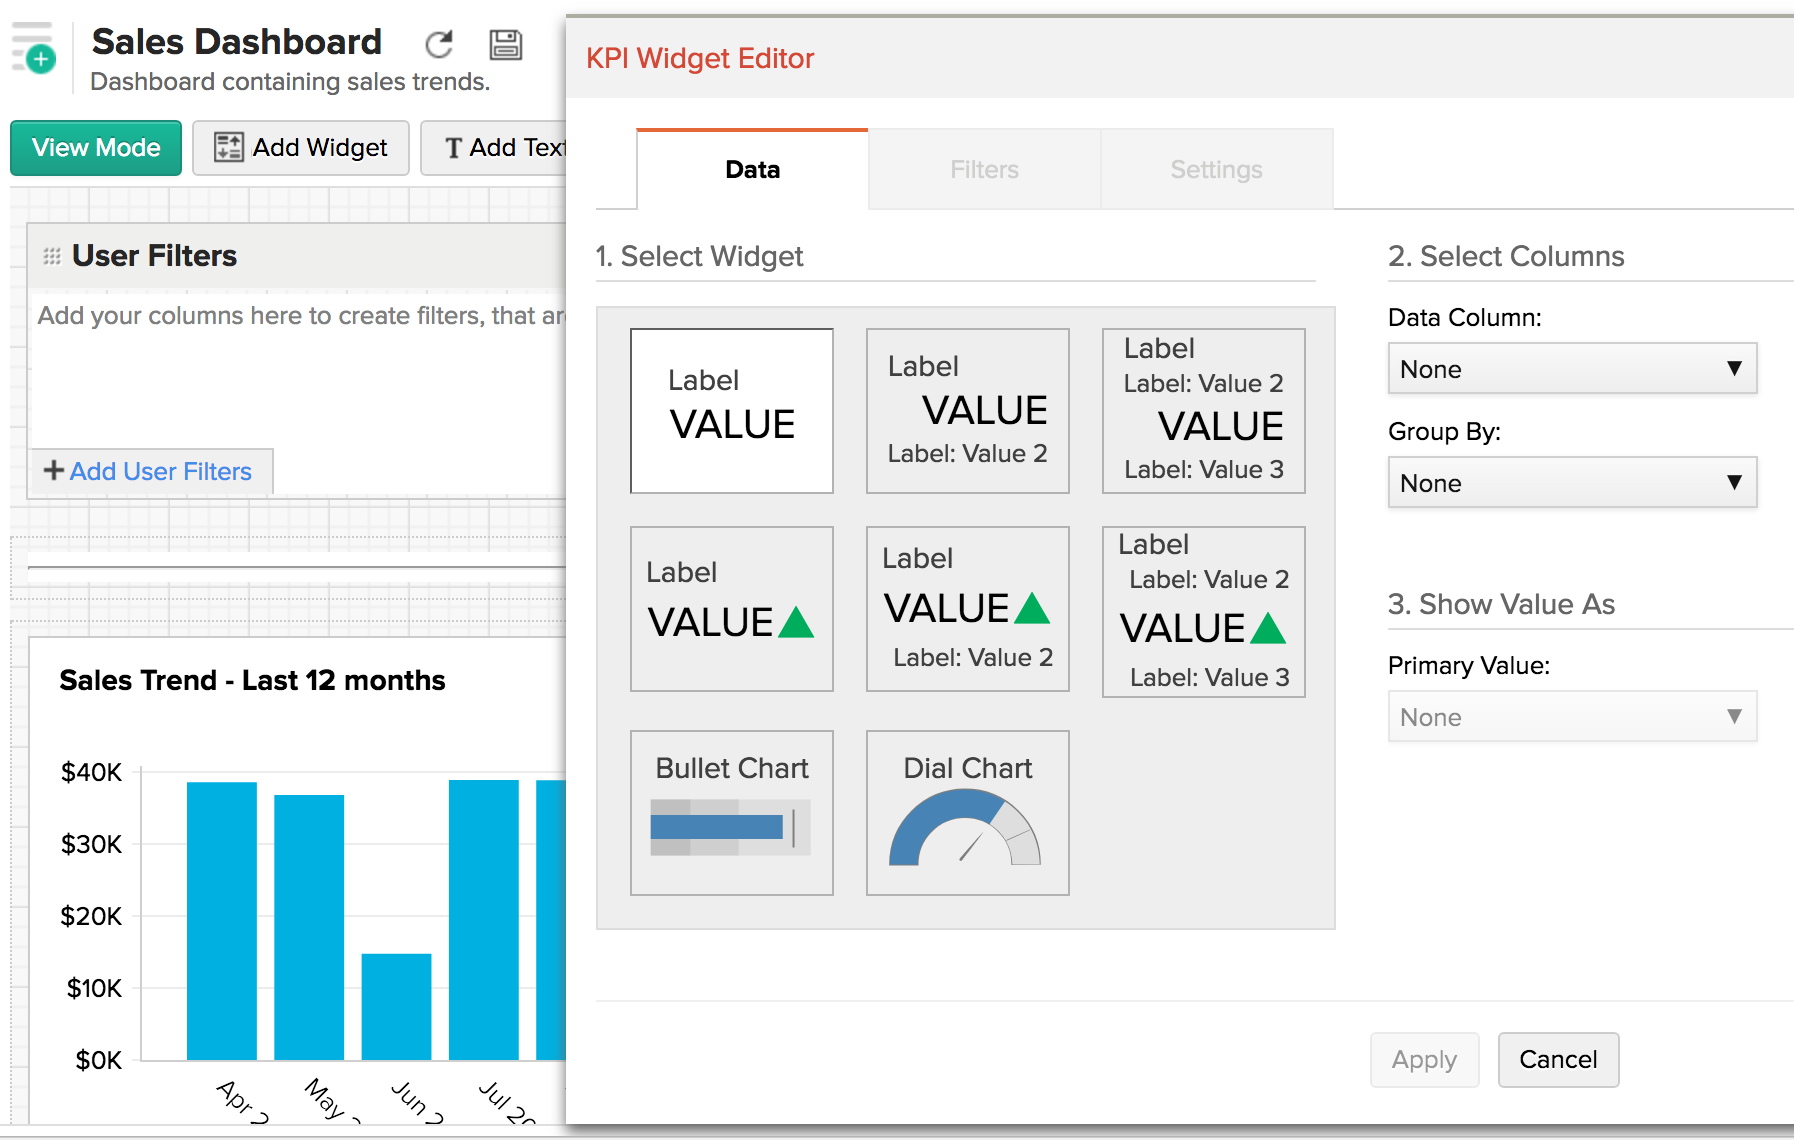
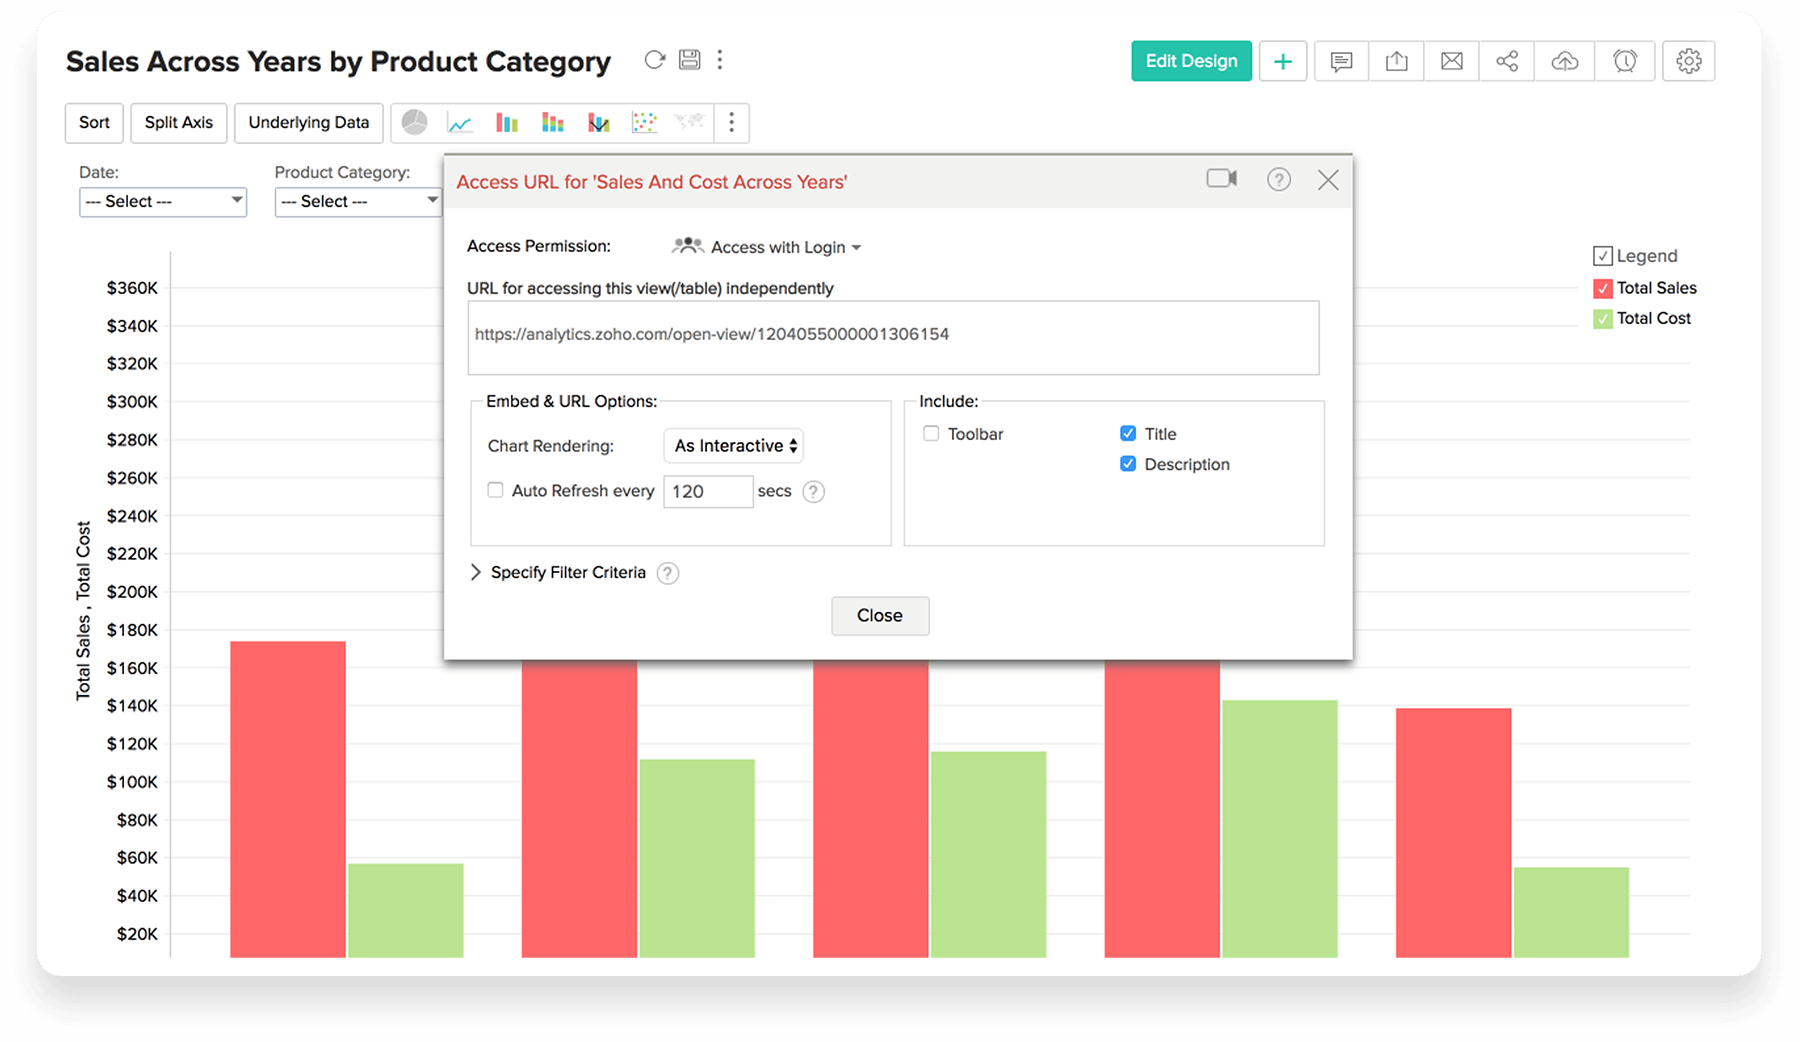
Zoho Analytics (formerly Zoho Reports) is a self-service BI and analytics platform that allows users to analyze their business data and create reports and dashboards. It is designed to help users create and share reports quickly, without IT assistance.
$50
per month
Pricing
Looker
Zoho Analytics
Editions & Modules
No answers on this topic
Basic
$30
0.5M rows, 2 users
Professional
$30
per user per month billed annually
Standard
$60
1M rows, 5 users
Premium
$145
5M rows, 15 users
Enterprise
$575
50M rows, 50 users
Offerings
Pricing Offerings
Looker
Zoho Analytics
Free Trial
Yes
Yes
Free/Freemium Version
No
Yes
Premium Consulting/Integration Services
Yes
Yes
Entry-level Setup Fee
Required
No setup fee
Additional Details
Must contact sales team for pricing.
There is a 20% discount for all plans if subscribed yearly. Customers can buy add-on rows and users, in addition to the plans listed above.
Looker stacks up very well against the other tools we have evaluated and used. All the tools have their own pros and cons. Looker had a better edge in terms of visualizations when we chose to use it. After several updates, other tools began to have newer features. Looker still …
I think working on Looker could be hard, but in performance, it can easily overtake Wave and Zoho Reports. The flexibility of the system and it being super fast makes Looker a standalone from other similar software.
Due to multiple features and more customizable dashboards, you can make which are not present in other platforms which I have compared during purchase time. Even further you can format the dashboard as per your choice which is another best features since we have to share our …
Zoho Analytics reports on other Zoho app data well, but it’s no match for bigger players like TapClicks, Google Data Studio or Tableau for visualizing external data. Zoho Analytics is very complex to set up, and certainly not for beginners. Beginners would be better off using Ta…
Zoho Analytics was better than these products for a company of our size, cost-effective and gets the job done as you want. One of the most prominent features that turned us to use Zoho was their NoSQL support. Apart from this everything worked on SQL which was easily used by …
Quick dashboards from Google Sheets - Easier to do the graphs than in Google Sheets - Operational dashboards to be used in the day-to-day work - It is good both for retrospective data and to do a pulse check of the current status - Better for not giant amounts of data and not multiple data sources. - If you need a lot of graphs to be displayed on the same page, it can be a bit glitchy during configuration (then the use works fine).
If you've got multiple applications to pull data from, Zoho Analytics is key. As soon as you get beyond hundreds, and into thousands of rows, I'd say you need a tool like Zoho Analytics. We've used it to analyze millions of rows and the engine seems to work well. If you've been able to utilize Excel to create visualizations, you'll find Zoho Analytics to be much more user friendly, in my opinion
Filtering - you can filter across different dimensions and metrics to get a more specific "cut" of data
Refreshing - data automatically ingests into Looker which allows reports to be updated and backfilled in real time
Conditional Reporting - you can leverage Looker's reporting features to flag when a given metric or KPI falls below or above a specified threshold. For example, if you had a daily sales benchmark in a SAAS organization, you could use Looker to flag whenever daily sales falls above or below the benchmark
It gives a single unified view everyday for our sales team to look at to track their progress and the progress of their peers in achieving the targets
It helps Account Executives to analyse their sales pipeline and find out the score for each deal and any high potential deal that is not getting enough attention
Some of our consultants have built very powerful stories on how and what impacts sales using storyboards and they are well understood by senior leadership
Looker is less graphical or pictorial which makes it less attractive
Consumes a lot of memory when there are multiple rows and columns, impacts performance too
At times when we download huge chunks of raw data from Looker dashbords, the time taken to prepare the file is enormous - The user fails to understand if Looker has frozen or if the data is getting prepared in the background for downloading. In turn, user ends up triggering multiple downloads
We've been very happy with Looker so far, and all teams in the organization are starting to see its value, and use it on a frequent basis. It has quickly become our accessible "source of truth" for all data/metrics.
I'd give this an 11 if I could! As our business moves forward we hope to use Zoho Analytics more then we do now. Creating better reports and dashboards for our management team to evaluate the health of our business and to provide more insightful reports for our customers. The possibilities are endless with this tool
Looker is relatively easy to use, even as it is set up. The customers for the front-end only have issues with the initial setup for looker ml creations. Other "looks" are relatively easy to set up, depending on the ETL and the data which is coming into Looker on a regular basis.
Zoho Analytics for ease of use and the overall end-user experience. It helps in maintaining data base and creating customized logical data. Report preparation becomes easy, and the visual representation creates a magical presentation. The meaningful data help in business analytics and projections helpful for planning futuristic strategy with the help of Data modelling and figures
ZOHO is a very reliable company/product. We never had any issues with downtime or inaccessibility to our data. Any type of maintenance that they had to perform was clearly communicated and never an issue. We use a lot of external hooks and we've never had any issues with getting ZOHO to communicate with any of those hooks.
ZOHO has obviously invested a lot of time effort and money in to creating a reliable infrastructure with high availability. We've never had any issues with performance and all of our data crunching small to large has always been well within reason. We have come to appreciate the performance of ZOHO and will continue to use it for all of our data needs.
Never had to work with support for issues. Any questions we had, they would respond promptly and clearly. The one-time setup was easy, by reading documentation. If the feature is not supported, they will add a feature request. In this case, LDAP support was requested over OKTA. They are looking into it.
The support team is honestly not that great. At times, it seems as if members of our own team know more about the product than the support team. They must not have a lot of training or the turnaround is quick
If your external data sources are previously organized and correlated (e.g.: in your datawarehouse or database) your implementation will be easier. Of cource some not previously predicted correlation would be necessary to be done during the implementation, but if your organization let it to be all done into Zoho Analytics, it will take more time from your team.
Looker is an off-the-shelf, free tool for Google business users. Other than the internal cost of time to build, we had no costs to set up what we needed to do. Knowledge sharing internally and using templates greatly reduced this cost, making the overall cost very low.
We used Yellowfin for 1 year and it really doesn't compare to Zoho Analytics because it doesn't have the native integration with ManageEngine's tools and the customization is more technical, Zoho Analytics lets you create dashboards automatically, immediately when you connect the data source (no matter if that is a MSSQL database, URL or an XLS file), maybe you will require custom some details in the dashboard, but it's not compared to create it from zero.
I have not really had problems with the operation of the platform; when I accessed it, I managed to do the work in the ideal times. The statistical development responds very quickly to the user’s requirements, and it is easy to extract the data to make the particular combinations that interest the industry.
Allowing others to self-serve their own analytics and connect it to Looker simply and easily has helped unblock the central data team so they can instead focus on validated dashboards whilst stakeholders manage their day-to-day analysis themselves. Countless engineering hours have been freed up by not having to manage every user permission for each BI tool; we have a BYOBI approach; Bring Your Own BI
Creation and management of a semantic layer (LookML =Looker Modeling Language ) allows peoples sandboxes and production databases to become clutter free. Minor adjustments, conditional fields, and even some modelling can all be done in LookML which doesn't need oversight or governance from the central data team.
LookML, specifying drilldown fields and their sub-queries, as well as generally creating dynamic parameters with Liquid are all great features, but can have a steep learning curve. it may take some time to understand how to create this middle layer correctly, or even pose a risk of inheriting complex code from another source which can be unmaintainable if it becomes too big. Some level of governance is recommended if Looker is used by a large number of editors.