Overview
What is Panorama Necto?
Panorama Necto is a business intelligence solution that provides enterprises with new ways to collaborate and create unique contextual connections. Some key features include: Workboards/Dashboards, Advanced Analytics, and Contextual Discovery.
Innovative BI tool with strong database compatibility
Panorama Necto
Great BI tool for interactive, collaborative, visually rich and user friendly.
While working on business intelligence and searching for a newly available tool, I came across Panorama Necto. This is the first business …
Awesome Self service BI tool with excellent collaboration features
Super Fantastic Web enabled and Automated Analysis tool for insightful decision making process.
Excellent self-service BI tool
Panaromic View in the BI Landscape - Panaroma Necto - Intuitive and Cost Effective Data Discovery Tool
- E…
One of the best self service BI tools in the market
Next Gen BI Tool – Best in Class Data Discovery and Virtualization
Self Service BI Tool
One of its kin of tool, A sure value for venture
Excellent Self service BI tool with impeccable collaboration features
Self service BI tool_Nect0
Excellent self service BI tool for end users.
New type of a BI solution for a way to streamline operation and build intelligence by integrating
Popular Features
- Drill-down analysis (23)9.090%
- Customizable dashboards (24)8.080%
- Report Formatting Templates (24)8.080%
- Formatting capabilities (24)7.070%
Pricing
What is Panorama Necto?
Panorama Necto is a business intelligence solution that provides enterprises with new ways to collaborate and create unique contextual connections. Some key features include: Workboards/Dashboards, Advanced Analytics, and Contextual Discovery.
Entry-level set up fee?
- No setup fee
Offerings
- Free Trial
- Free/Freemium Version
- Premium Consulting/Integration Services
Would you like us to let the vendor know that you want pricing?
Alternatives Pricing
What is Microsoft Power BI?
Microsoft Power BI is a visualization and data discovery tool from Microsoft. It allows users to convert data into visuals and graphics, visually explore and analyze data, collaborate on interactive dashboards and reports, and scale across their organization with built-in governance and security.
What is Tableau Desktop?
Tableau Desktop is a data visualization product from Tableau. It connects to a variety of data sources for combining disparate data sources without coding. It provides tools for discovering patterns and insights, data calculations, forecasts, and statistical summaries and visual storytelling.
Product Demos
Panorama Necto Business Intelligence 3.0 Solution (Russian Demo)
Panorama Necto Demo Dashboard - Finance
PANORAMA NECTO 16 PRODUCT DEMO
Panorama Necto14 demo
Panorama Necto 16 - 3 min demo
Business Intelligence on a Tablet Demo - Panorama Necto
Features
BI Standard Reporting
Standard reporting means pre-built or canned reports available to users without having to create them.
- 6Pixel Perfect reports(22) Ratings
Pixel Perfect reports are highly-formatted reports with graphics and ability to preview the report before printing.
- 8Customizable dashboards(24) Ratings
Customizable dashboards are dashboards providing the builder some degree of control over the look and feel and display options.
- 8Report Formatting Templates(24) Ratings
Ad-hoc Reporting
Ad-Hoc Reports are reports built by the user to meet highly specific requirements.
- 9Drill-down analysis(23) Ratings
Drill down analysis is the ability to get to a further level of detail by going deeper into the hierarchy.
- 7Formatting capabilities(24) Ratings
Ability to format output e.g. conditional formatting, lines, headers, footers.
- 8Integration with R or other statistical packages(17) Ratings
Integration with the open-source R predictive modeling environment.
- 8Report sharing and collaboration(22) Ratings
Report sharing and collaboration is the ability to easily share reports with others.
Report Output and Scheduling
Ability to schedule and manager report output.
- 7.8Publish to Web(21) Ratings
- 6.7Publish to PDF(22) Ratings
- 7.1Report Versioning(16) Ratings
Report versioning is the assignment of version numbers to each version of a report to help in tracking.
- 7Report Delivery Scheduling(21) Ratings
Report Delivery Schedule is the ability to have reports delivered to a destination at a specific data and time.
Data Discovery and Visualization
Data Discovery and Visualization is the analysis of multiple data sources in a search for patterns and outliers and the ability to represent the data visually.
- 7Pre-built visualization formats (heatmaps, scatter plots etc.)(23) Ratings
Pre-built visualization formats are canned visualization types that can be selected to visualize different kinds of data.
- 8.5Location Analytics / Geographic Visualization(22) Ratings
Location analytics is the visualization of geographical or spatial data.
- 7.6Predictive Analytics(20) Ratings
Predictive Analytics is the ability to build forecasting models based on existing data sets.
Access Control and Security
Access control means being able to determine who has access to which data.
- 8.4Multi-User Support (named login)(22) Ratings
Named model access means that users have access based on name and password.
- 7.3Role-Based Security Model(22) Ratings
Role-based access means that access to data is determined by job or position in the corporation.
- 7.3Multiple Access Permission Levels (Create, Read, Delete)(22) Ratings
Multiple access permission levels means that different levels of users have different rights.
Mobile Capabilities
Support for mobile devices like smartphones and tablets.
- 7.4Responsive Design for Web Access(21) Ratings
Web design aimed at producing easy-to-read sites across a range of different devices.
- 6.8Mobile Application(16) Ratings
A dedicated app for iOS and/or Android.
- 7.2Dashboard / Report / Visualization Interactivity on Mobile(18) Ratings
In-app dashboard reports and data visualization.
Product Details
- About
- Tech Details
- FAQs
What is Panorama Necto?
Panorama Necto Features
- Supported: Visual: Simple to understand and use Dashboards and Infographics
- Supported: Suggestive: Automated analysis & recommendations of insights
- Supported: Collaborative: Empower your teams to work collaboratively for faster and better insights
- Supported: Unified: A centrally managed and fully web based application that is easy to use
Panorama Necto Screenshots
Panorama Necto Technical Details
Deployment Types | On-premise |
---|---|
Operating Systems | Windows |
Mobile Application | Apple iOS, Android |
Supported Countries | Everywhere |
Supported Languages | English, Spanish, French + |
Frequently Asked Questions
Comparisons
Compare with
Reviews and Ratings
(28)Community Insights
- Business Problems Solved
- Pros
- Cons
- Recommendations
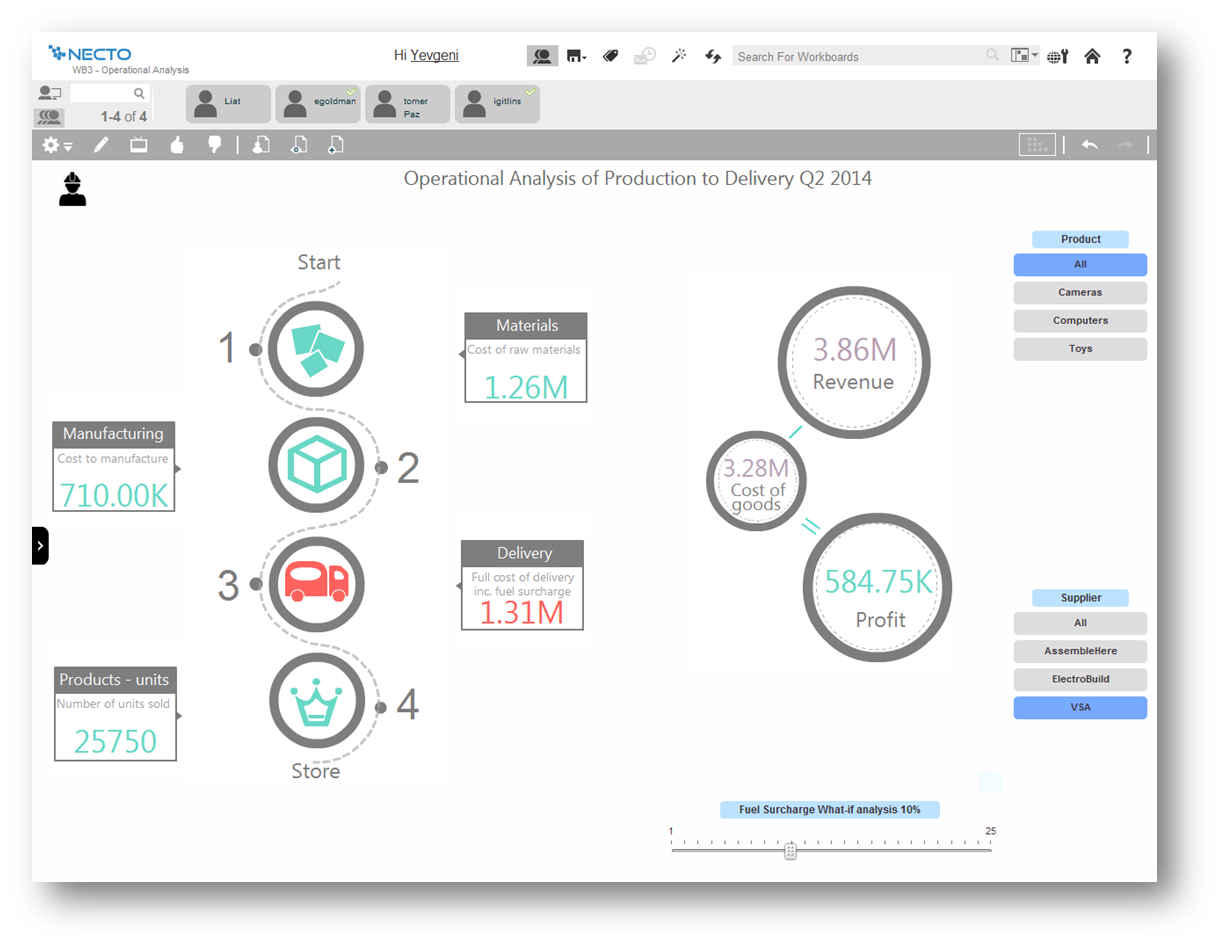
Panorama Necto has gained recognition for its user-friendly interface and intuitive features, enabling users to dive into data analytics without extensive training. With its real-time collaboration and data sharing capabilities, the tool has proven valuable for various business tasks such as identifying sales shortfalls and tracking inventory. Users have praised the built-in intelligence system, which understands both data and metadata in real-time, allowing for quick and efficient analysis. Additionally, Panorama Necto's Automated Intelligence Driving Engine AIDEN learns and understands users' behavior, providing them with relevant insights and data. The tool's extensive library of over 2000 infographics has made it a popular choice for presenting key performance indicators KPIs and sales figures across departments. Furthermore, Panorama Necto's workboard layouts remain consistent across different devices, ensuring seamless usage from desktop to tablet. Although some concerns have been raised about the tool's administration features, overall, users have found Panorama Necto to be a mature and powerful tool for data discovery and visualization. It has helped organizations reduce their dependency on reporting teams by enabling ad hoc report generation and independent data analysis.
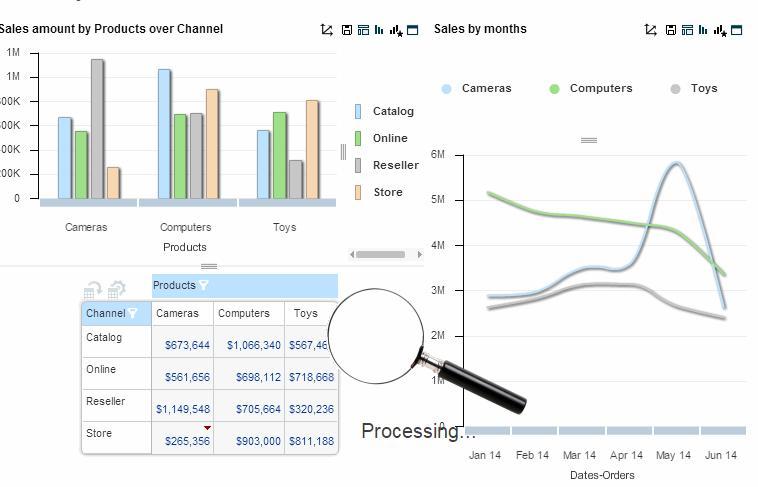
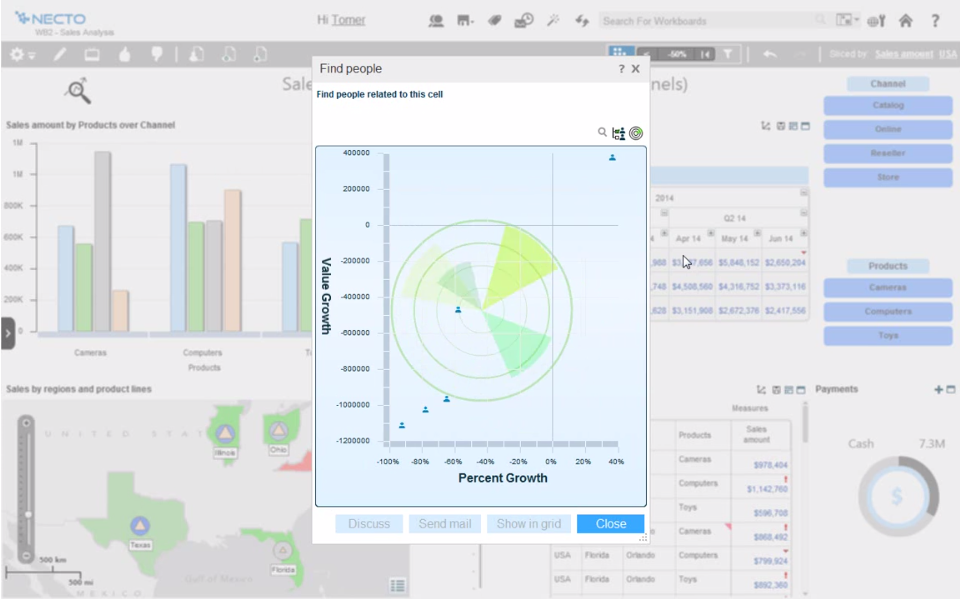
Great Visualization Capabilities: Users have praised Panorama Necto 14 for its great visualization capabilities, particularly with infographics. Many reviewers mentioned that this feature allows them to easily present data trends in a visually appealing and understandable way, making it easier for them to understand their business data. Flexible Customization Options: Reviewers appreciate the variety of options offered by Panorama Necto 14 to modify and build smart infographics. This flexibility allows users to create customized visualizations that suit their needs. Several users specifically mentioned how they liked the innovative pictures and charts used in creating dashboards, which enhance their ability to understand and analyze their data effectively. Efficient Geographical Displays: The maps in Panorama Necto 14 were highly praised by users for their efficient display of various measures and understanding of geographical aspects of the business. Some users felt that these maps provide a valuable tool for analyzing regional performance and identifying geographic trends.
Lack of support for multiple languages: Some users have expressed frustration with Panorama Necto's lack of support for multiple languages. This limitation hinders their ability to effectively analyze data from different regions and cater to a diverse user base.
Insufficient data connectors and handling of big data: Several reviewers have mentioned the need for better data connectors and an improved approach to handle big data in Panorama Necto. Users find the current options limiting, which impacts their ability to seamlessly integrate and analyze large datasets.
Limited platform compatibility: A number of users have noted that Panorama Necto needs improvement when it comes to working with Mac devices and non-Microsoft platforms. This limited compatibility restricts the software's accessibility for users who rely on these platforms, hindering their productivity and forcing them to seek alternative solutions.
Users have made several recommendations for Necto 15 based on their experiences. The most common recommendations are:
-
Users recommend exploring all the available materials and watching the provided videos to make the most of Necto 15's functionalities.
-
There is a suggestion to improve Necto 15 by adding support for HTML5, providing users with more flexibility and compatibility.
-
Users would like to see an expansion of the infographic templates library and a platform where users can share their own templates, fostering collaboration and creativity.
Overall, users recommend Necto 15 as a unique and easy-to-use business intelligence tool. They appreciate its social business intelligence capabilities, good memory performance, and options to personalize reports. It is recommended for organizations looking for a new age BI tool with collaboration features and infographic support. Additionally, users find Necto 15 suitable for data discovery and self-service BI, making it an excellent choice for analysts and dashboard users in small to mid-sized applications with moderate data volumes.
Attribute Ratings
Reviews
(1-3 of 3)While working on business intelligence and searching for a newly available tool, I came across Panorama Necto. This is the first business tool I have seen with scope for personalization and providing great visual infographic experience and is user friendly.
With this tool business users can effectively present data and track performance very interactively, while changes are being updated dynamically.
There is also provision for collaborative working where users can share, discuss and edit on a single platform. Some helpful features like realtime notifications, public or private comments, maps and location based services are also made available
- Ease of use
- Visualization
- Dynamic capabilities
- Collaborative
- Multi language support
- Blackberry support
- Mac OS support
- Pixel Perfect reports
- 80%8.0
- Customizable dashboards
- 90%9.0
- Report Formatting Templates
- 90%9.0
- Drill-down analysis
- 80%8.0
- Formatting capabilities
- 80%8.0
- Integration with R or other statistical packages
- 70%7.0
- Report sharing and collaboration
- 90%9.0
- Publish to Web
- 80%8.0
- Publish to PDF
- 60%6.0
- Report Versioning
- 70%7.0
- Report Delivery Scheduling
- 70%7.0
- Pre-built visualization formats (heatmaps, scatter plots etc.)
- 70%7.0
- Location Analytics / Geographic Visualization
- 90%9.0
- Predictive Analytics
- 90%9.0
- Multi-User Support (named login)
- 90%9.0
- Role-Based Security Model
- 60%6.0
- Multiple Access Permission Levels (Create, Read, Delete)
- 60%6.0
- Responsive Design for Web Access
- 90%9.0
- Mobile Application
- 90%9.0
- Dashboard / Report / Visualization Interactivity on Mobile
- 90%9.0
- reporting
- business intelligence
- data analysis
- visualization
- collaborative
- collaborative
- visualization
Impressive one but few concerns needs to be adressed
- Custom infographics can help in re-defining the term WYSWYG to whichever way you want to see you can develop it.
- Mobile platform support.
- Recommendation engine.
- I believe Panorama Necto is a bit slow in processing.
- Scripting is required in terms of administration while setting up third party authentication.
- There is no knowledge sharing blogs available that ar free of cost.
2. How are the infographics
3. How does it handle large queries?
4. Administration?
5. Is the knowledge base or support available on blogs rather than having to go for paid service from company itself?
- Pixel Perfect reports
- 100%10.0
- Customizable dashboards
- 90%9.0
- Report Formatting Templates
- 100%10.0
- Drill-down analysis
- 80%8.0
- Formatting capabilities
- 90%9.0
- Integration with R or other statistical packages
- 80%8.0
- Report sharing and collaboration
- 100%10.0
- Publish to Web
- 90%9.0
- Publish to PDF
- 90%9.0
- Report Versioning
- N/AN/A
- Report Delivery Scheduling
- 30%3.0
- Pre-built visualization formats (heatmaps, scatter plots etc.)
- 90%9.0
- Location Analytics / Geographic Visualization
- 90%9.0
- Predictive Analytics
- 100%10.0
- Multi-User Support (named login)
- 60%6.0
- Role-Based Security Model
- 50%5.0
- Multiple Access Permission Levels (Create, Read, Delete)
- 80%8.0
- Responsive Design for Web Access
- 100%10.0
- Mobile Application
- 100%10.0
- Dashboard / Report / Visualization Interactivity on Mobile
- 100%10.0
- Infographics
- Mobile platform
- Recommendation engine
- NA
- Recommendation engine
- Price
- Product Features
- Product Usability
- Product Reputation
- Prior Experience with the Product
- Vendor Reputation
- Existing Relationship with the Vendor
- Positive Sales Experience with the Vendor
- Analyst Reports
- Third-party Reviews
Performance of the tool
- Don't know
- Slowness
- No KnowledgeBase is available on any site
- Custom infogrpahics
- Dashboards or reports
- Recommendation engines is very useful
- Administration
- Ability to collaborate with other users by sharing content, starting discussions, subscribing to users, searching for the relevant content.
- Mobile application is available for iOS, Android and Windows RT and users have the same experience on any device. This is great for the executives who travel a lot and are often in the meetings.
- Great visualization capabilities, especially infographics which represent a unique way to easily present the trends in data.
- Needs more support for predictive and forecast analysis.
- Needs more data transformation support
- Does not support multiple languages.
- Pixel Perfect reports
- 90%9.0
- Customizable dashboards
- 100%10.0
- Report Formatting Templates
- 80%8.0
- Drill-down analysis
- 90%9.0
- Formatting capabilities
- 80%8.0
- Report sharing and collaboration
- 100%10.0
- Publish to Web
- 100%10.0
- Publish to PDF
- 90%9.0
- Report Versioning
- 50%5.0
- Report Delivery Scheduling
- 60%6.0
- Pre-built visualization formats (heatmaps, scatter plots etc.)
- 90%9.0
- Location Analytics / Geographic Visualization
- 80%8.0
- Predictive Analytics
- 50%5.0
- Multi-User Support (named login)
- 90%9.0
- Role-Based Security Model
- 90%9.0
- Multiple Access Permission Levels (Create, Read, Delete)
- 90%9.0
- Responsive Design for Web Access
- 90%9.0
- Mobile Application
- 90%9.0
- Dashboard / Report / Visualization Interactivity on Mobile
- 90%9.0
- Self service BI
- Collaboration and social engagement
- Visualisation and dashboard creation
- Set up automatic identification of exceptions in the data
- Collaboration, subscribing to users, initiating context-based discussions
- Implemented in-house