Acure.io vs. Grafana
Acure.io vs. Grafana
| Product | Rating | Most Used By | Product Summary | Starting Price |
|---|---|---|---|---|
 Acure.io | N/A | Acure is a monitoring system, an AIOps solution, and CMDB that integrates all other log and alert monitoring systems to cover the user's needs and ensure the user's IT services are available and performing well, with alerts coming only if the issue matters. | $0 | |
 Grafana | N/A | Grafana is a data visualization tool developed by Grafana Labs in New York. It is available open source, managed (Grafana Cloud), or via an enterprise edition with enhanced features. Grafana has pluggable data source model and comes bundled with support for popular time series databases like Graphite. It also has built-in support for cloud monitoring vendors like Amazon Cloudwatch, Microsoft Azure and SQL databases like MySQL. Grafana can combine data from many places into a single dashboard. | $0 |
| Acure.io | Grafana | |||||||||||||||
|---|---|---|---|---|---|---|---|---|---|---|---|---|---|---|---|---|
| Editions & Modules | No answers on this topic |
| ||||||||||||||
| Offerings |
| |||||||||||||||
| Entry-level Setup Fee | No setup fee | No setup fee | ||||||||||||||
| Additional Details | — | — | ||||||||||||||
| More Pricing Information | ||||||||||||||||
| Acure.io | Grafana |
|---|
| Acure.io | Grafana | ||||||||||||||||||
|---|---|---|---|---|---|---|---|---|---|---|---|---|---|---|---|---|---|---|---|
| BI Standard Reporting |
| ||||||||||||||||||
| Ad-hoc Reporting |
| ||||||||||||||||||
| Report Output and Scheduling |
| ||||||||||||||||||
| Data Discovery and Visualization |
|
| Acure.io | Grafana | |
|---|---|---|
| Small Businesses |  InfluxDB Score 8.8 out of 10 |  Supermetrics Score 9.7 out of 10 |
| Medium-sized Companies |  Sumo Logic Score 8.8 out of 10 | Supermetrics Score 9.7 out of 10 |
| Enterprises |  NetBrain Technologies Score 8.8 out of 10 |  IBM Analytics Engine Score 7.1 out of 10 |
| All Alternatives | View all alternatives | View all alternatives |
| Acure.io | Grafana | |
|---|---|---|
| Likelihood to Recommend | - (0 ratings) | 9.4 (7 ratings) |
| Usability | - (0 ratings) | 9.6 (3 ratings) |
| Acure.io | Grafana | |
|---|---|---|
| Likelihood to Recommend | Acure.io No answers on this topic | Grafana Labs
|
| Pros | Acure.io No answers on this topic | Grafana Labs
|
| Cons | Acure.io No answers on this topic | Grafana Labs
 ANurag Tamrakar Software Engineer - DevOps |
| Usability | Acure.io No answers on this topic | Grafana Labs
|
| Alternatives Considered | Acure.io No answers on this topic | Grafana Labs
|
| Return on Investment | Acure.io No answers on this topic | Grafana Labs
|
| ScreenShots | Acure.io Screenshots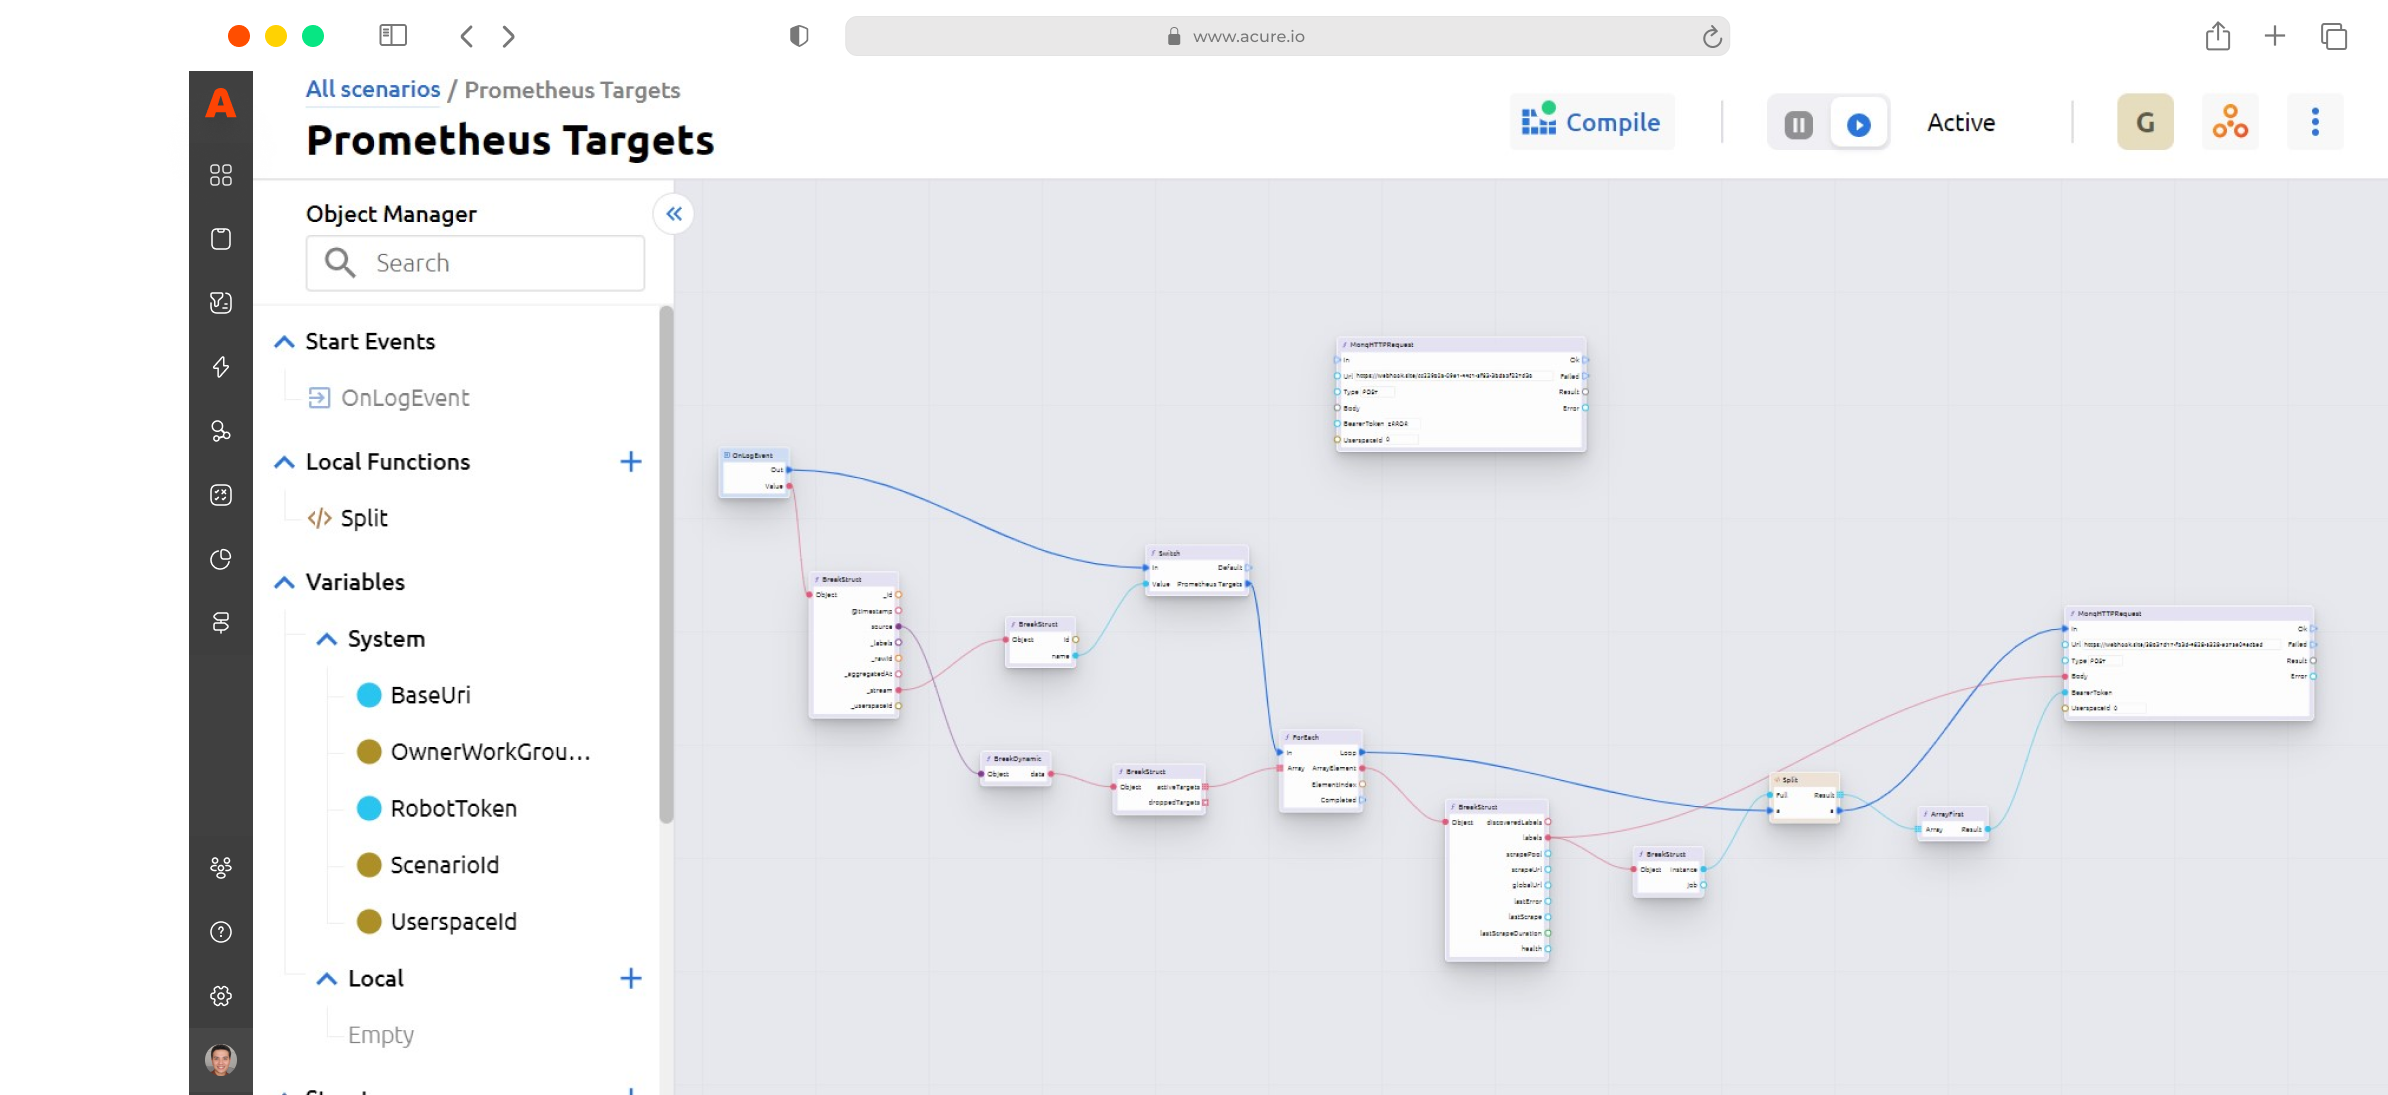 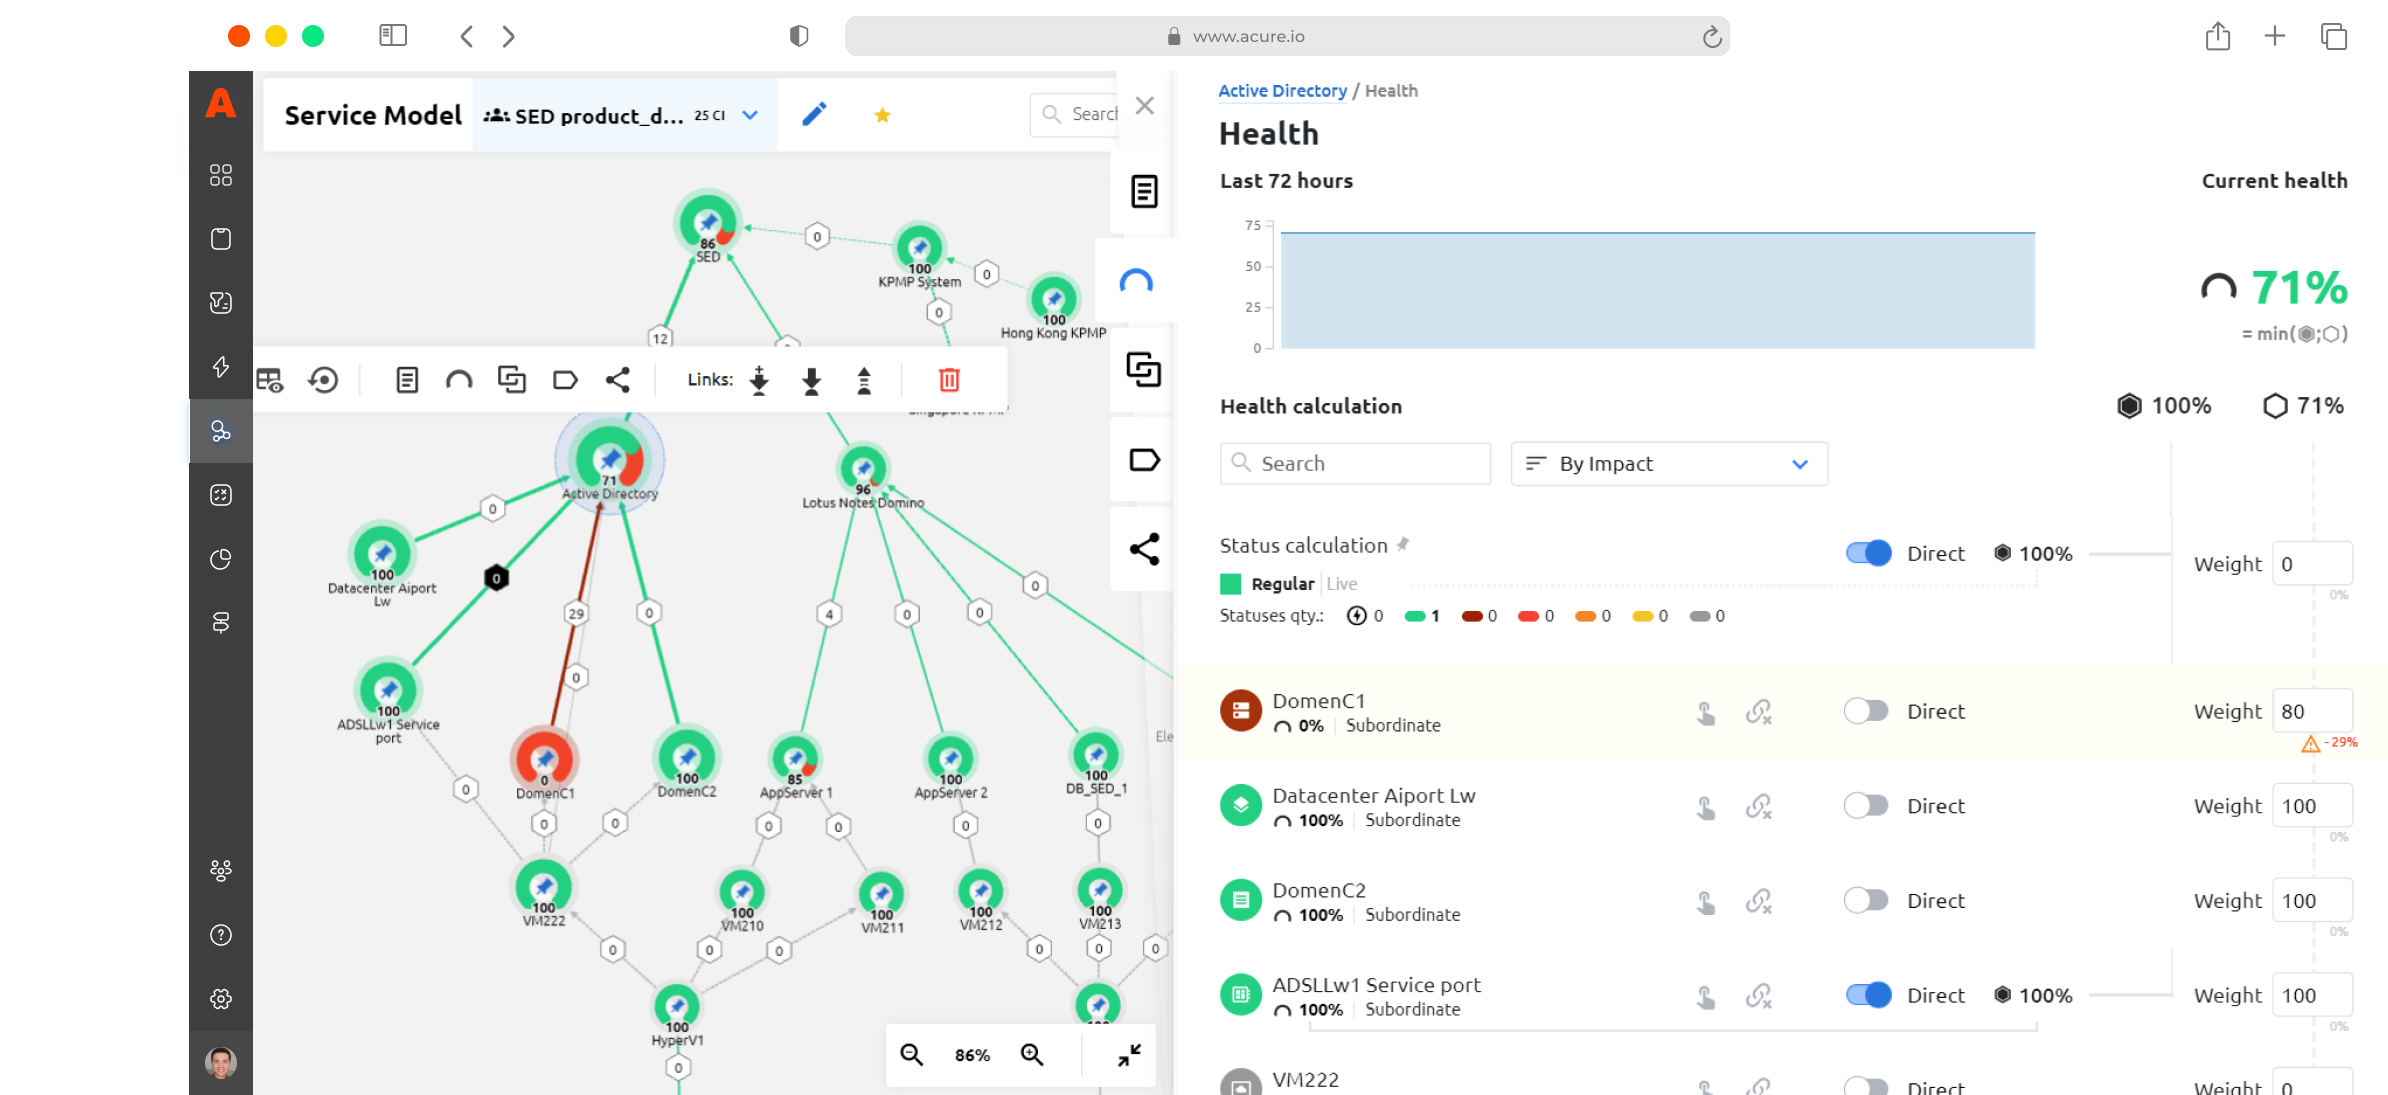 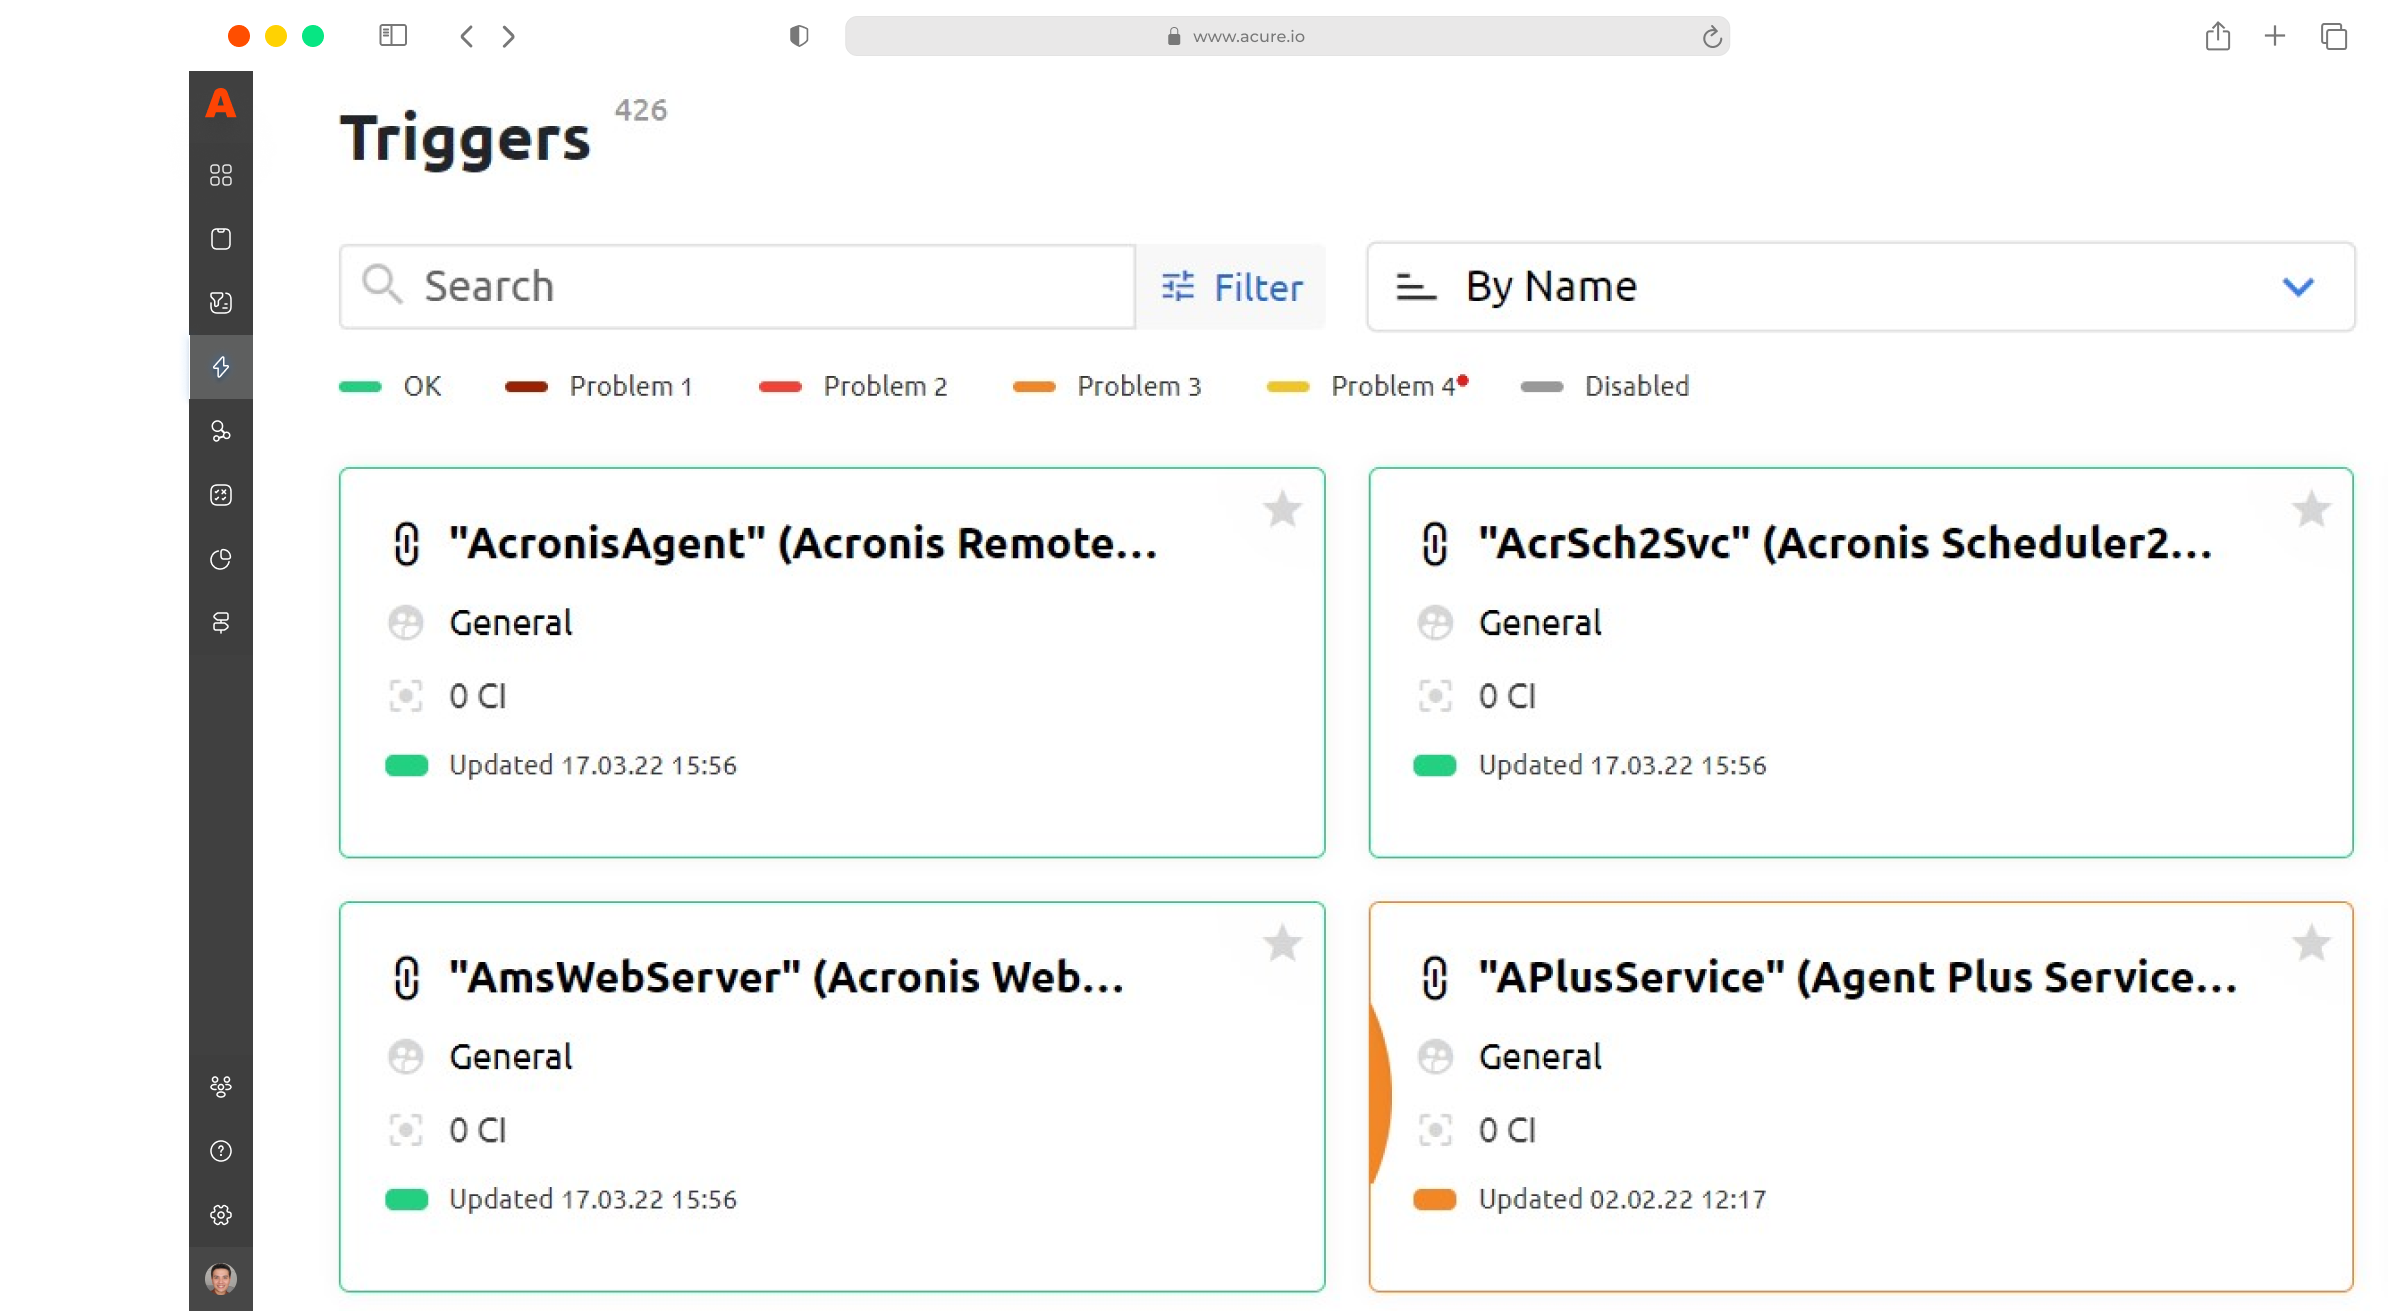 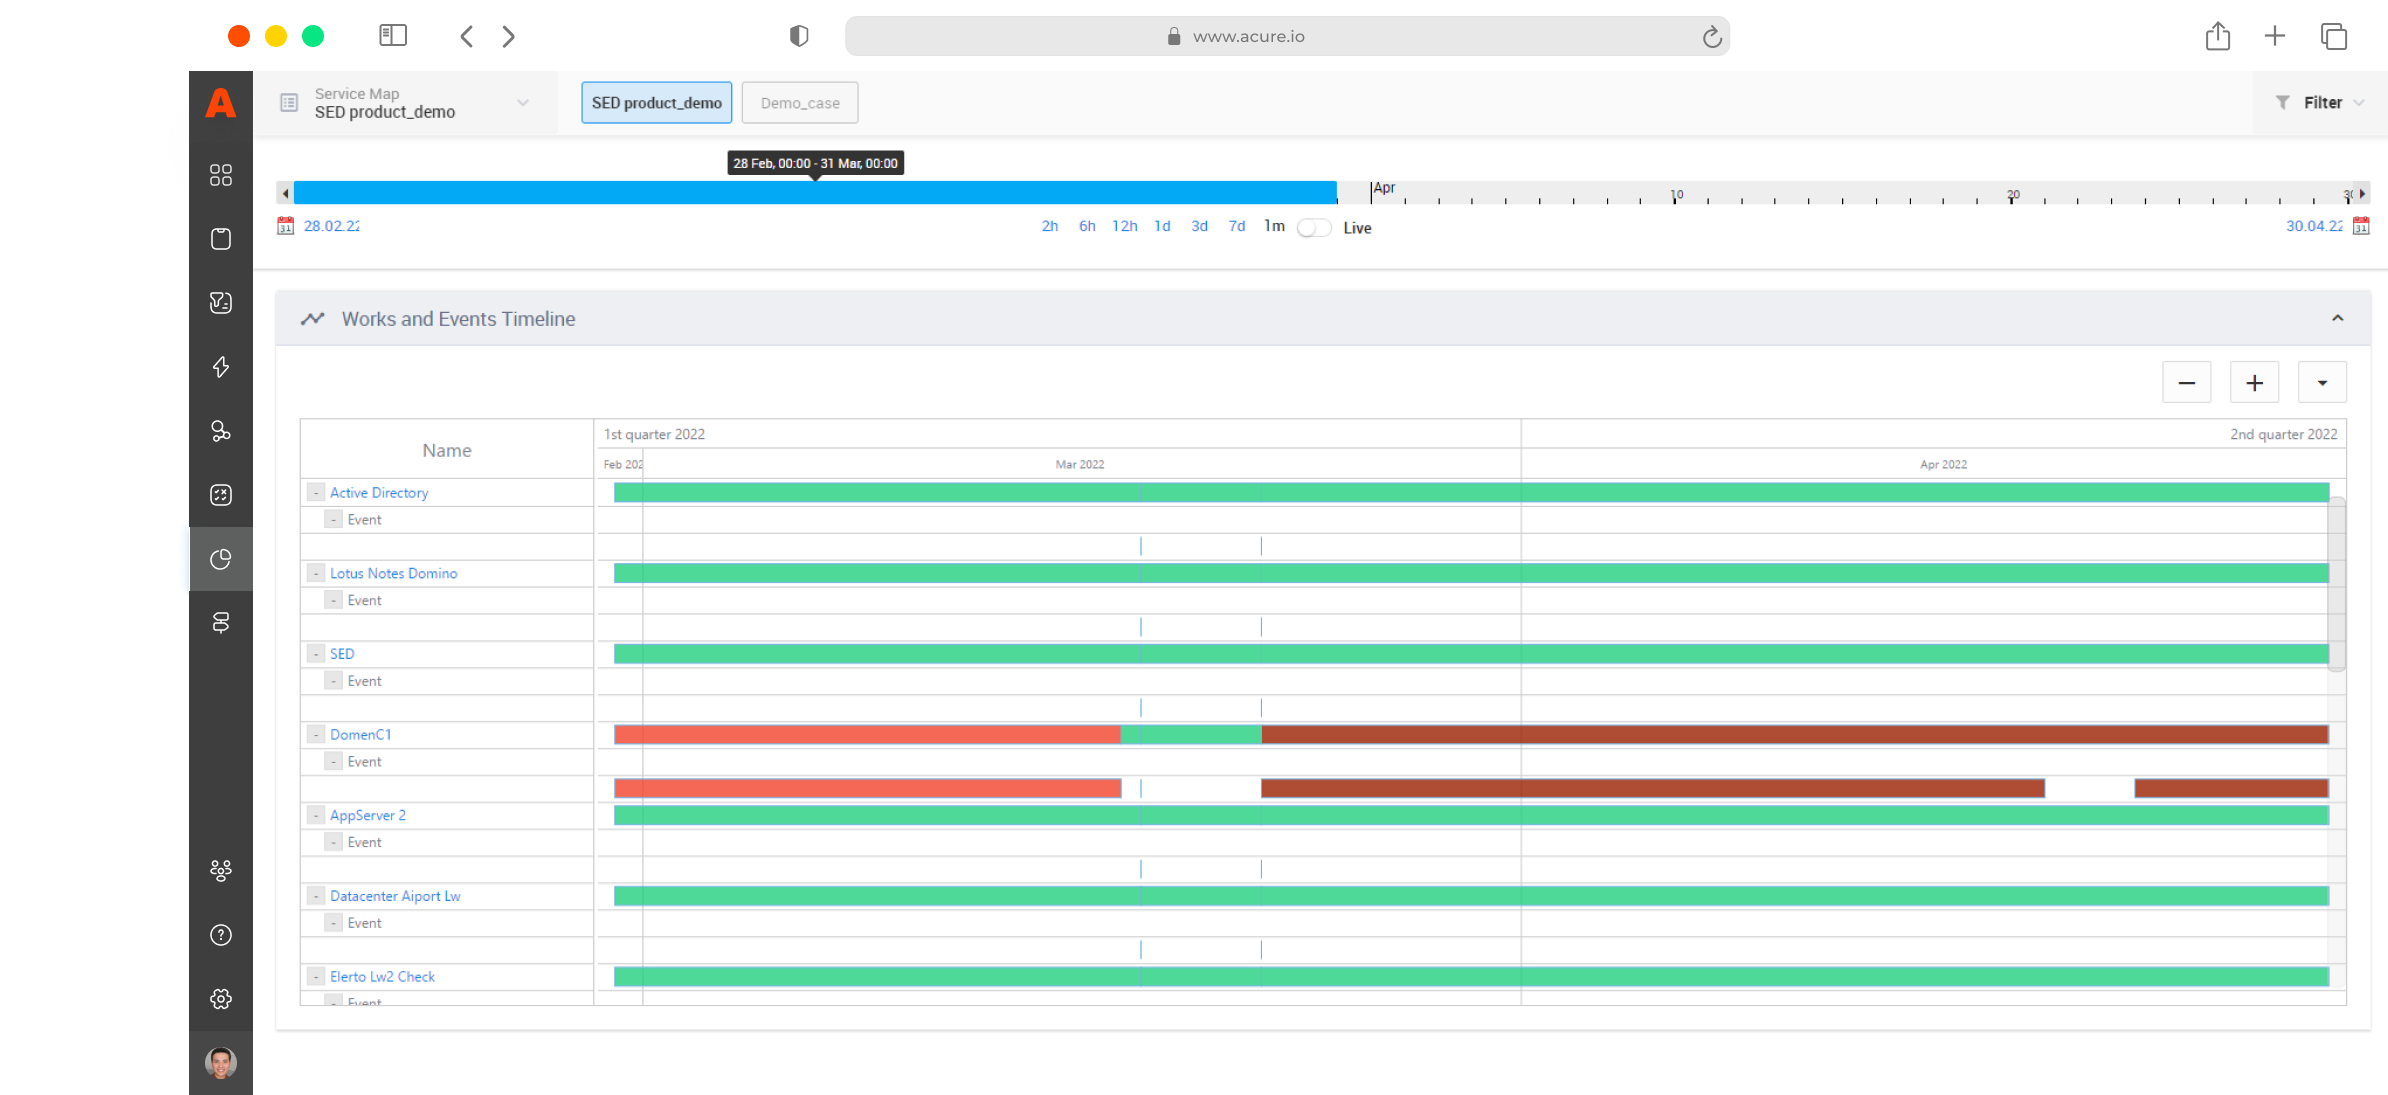 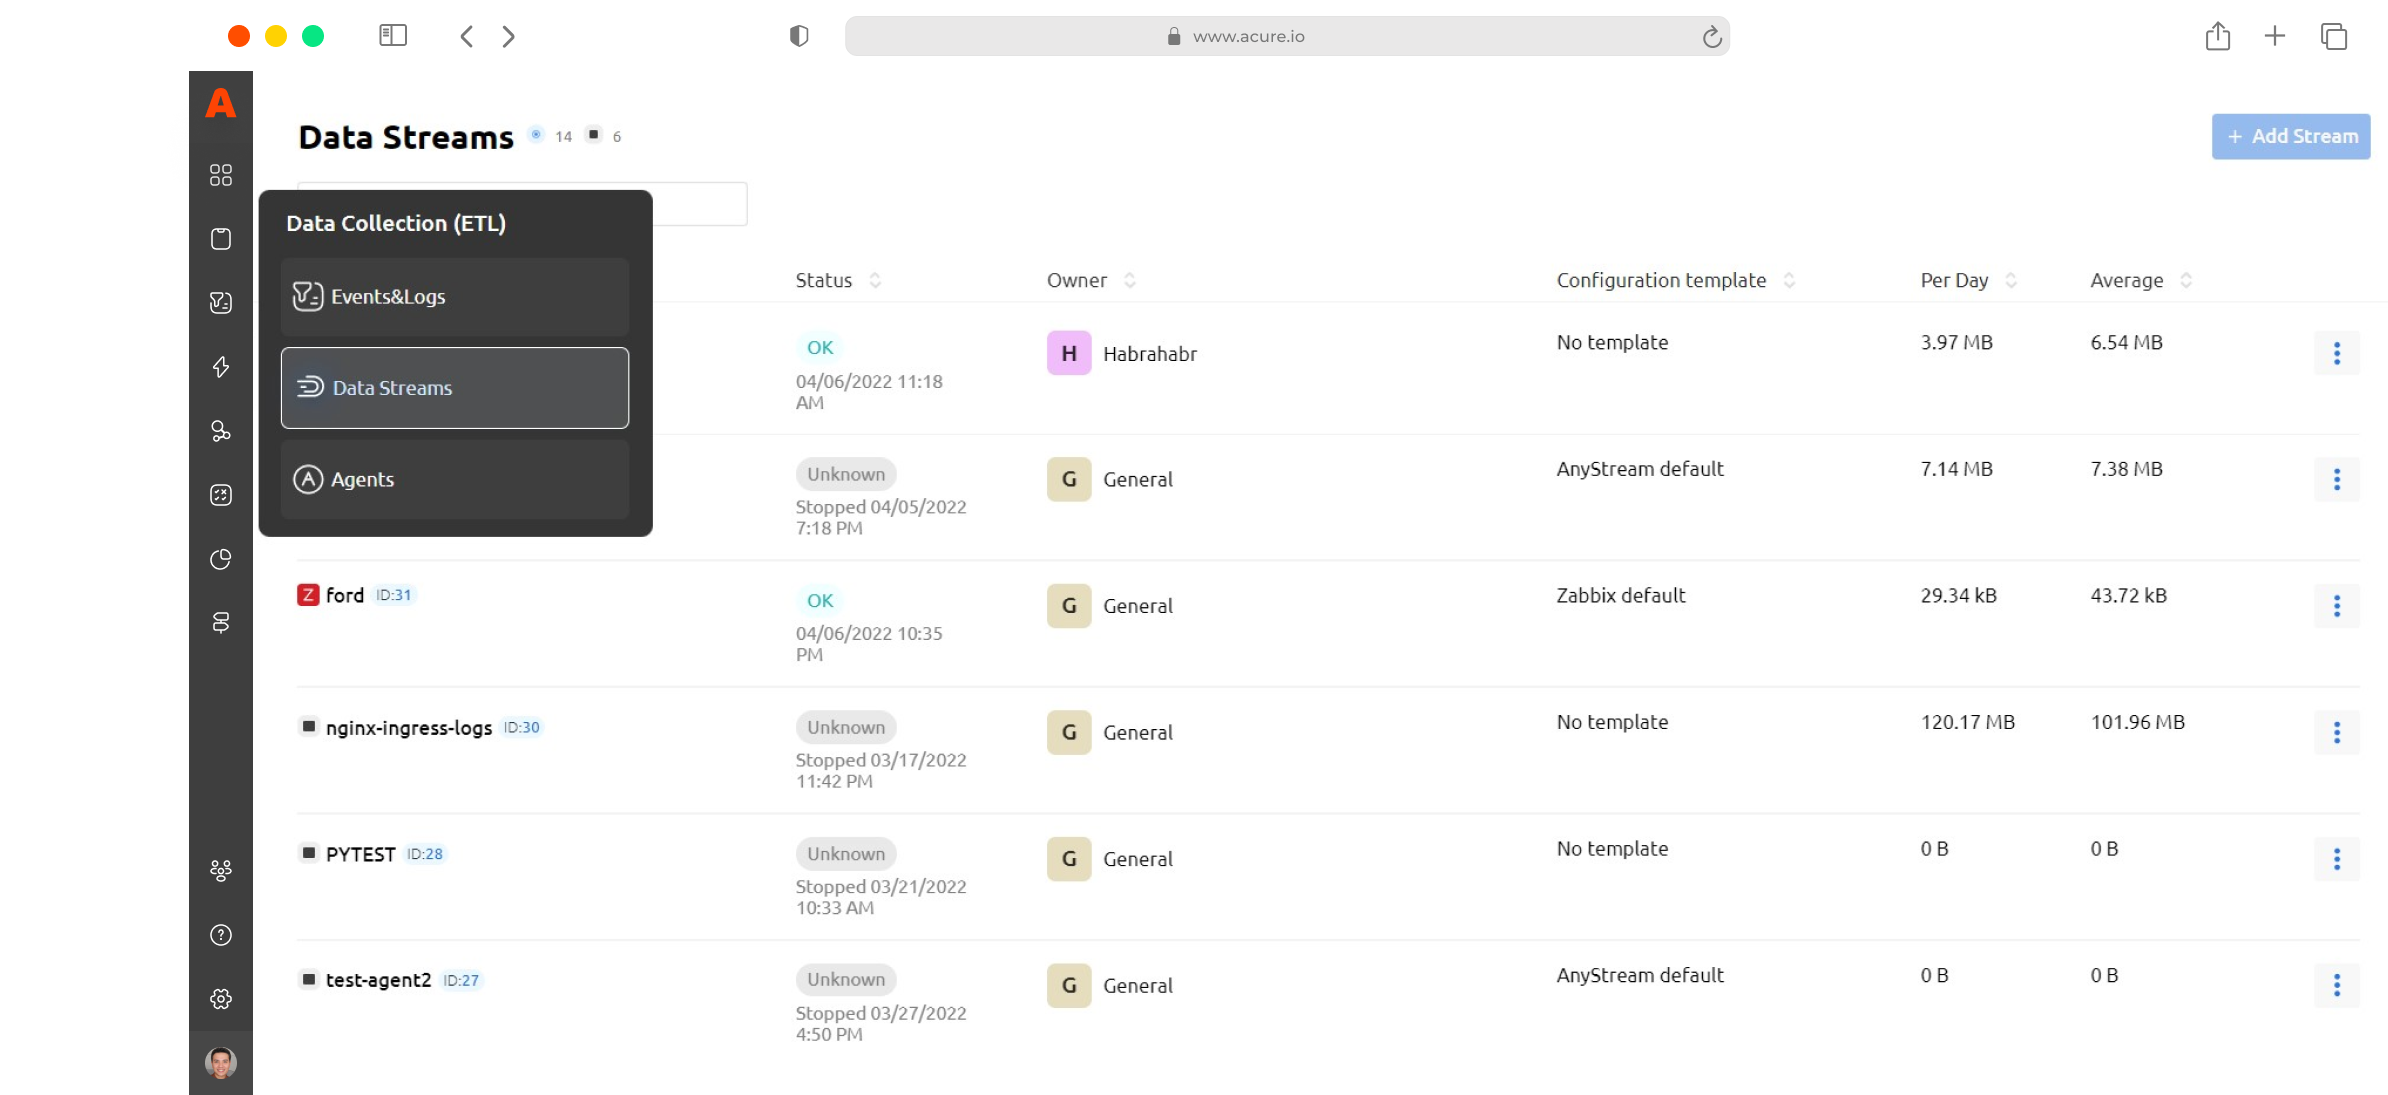 |