BizTalk360 vs. Releem
BizTalk360 vs. Releem
| Product | Rating | Most Used By | Product Summary | Starting Price |
|---|---|---|---|---|
 BizTalk360 | N/A | BizTalk360 is a Microsoft BizTalk administration tool, from Kovai.co. Users can check CPU and memory usage, start and stop Windows services, and access Event Logs with BizTalk360. Execute SQL Server queries and Stored Procedures, control SQL Server jobs, and check database sizes without leaving BizTalk360. | N/A | |
 Releem | N/A | Database performance management was a major pain point for developers: sifting through endless metrics and alerts, calculating variables, dealing with tons of documentation, query optimization, and index management. Releem is an AI-powered MySQL performance monitoring tool that helps keep database servers fast, secure and reliable. According to the vendor, its features beyond database performance monitoring and management include: 📊 Quick and simple to use with all the… | $0 per month 1 DB instance |
| BizTalk360 | Releem | |||||||||||||||
|---|---|---|---|---|---|---|---|---|---|---|---|---|---|---|---|---|
| Editions & Modules | No answers on this topic |
| ||||||||||||||
| Offerings |
| |||||||||||||||
| Entry-level Setup Fee | No setup fee | Optional | ||||||||||||||
| Additional Details | — | 25% discount for annual plan. | ||||||||||||||
| More Pricing Information | ||||||||||||||||
| BizTalk360 | Releem |
|---|
| BizTalk360 | Releem | ||||||||||||||||||
|---|---|---|---|---|---|---|---|---|---|---|---|---|---|---|---|---|---|---|---|
| SQL Performance Monitoring |
|
| BizTalk360 | Releem | |
|---|---|---|
| Small Businesses | No answers on this topic | No answers on this topic |
| Medium-sized Companies |  LogicMonitor Score 9.0 out of 10 | LogicMonitor Score 9.0 out of 10 |
| Enterprises | LogicMonitor Score 9.0 out of 10 | LogicMonitor Score 9.0 out of 10 |
| All Alternatives | View all alternatives | View all alternatives |
| BizTalk360 | Releem | |
|---|---|---|
| Likelihood to Recommend | 8.8 (2 ratings) | - (0 ratings) |
| BizTalk360 | Releem | |
|---|---|---|
| Likelihood to Recommend | Kovai.co
| Releem No answers on this topic |
| Pros | Kovai.co
| Releem No answers on this topic |
| Cons | Kovai.co
| Releem No answers on this topic |
| Alternatives Considered | Kovai.co
| Releem No answers on this topic |
| Return on Investment | Kovai.co
| Releem No answers on this topic |
| ScreenShots | Releem Screenshots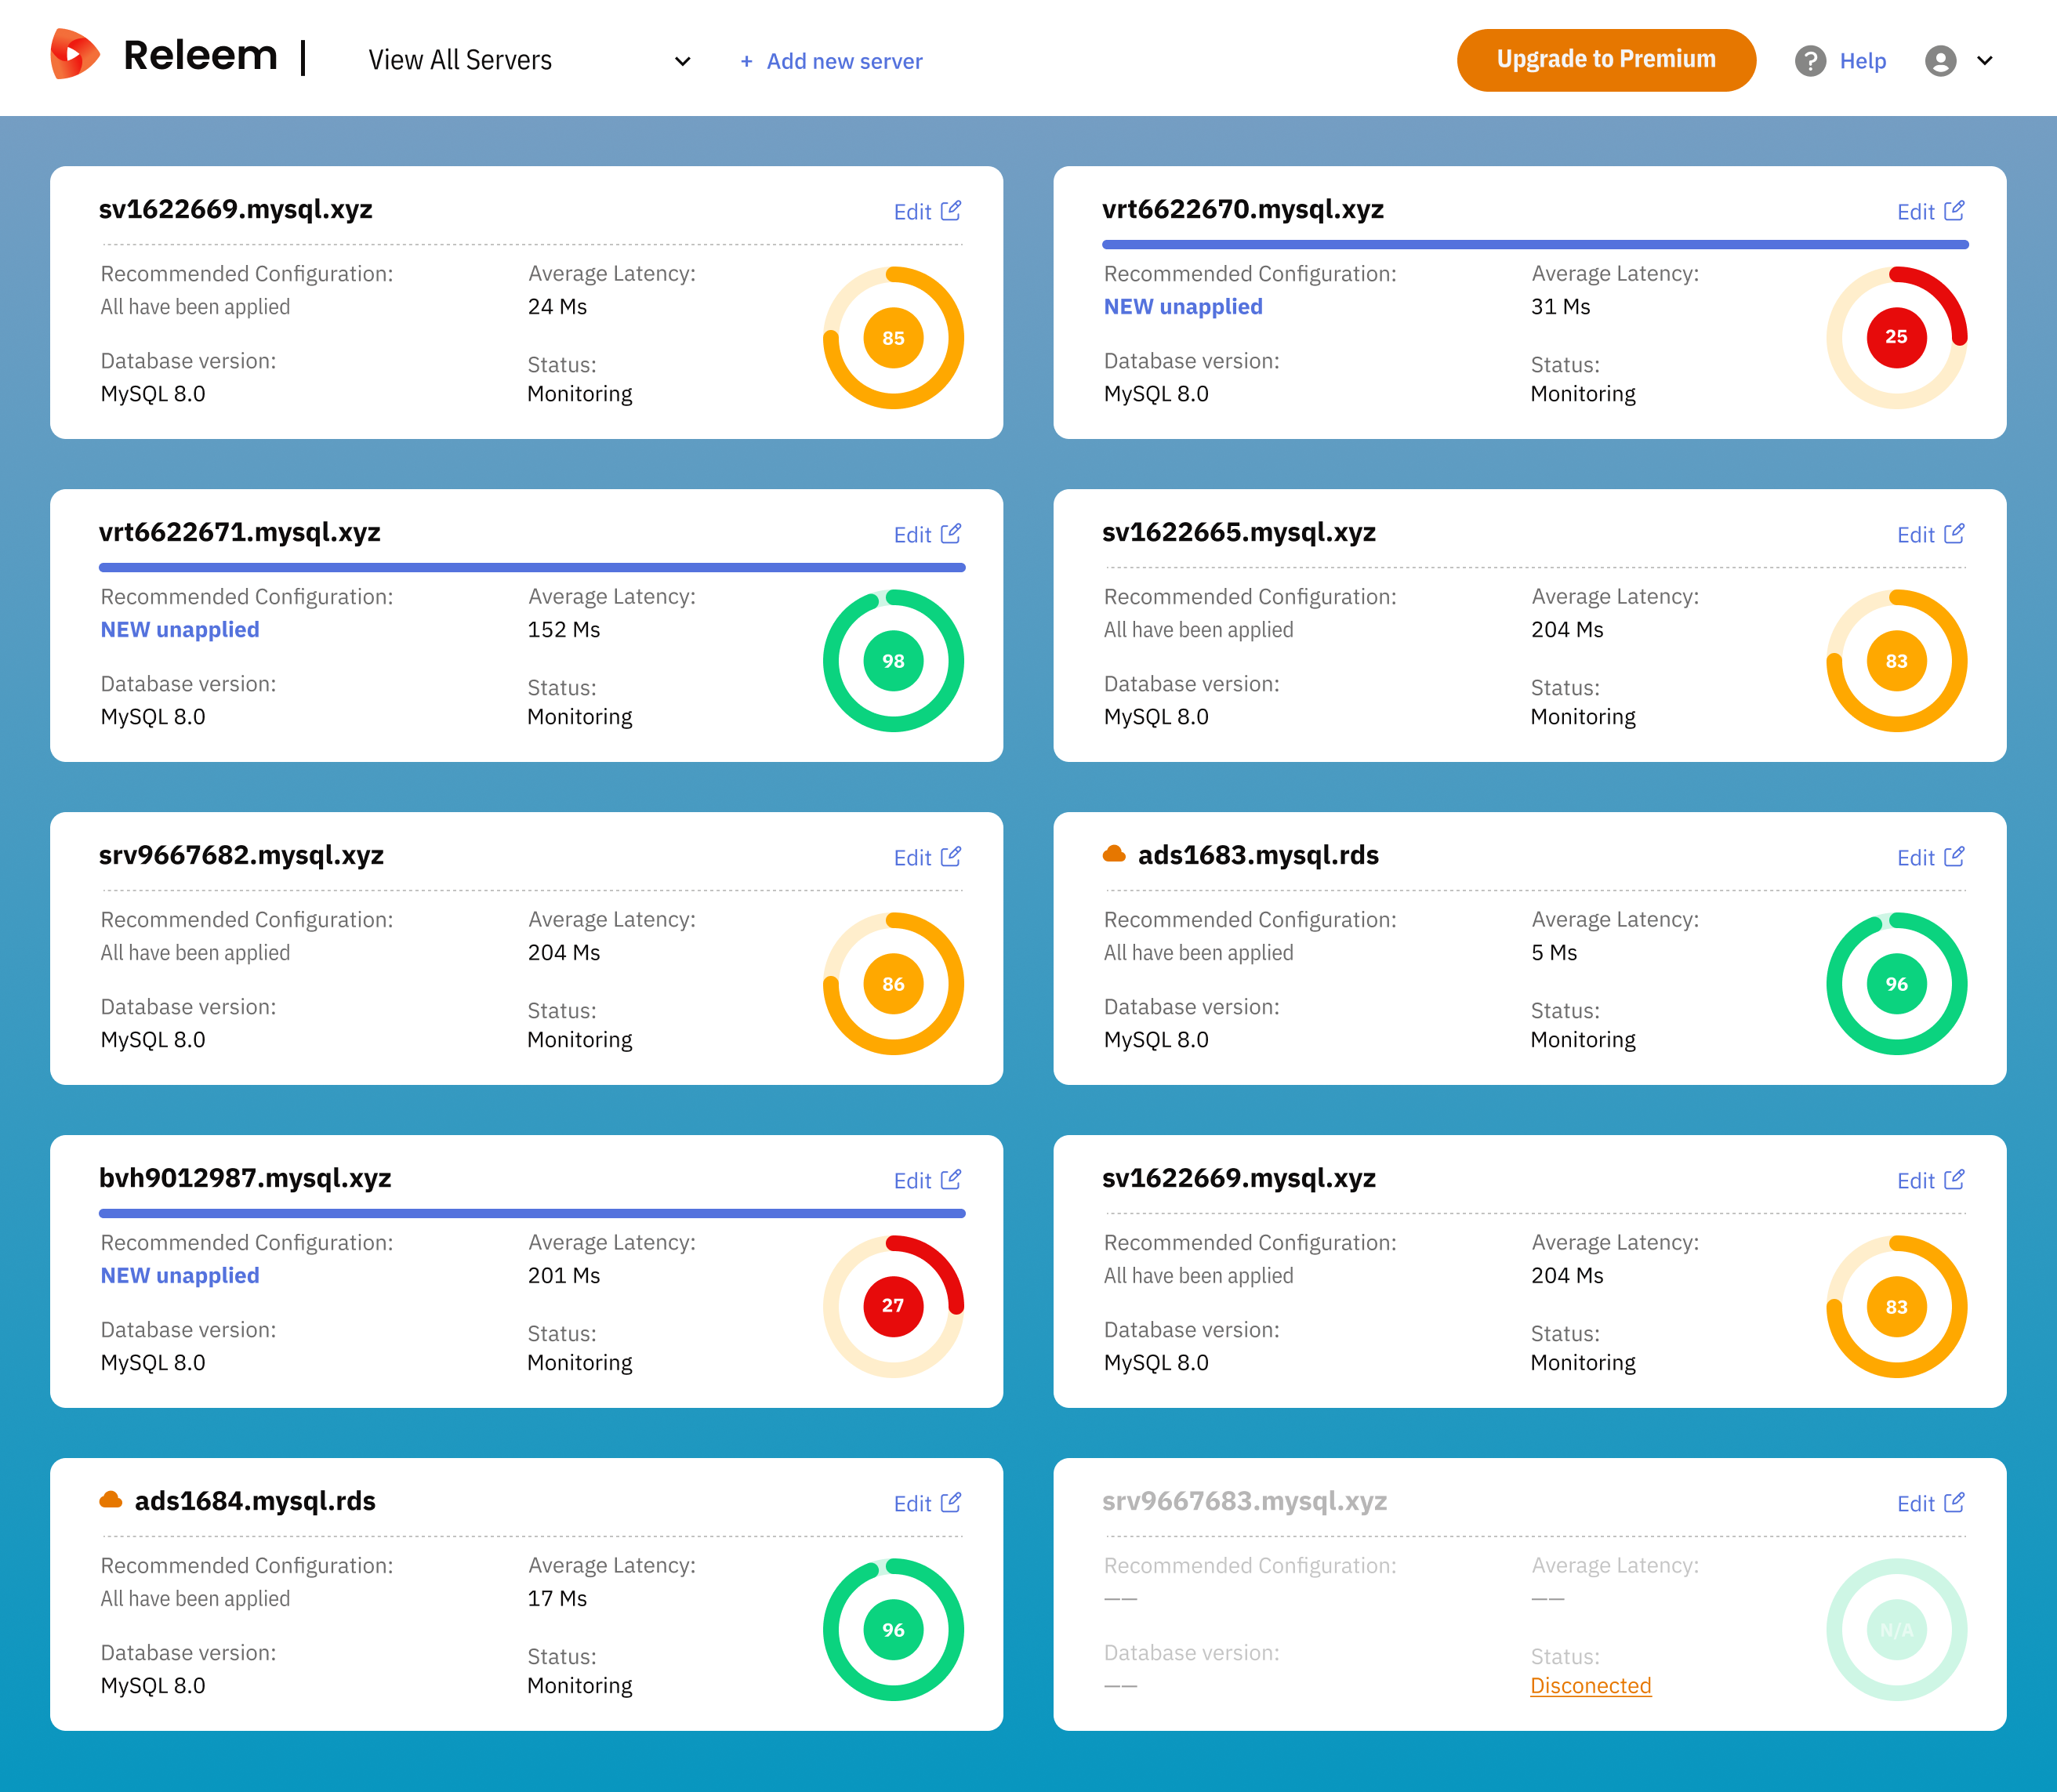 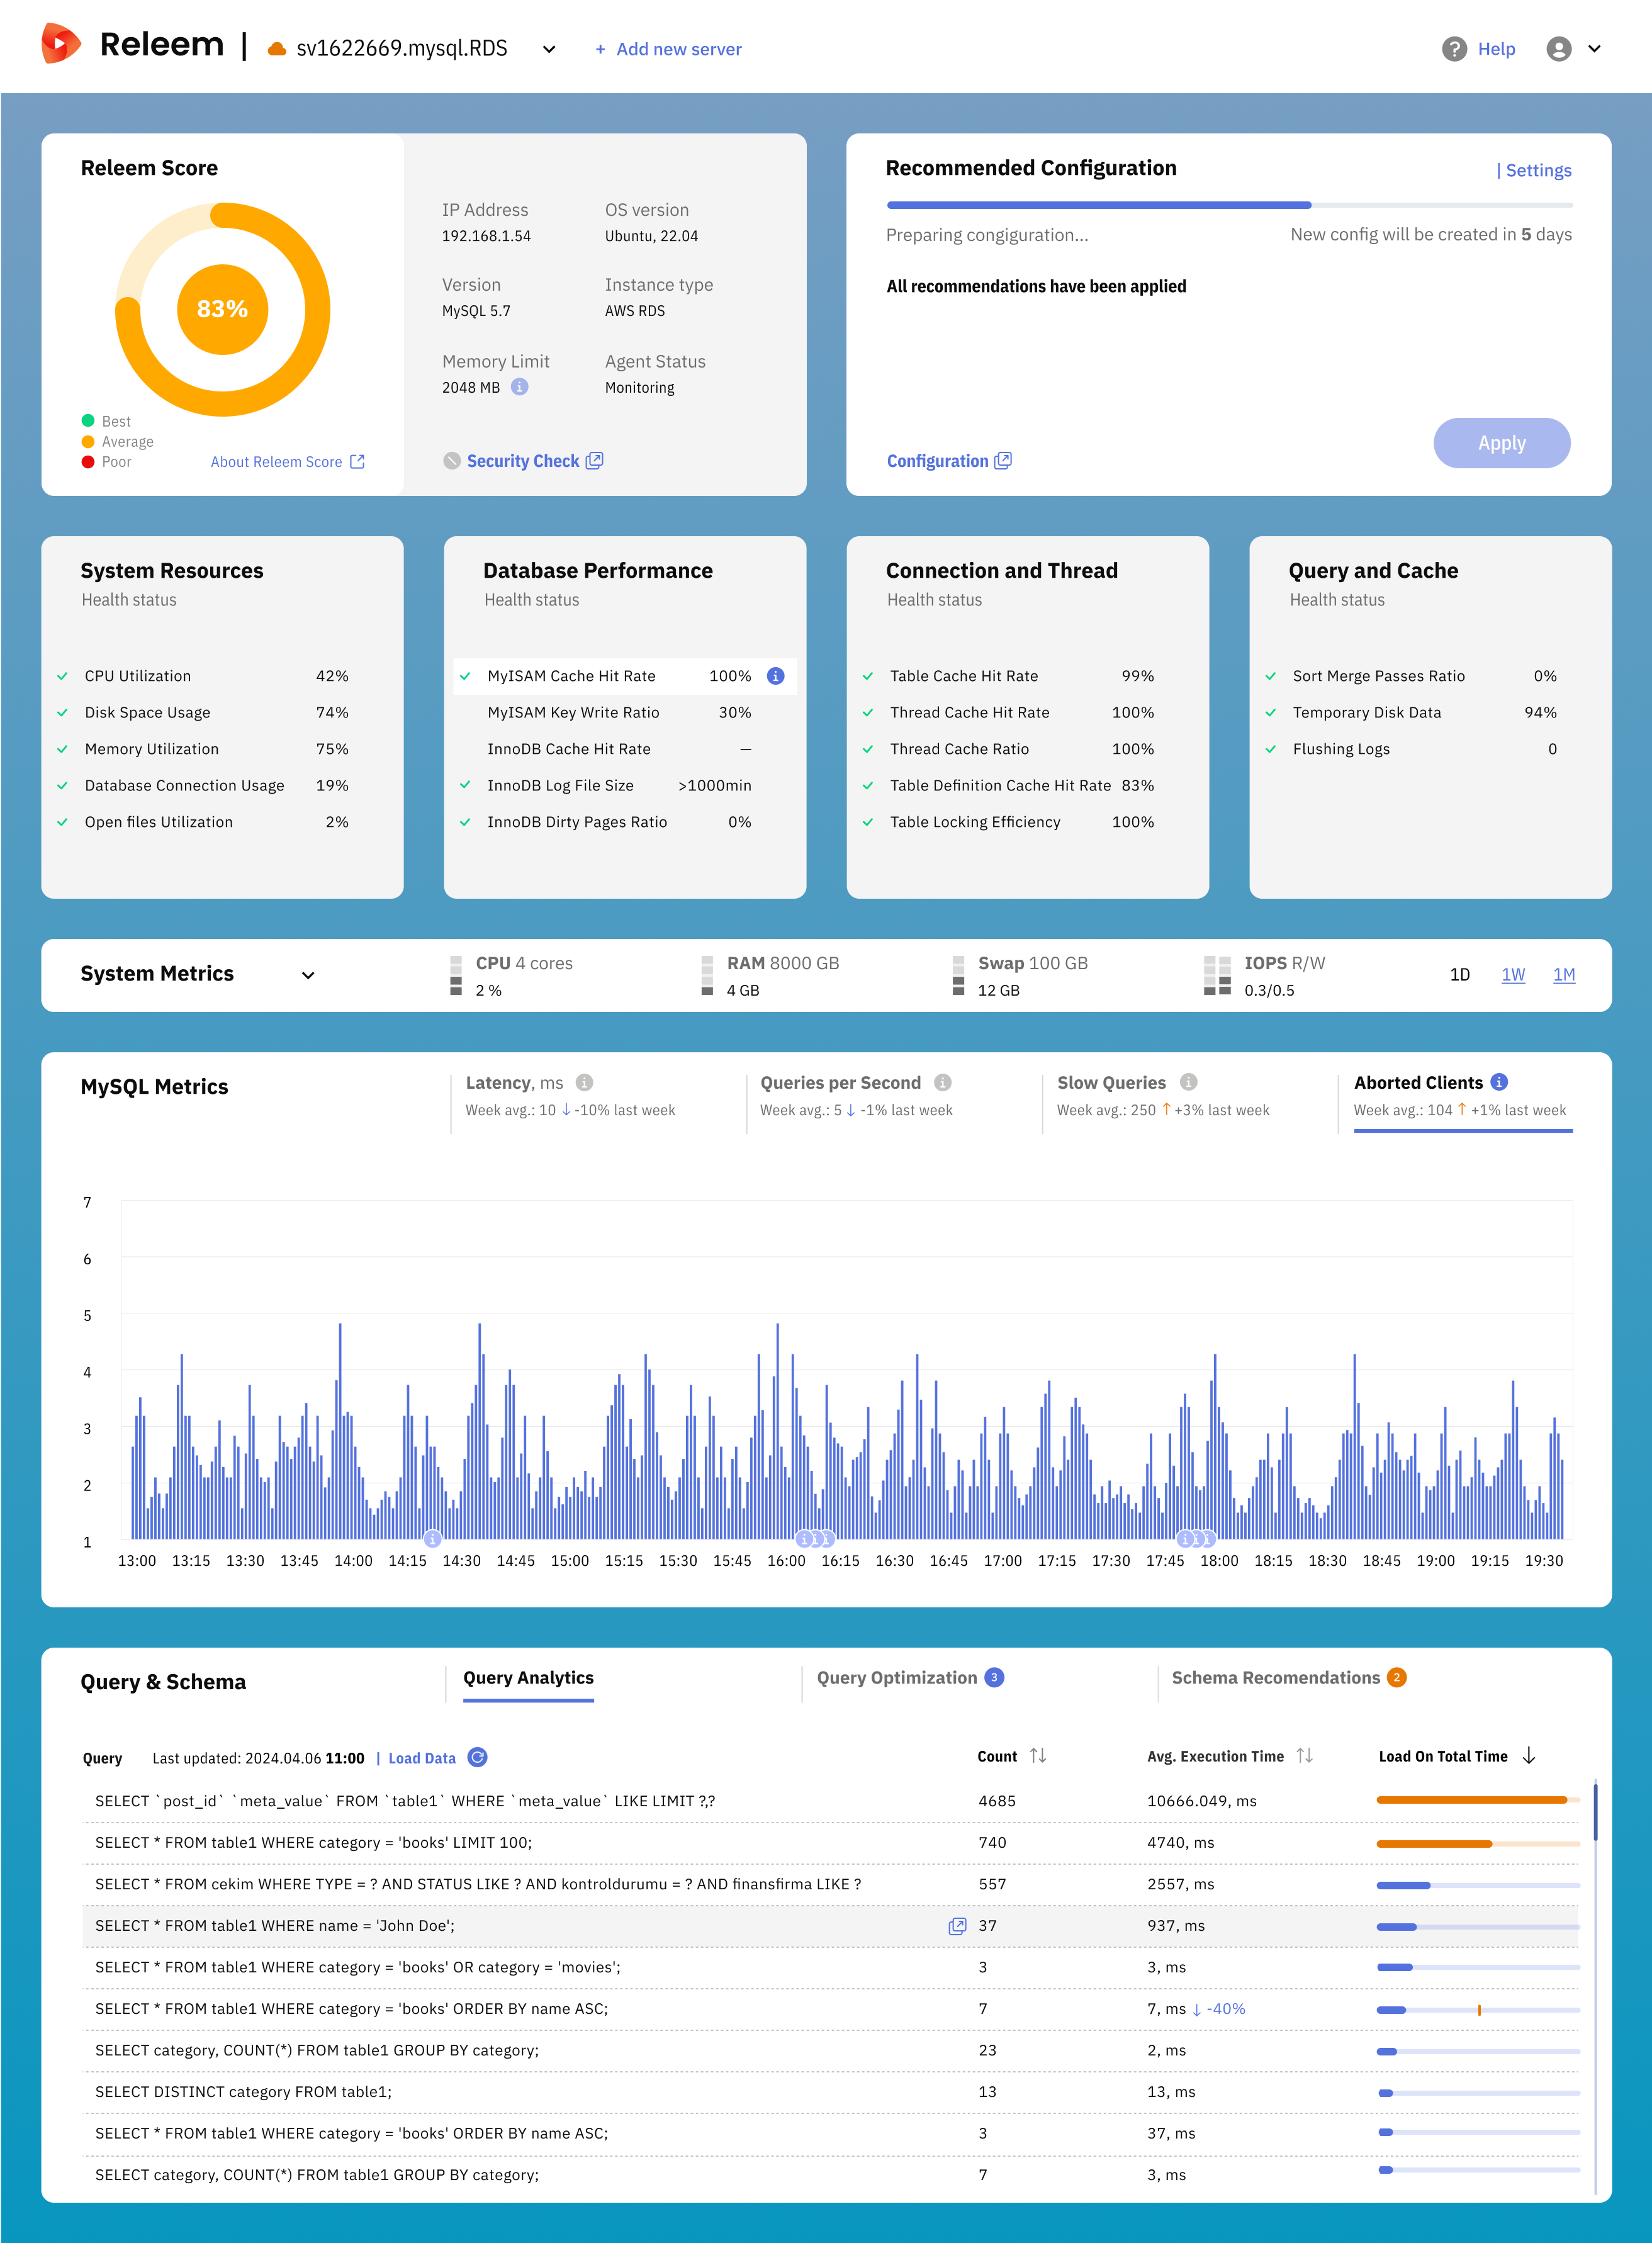 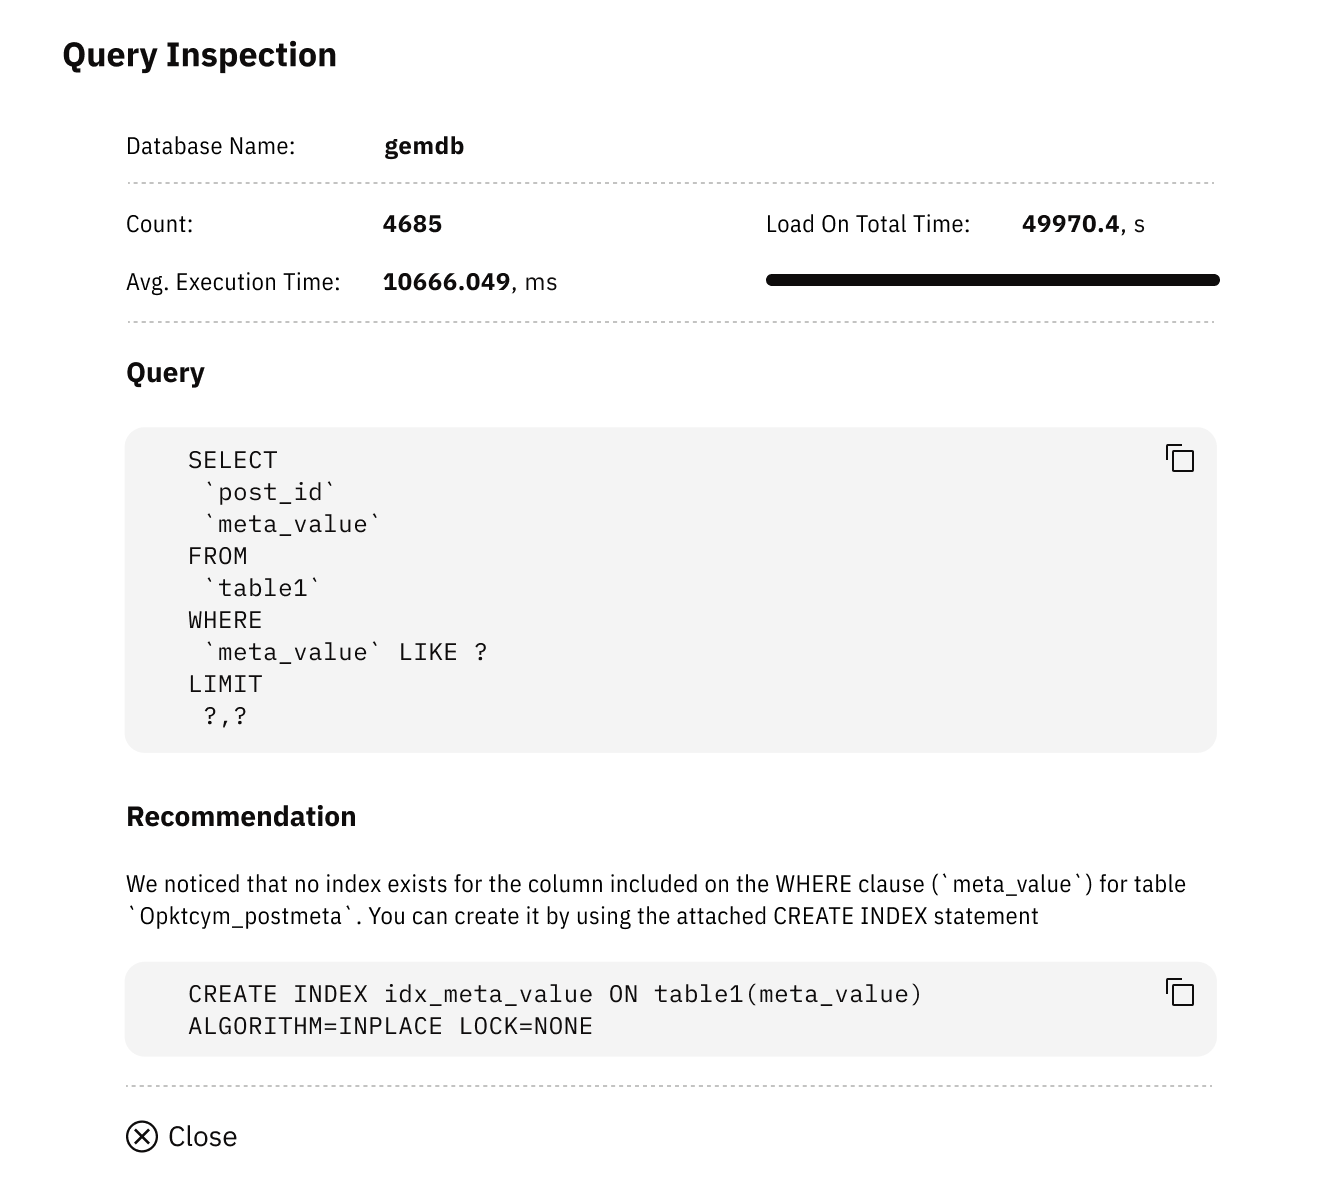 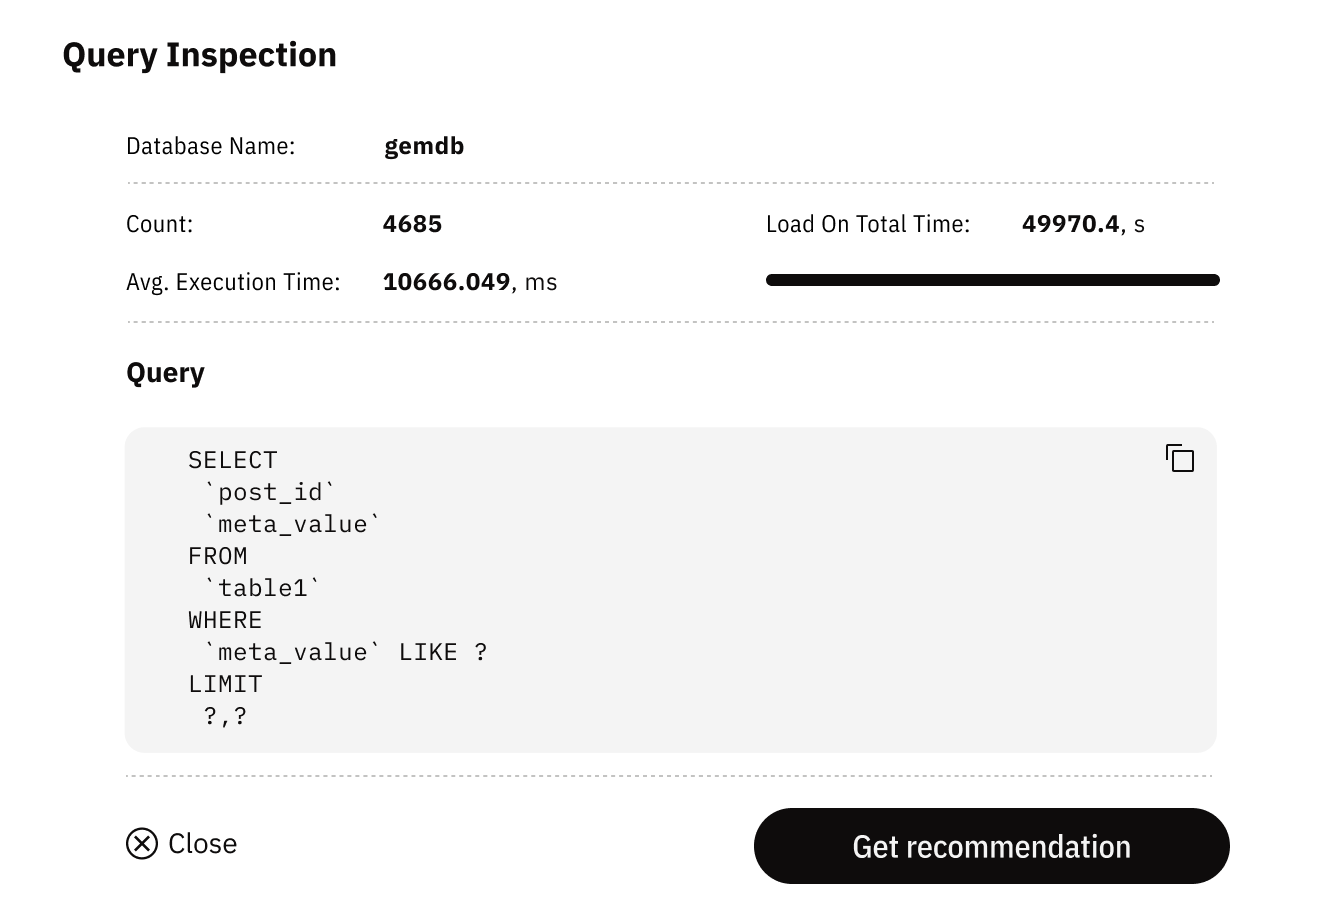 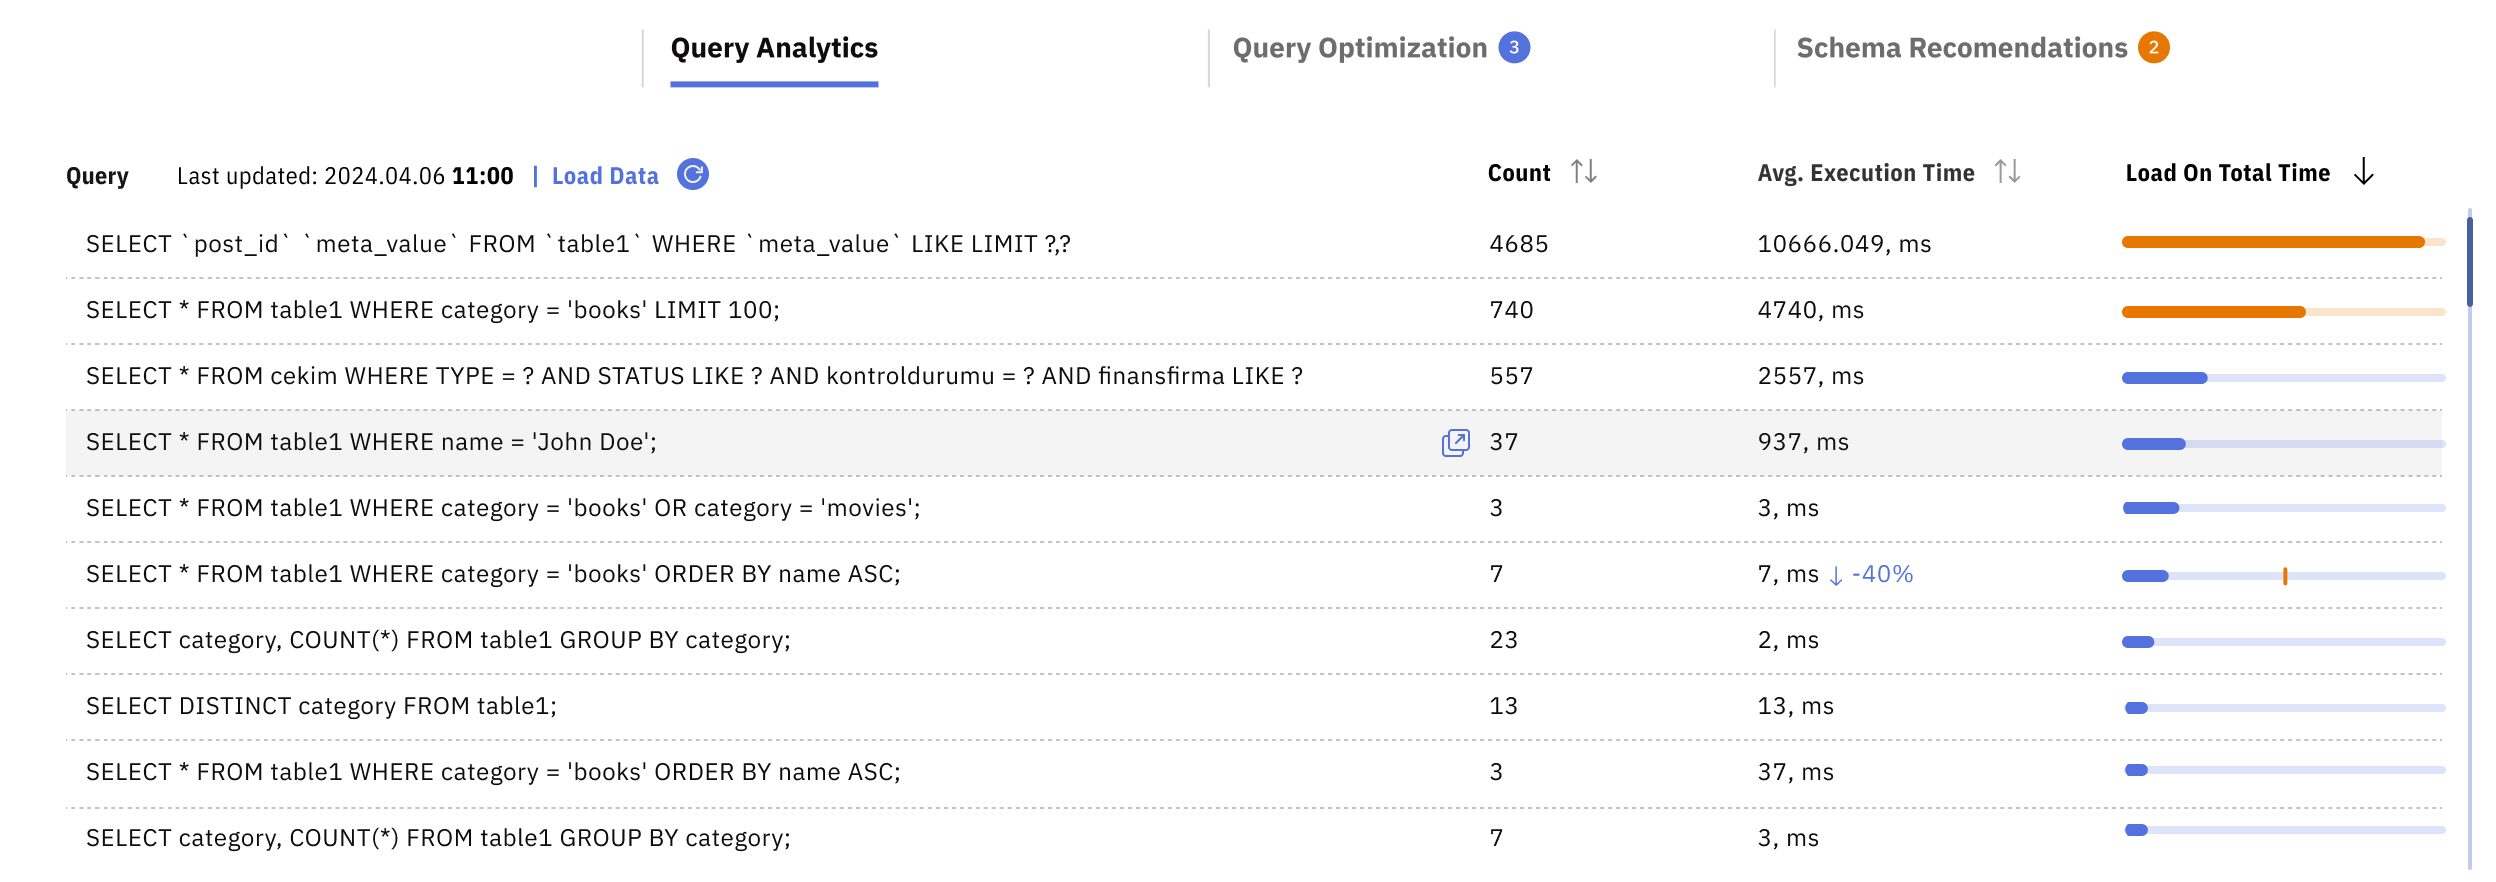 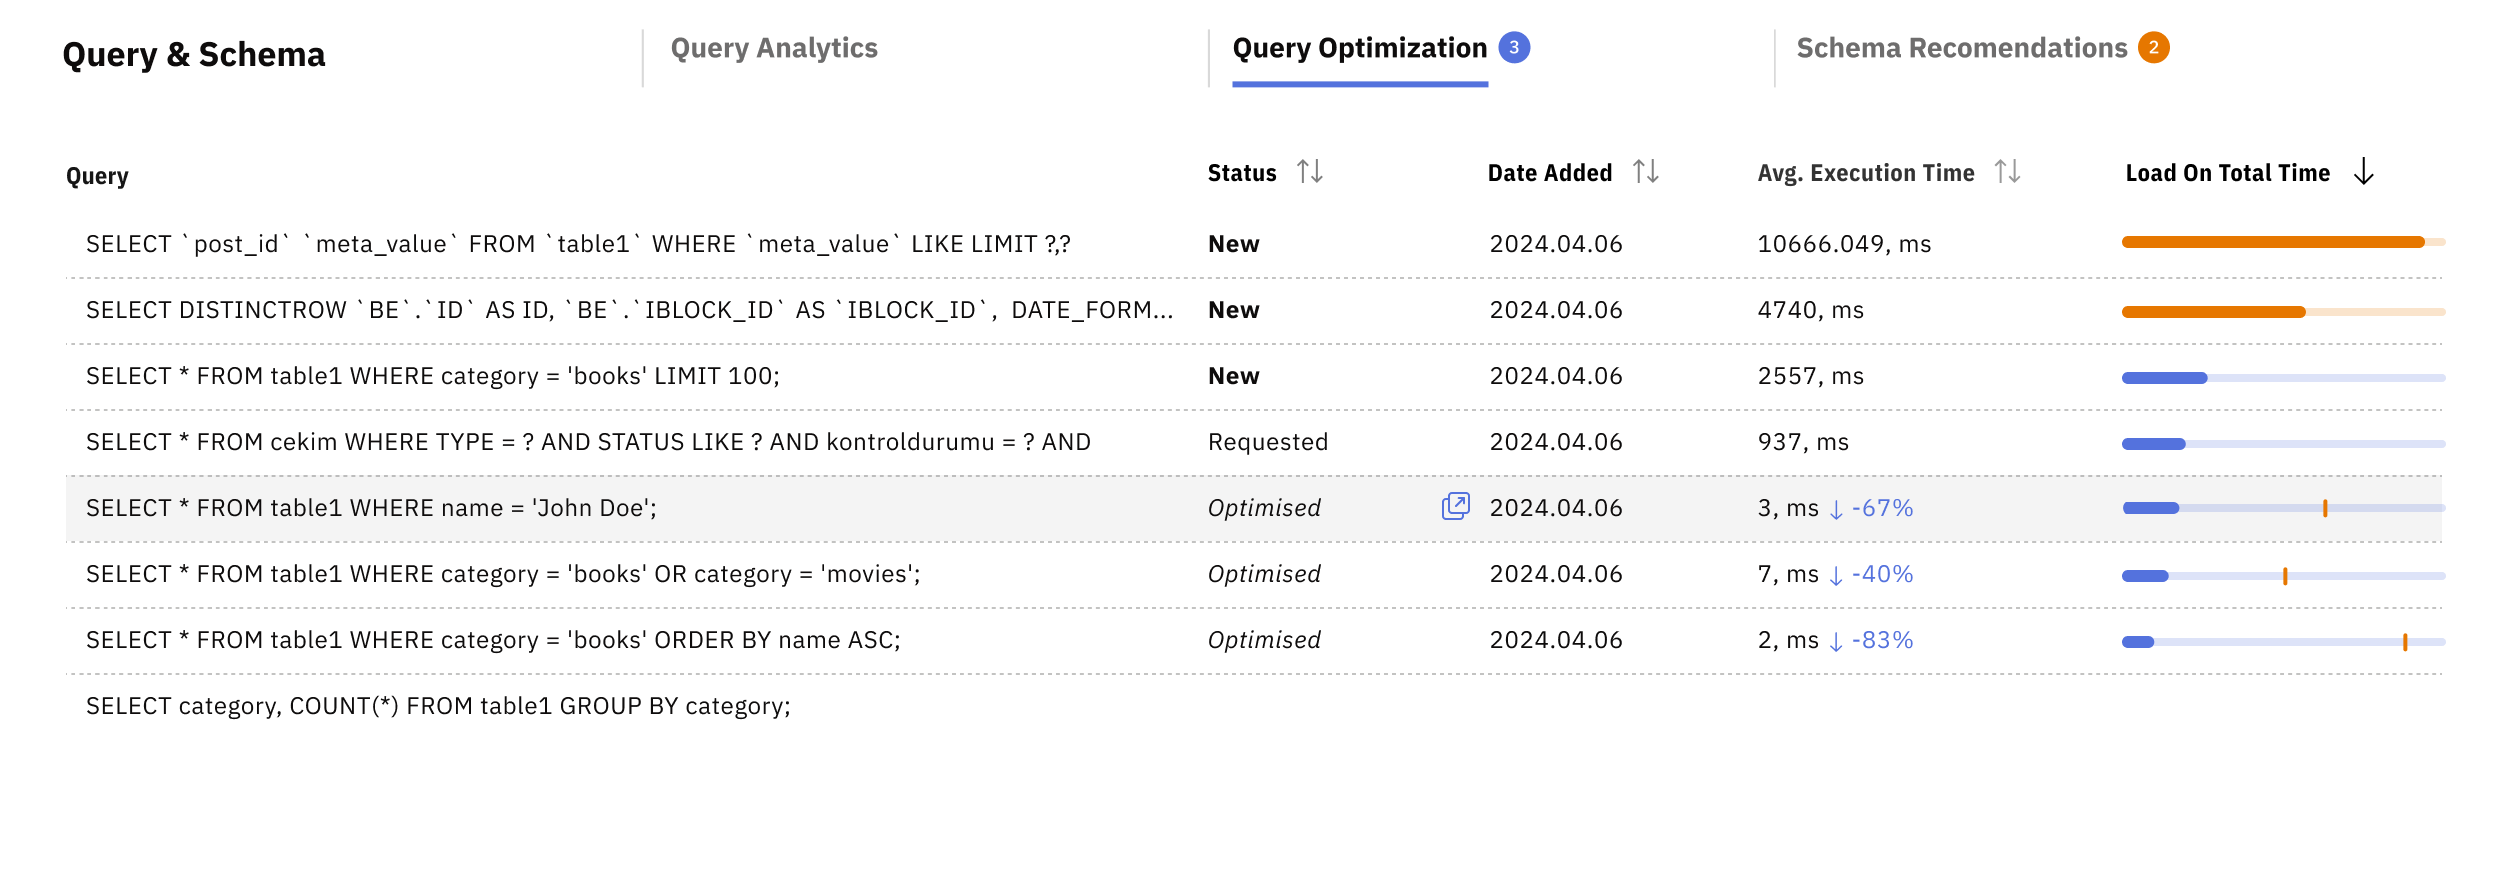 |