Bold BI, by Syncfusion vs. Plotly Dash
Bold BI, by Syncfusion vs. Plotly Dash
| Product | Rating | Most Used By | Product Summary | Starting Price |
|---|---|---|---|---|
 Bold BI, by Syncfusion | N/A | Bold BI, from software components and app development specialist Syncfusion, is designed with rich customization options to make the embedding process easy. The vendor states users can embed Bold BI into enterprise software to bring a powerful analytics platform right into apps. | $0 per year per user | |
 Plotly Dash | N/A | Plotly headquartered in Montreal creates data visualization and UI tools for ML, data science, engineering, and the sciences with language support for Python, R, Julia, and JS. Plotly's Dash aims to empower teams to build data science and ML apps that put Python, R, and Julia in the hands of business users. The vendor states that full stack apps that would typically require a front-end, backend, and dev ops team can be built and deployed in hours by data scientists with Dash. | N/A |
| Bold BI, by Syncfusion | Plotly Dash | |||||||||||||||
|---|---|---|---|---|---|---|---|---|---|---|---|---|---|---|---|---|
| Editions & Modules |
| No answers on this topic | ||||||||||||||
| Offerings |
| |||||||||||||||
| Entry-level Setup Fee | No setup fee | No setup fee | ||||||||||||||
| Additional Details | In line with the commitment Syncfusion® has made to the development community, a free plan for Bold BI is available for eligible companies and individuals. Search "Bold BI Embedded Analytics Community License" for details. Subscriptions can be paid monthly or annually. Minimum 1-year term. Subscriptions will automatically renew until cancelled. | — | ||||||||||||||
| More Pricing Information | ||||||||||||||||
| Bold BI, by Syncfusion | Plotly Dash |
|---|
| Bold BI, by Syncfusion | Plotly Dash | |||||||||||||||
|---|---|---|---|---|---|---|---|---|---|---|---|---|---|---|---|---|
| Platform Connectivity |
| |||||||||||||||
| Data Exploration |
| |||||||||||||||
| Data Preparation |
| |||||||||||||||
| Platform Data Modeling |
| |||||||||||||||
| Model Deployment |
|
| Bold BI, by Syncfusion | Plotly Dash | |
|---|---|---|
| Small Businesses |  Yellowfin Score 8.7 out of 10 |  Jupyter Notebook Score 8.5 out of 10 |
| Medium-sized Companies |  Reveal Score 10.0 out of 10 |  Posit Score 10.0 out of 10 |
| Enterprises |  Kyvos Semantic Layer Score 9.5 out of 10 | Posit Score 10.0 out of 10 |
| All Alternatives | View all alternatives | View all alternatives |
| Bold BI, by Syncfusion | Plotly Dash | |
|---|---|---|
| Likelihood to Recommend | - (0 ratings) | 8.0 (4 ratings) |
| Bold BI, by Syncfusion | Plotly Dash | |
|---|---|---|
| Likelihood to Recommend | Syncfusion No answers on this topic | Plotly
|
| Pros | Syncfusion No answers on this topic | Plotly
|
| Cons | Syncfusion No answers on this topic | Plotly
|
| Alternatives Considered | Syncfusion No answers on this topic | Plotly |
| Return on Investment | Syncfusion No answers on this topic | Plotly
|
| ScreenShots | Bold BI, by Syncfusion Screenshots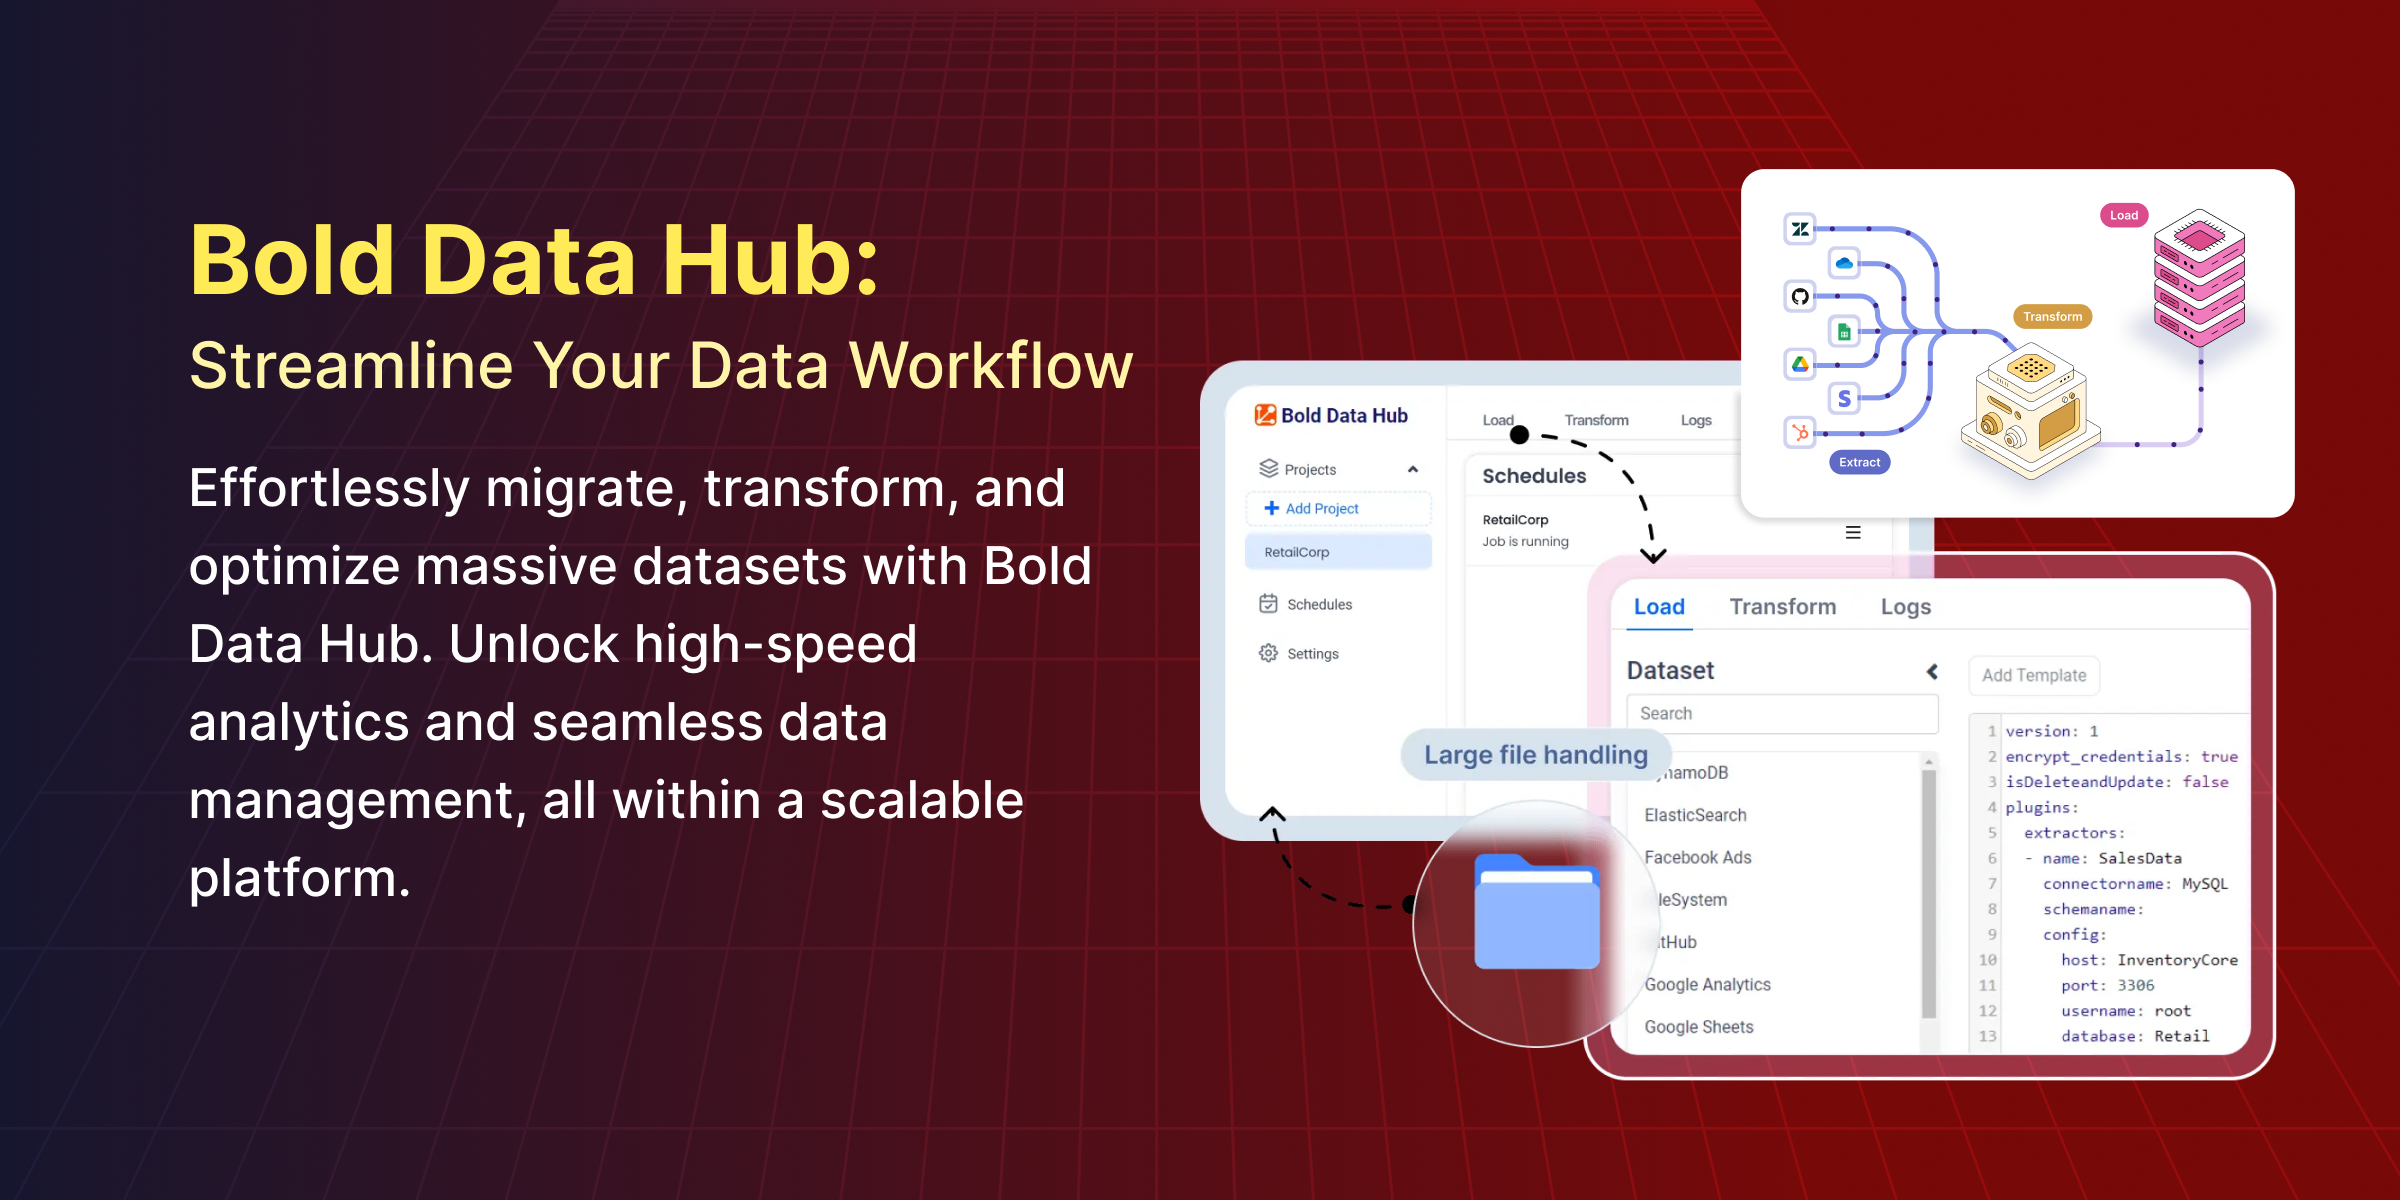 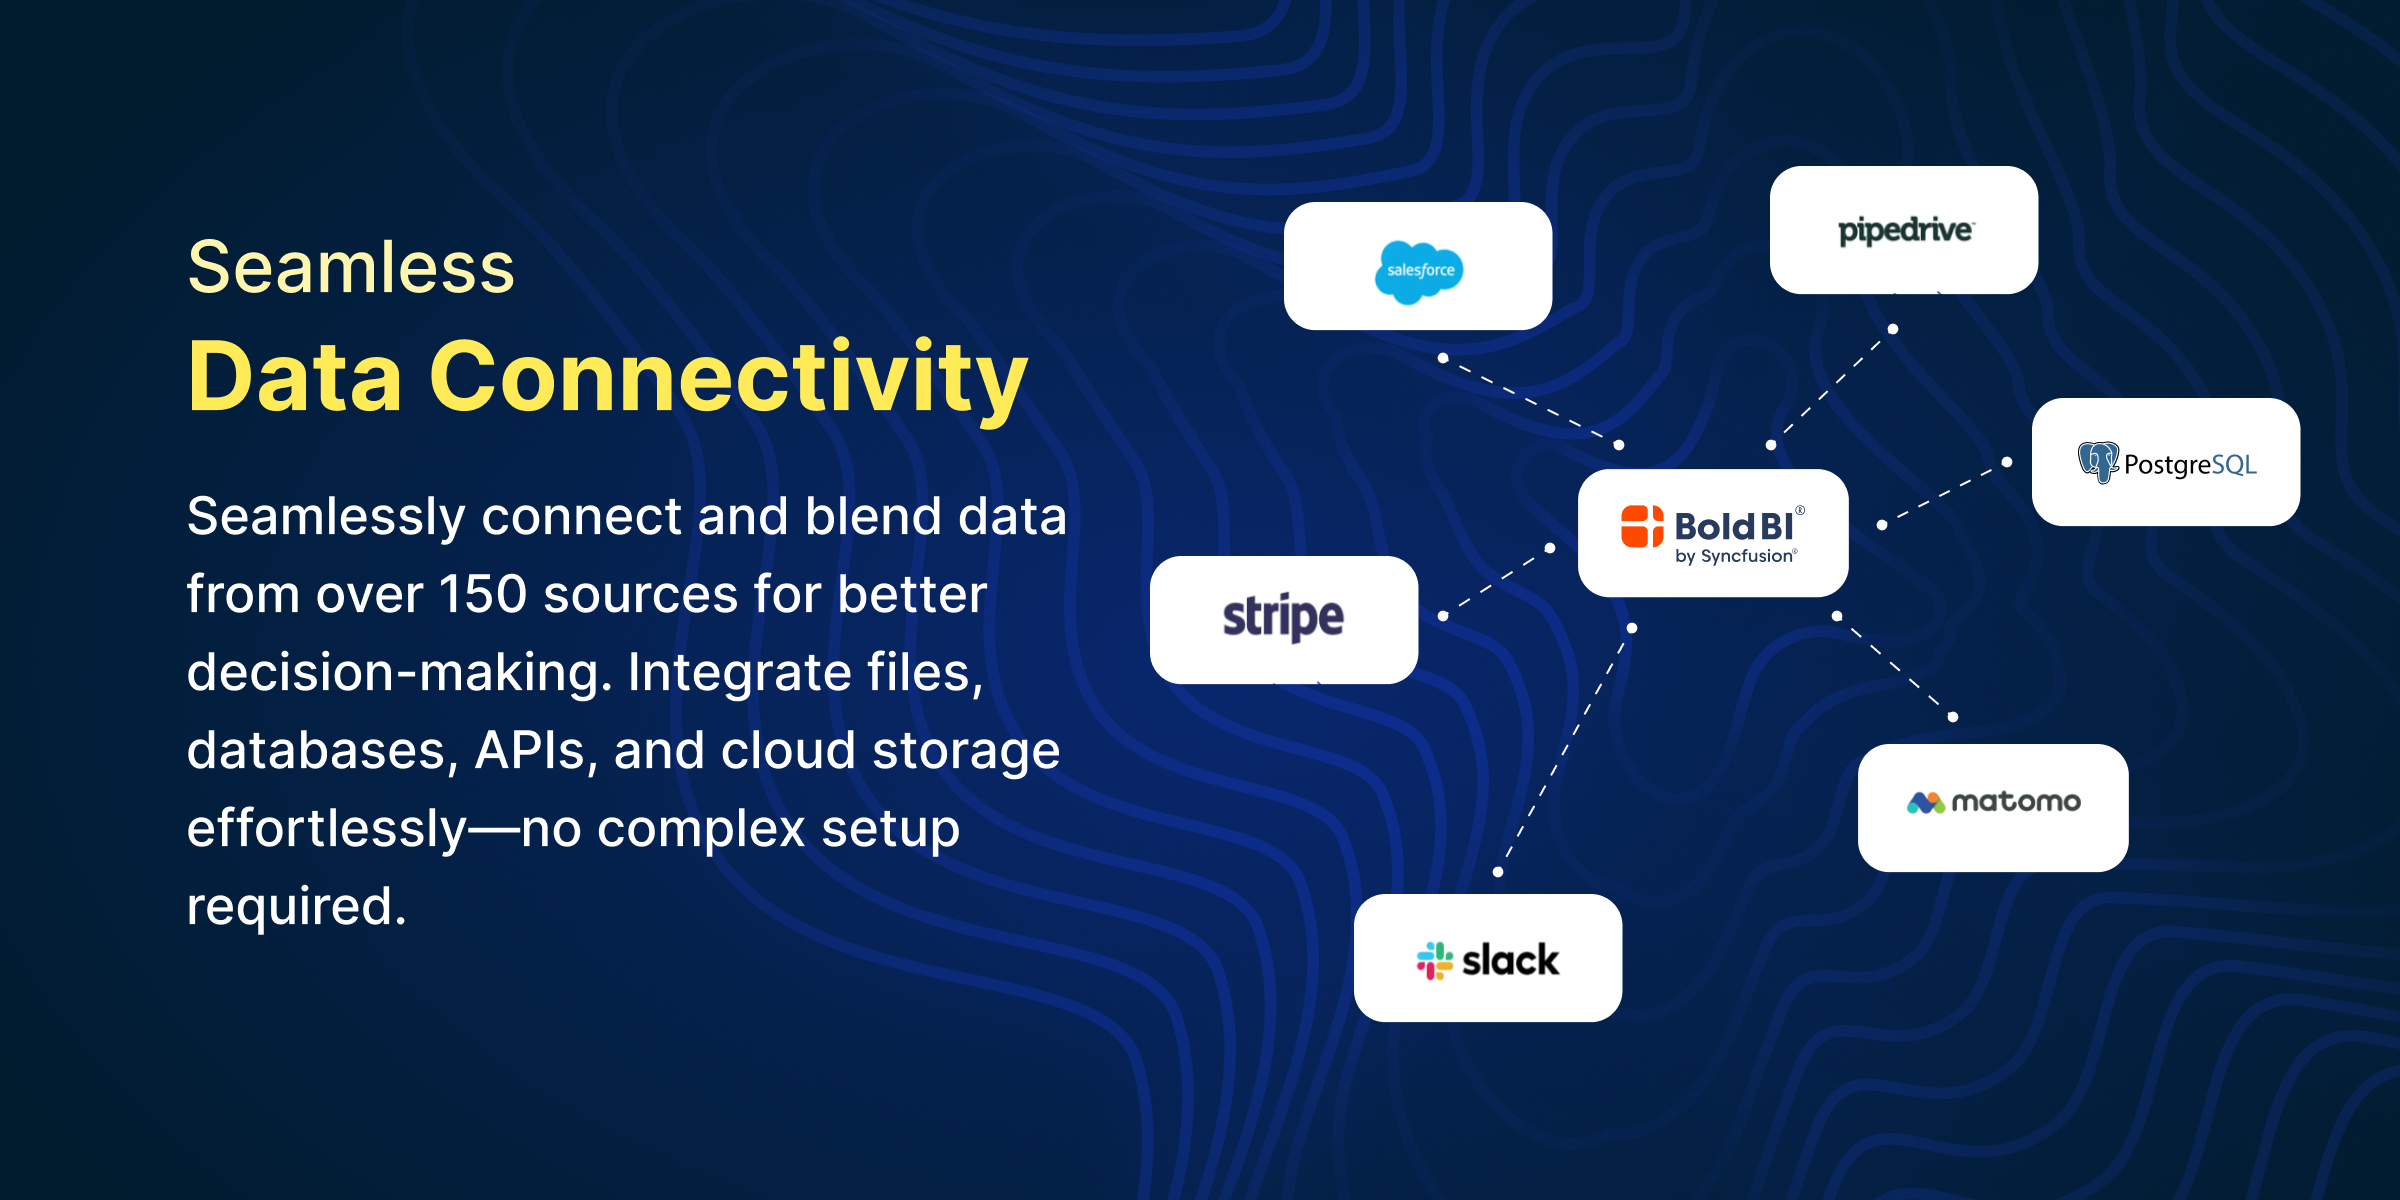 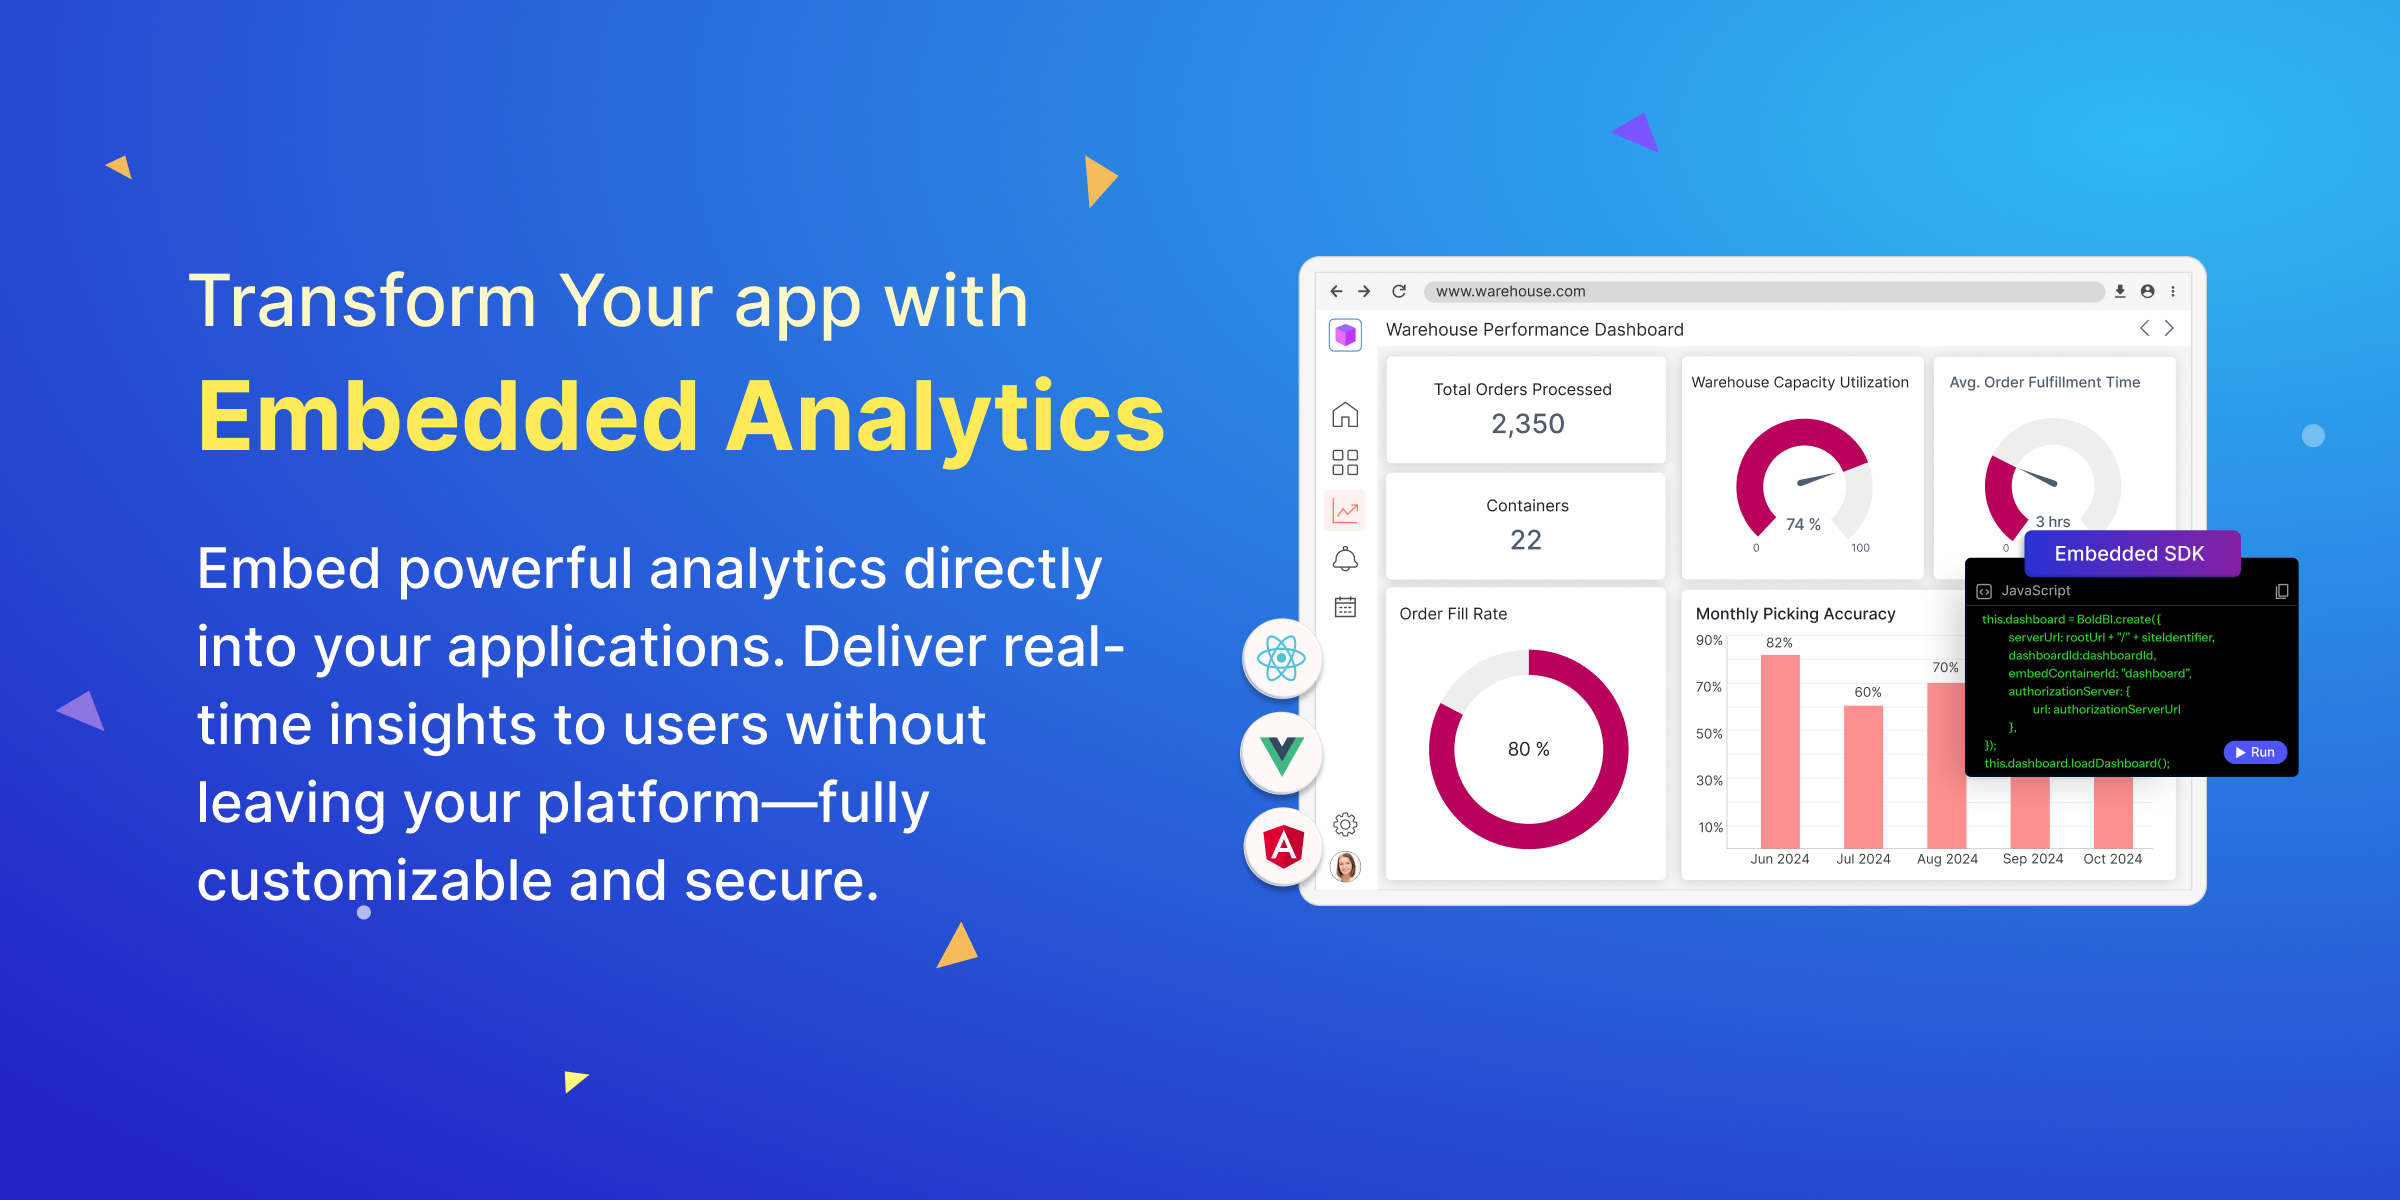 |