CyberGRX vs. Prewave
CyberGRX vs. Prewave
| Product | Rating | Most Used By | Product Summary | Starting Price |
|---|---|---|---|---|
 CyberGRX | N/A | CyberGRX in Denver offers a vendor / third-party risk management software platform. | N/A | |
 Prewave | Enterprise companies (1,001+ employees) | Prewave is a supply chain risk platform used by manufacturing companies to improve the transparency and resiliency of supply chains. The artificial intelligence (AI) based platform identifies risks in supply chains based on public information automatically and at an early stage. With this information companies have the advantage and can counteract possible delivery bottlenecks and production stops on time. Also, potential violations of sustainability or the impact of natural disasters up… | $0 |
| CyberGRX | Prewave | |||||||||||||||
|---|---|---|---|---|---|---|---|---|---|---|---|---|---|---|---|---|
| Editions & Modules | No answers on this topic |
| ||||||||||||||
| Offerings |
| |||||||||||||||
| Entry-level Setup Fee | No setup fee | Optional | ||||||||||||||
| Additional Details | — | Prewave is a prescription-based platform, we charge a monthly fee for the use of our product. The pricing varies greatly depending on the number of suppliers you intend to monitor. | ||||||||||||||
| More Pricing Information | ||||||||||||||||
| CyberGRX | Prewave | |
|---|---|---|
| Small Businesses | No answers on this topic | No answers on this topic |
| Medium-sized Companies | No answers on this topic | No answers on this topic |
| Enterprises |  GEP Quantum Intelligence Score 8.8 out of 10 | GEP Quantum Intelligence Score 8.8 out of 10 |
| All Alternatives | View all alternatives | View all alternatives |
| CyberGRX | Prewave | |
|---|---|---|
| ScreenShots | Prewave Screenshots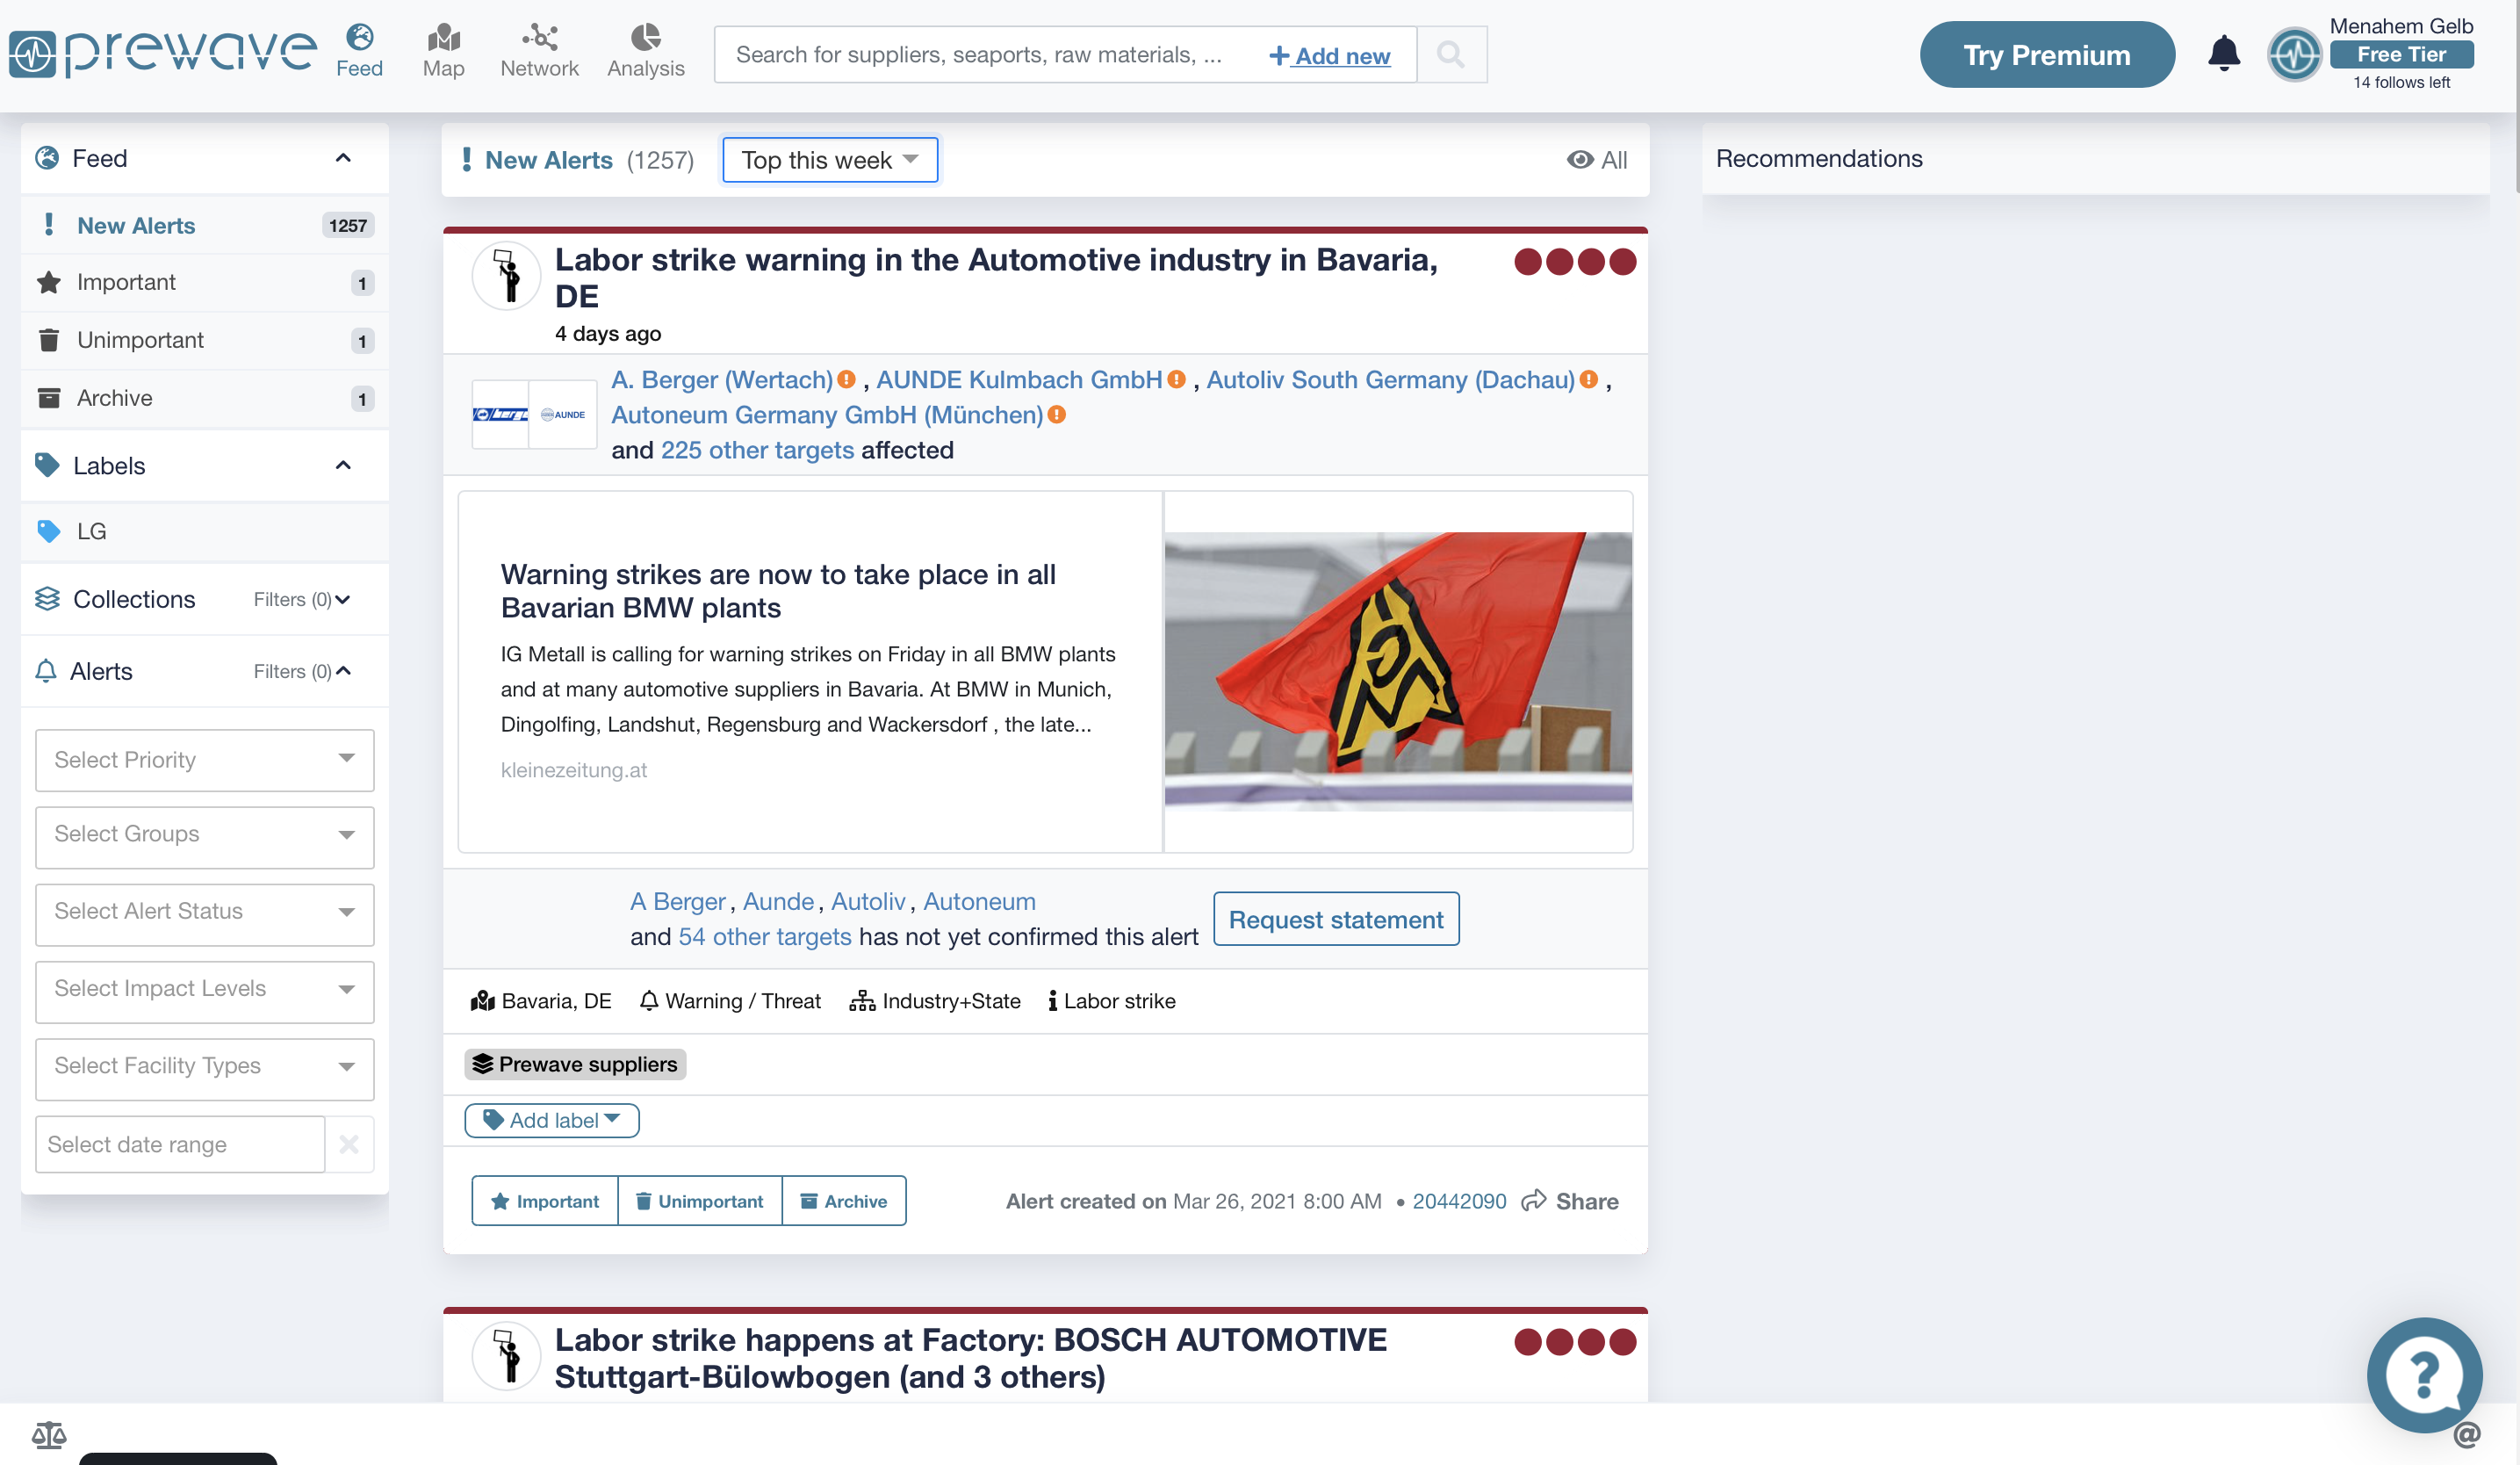 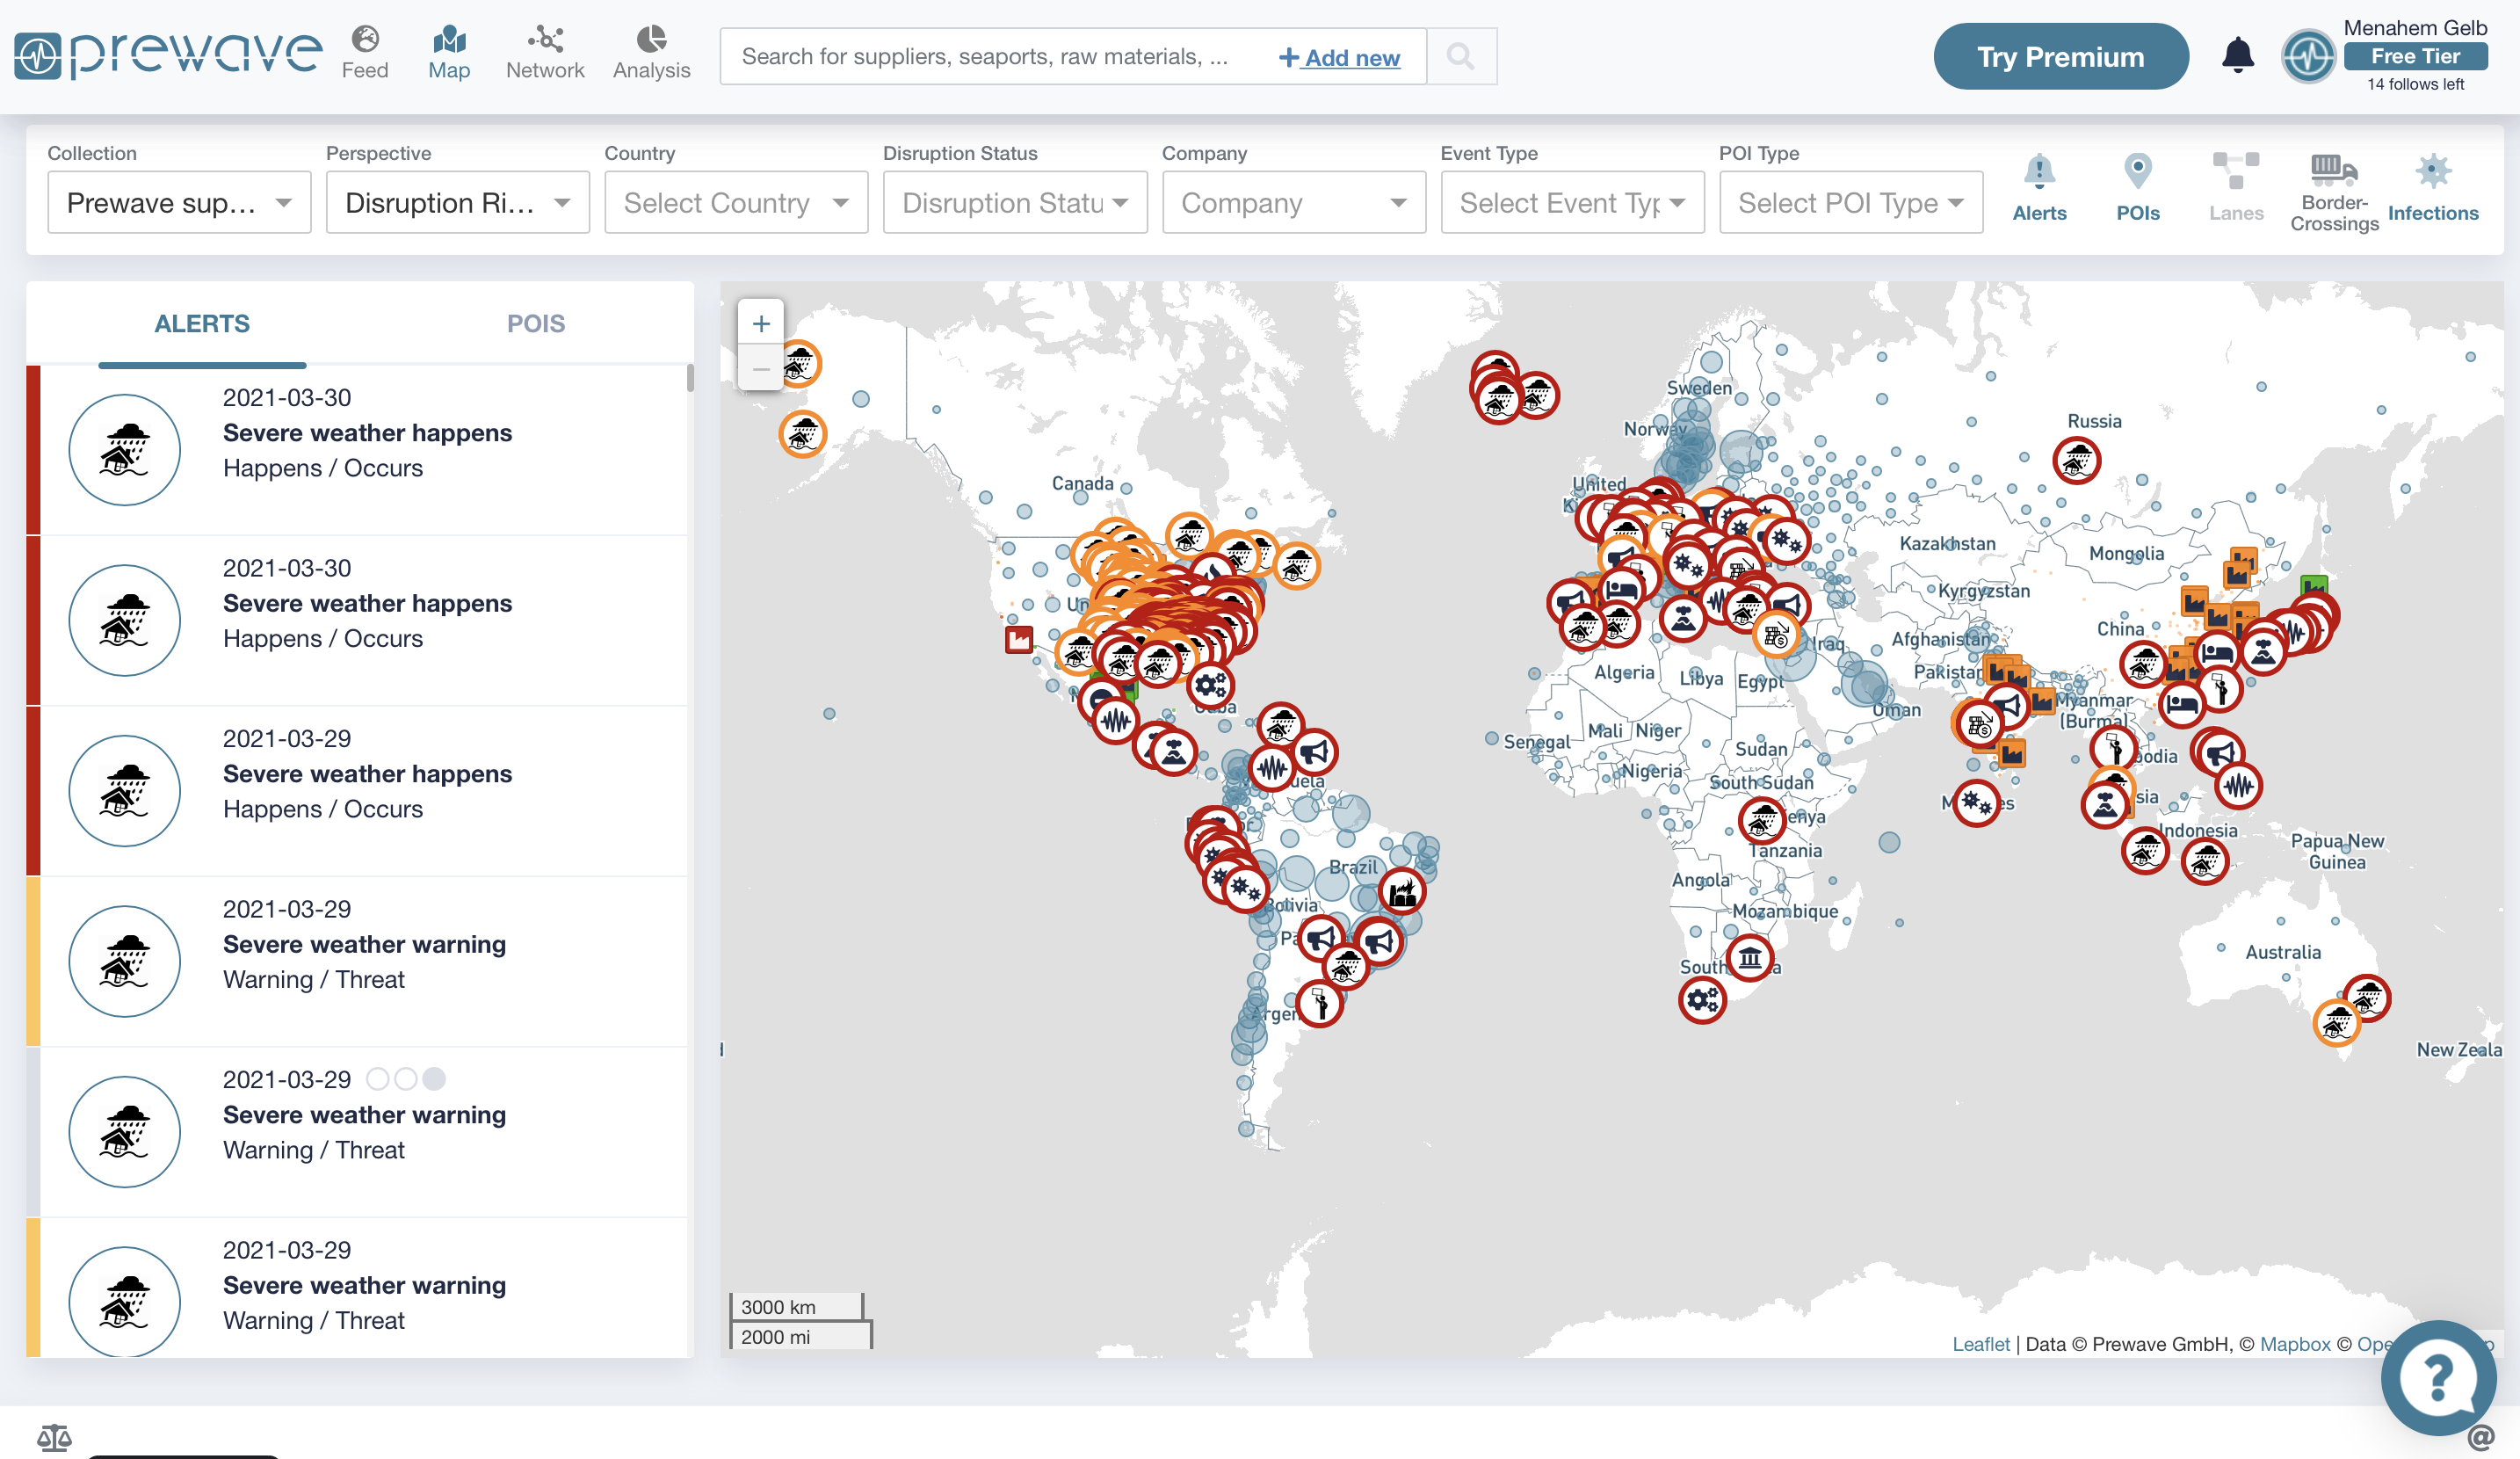  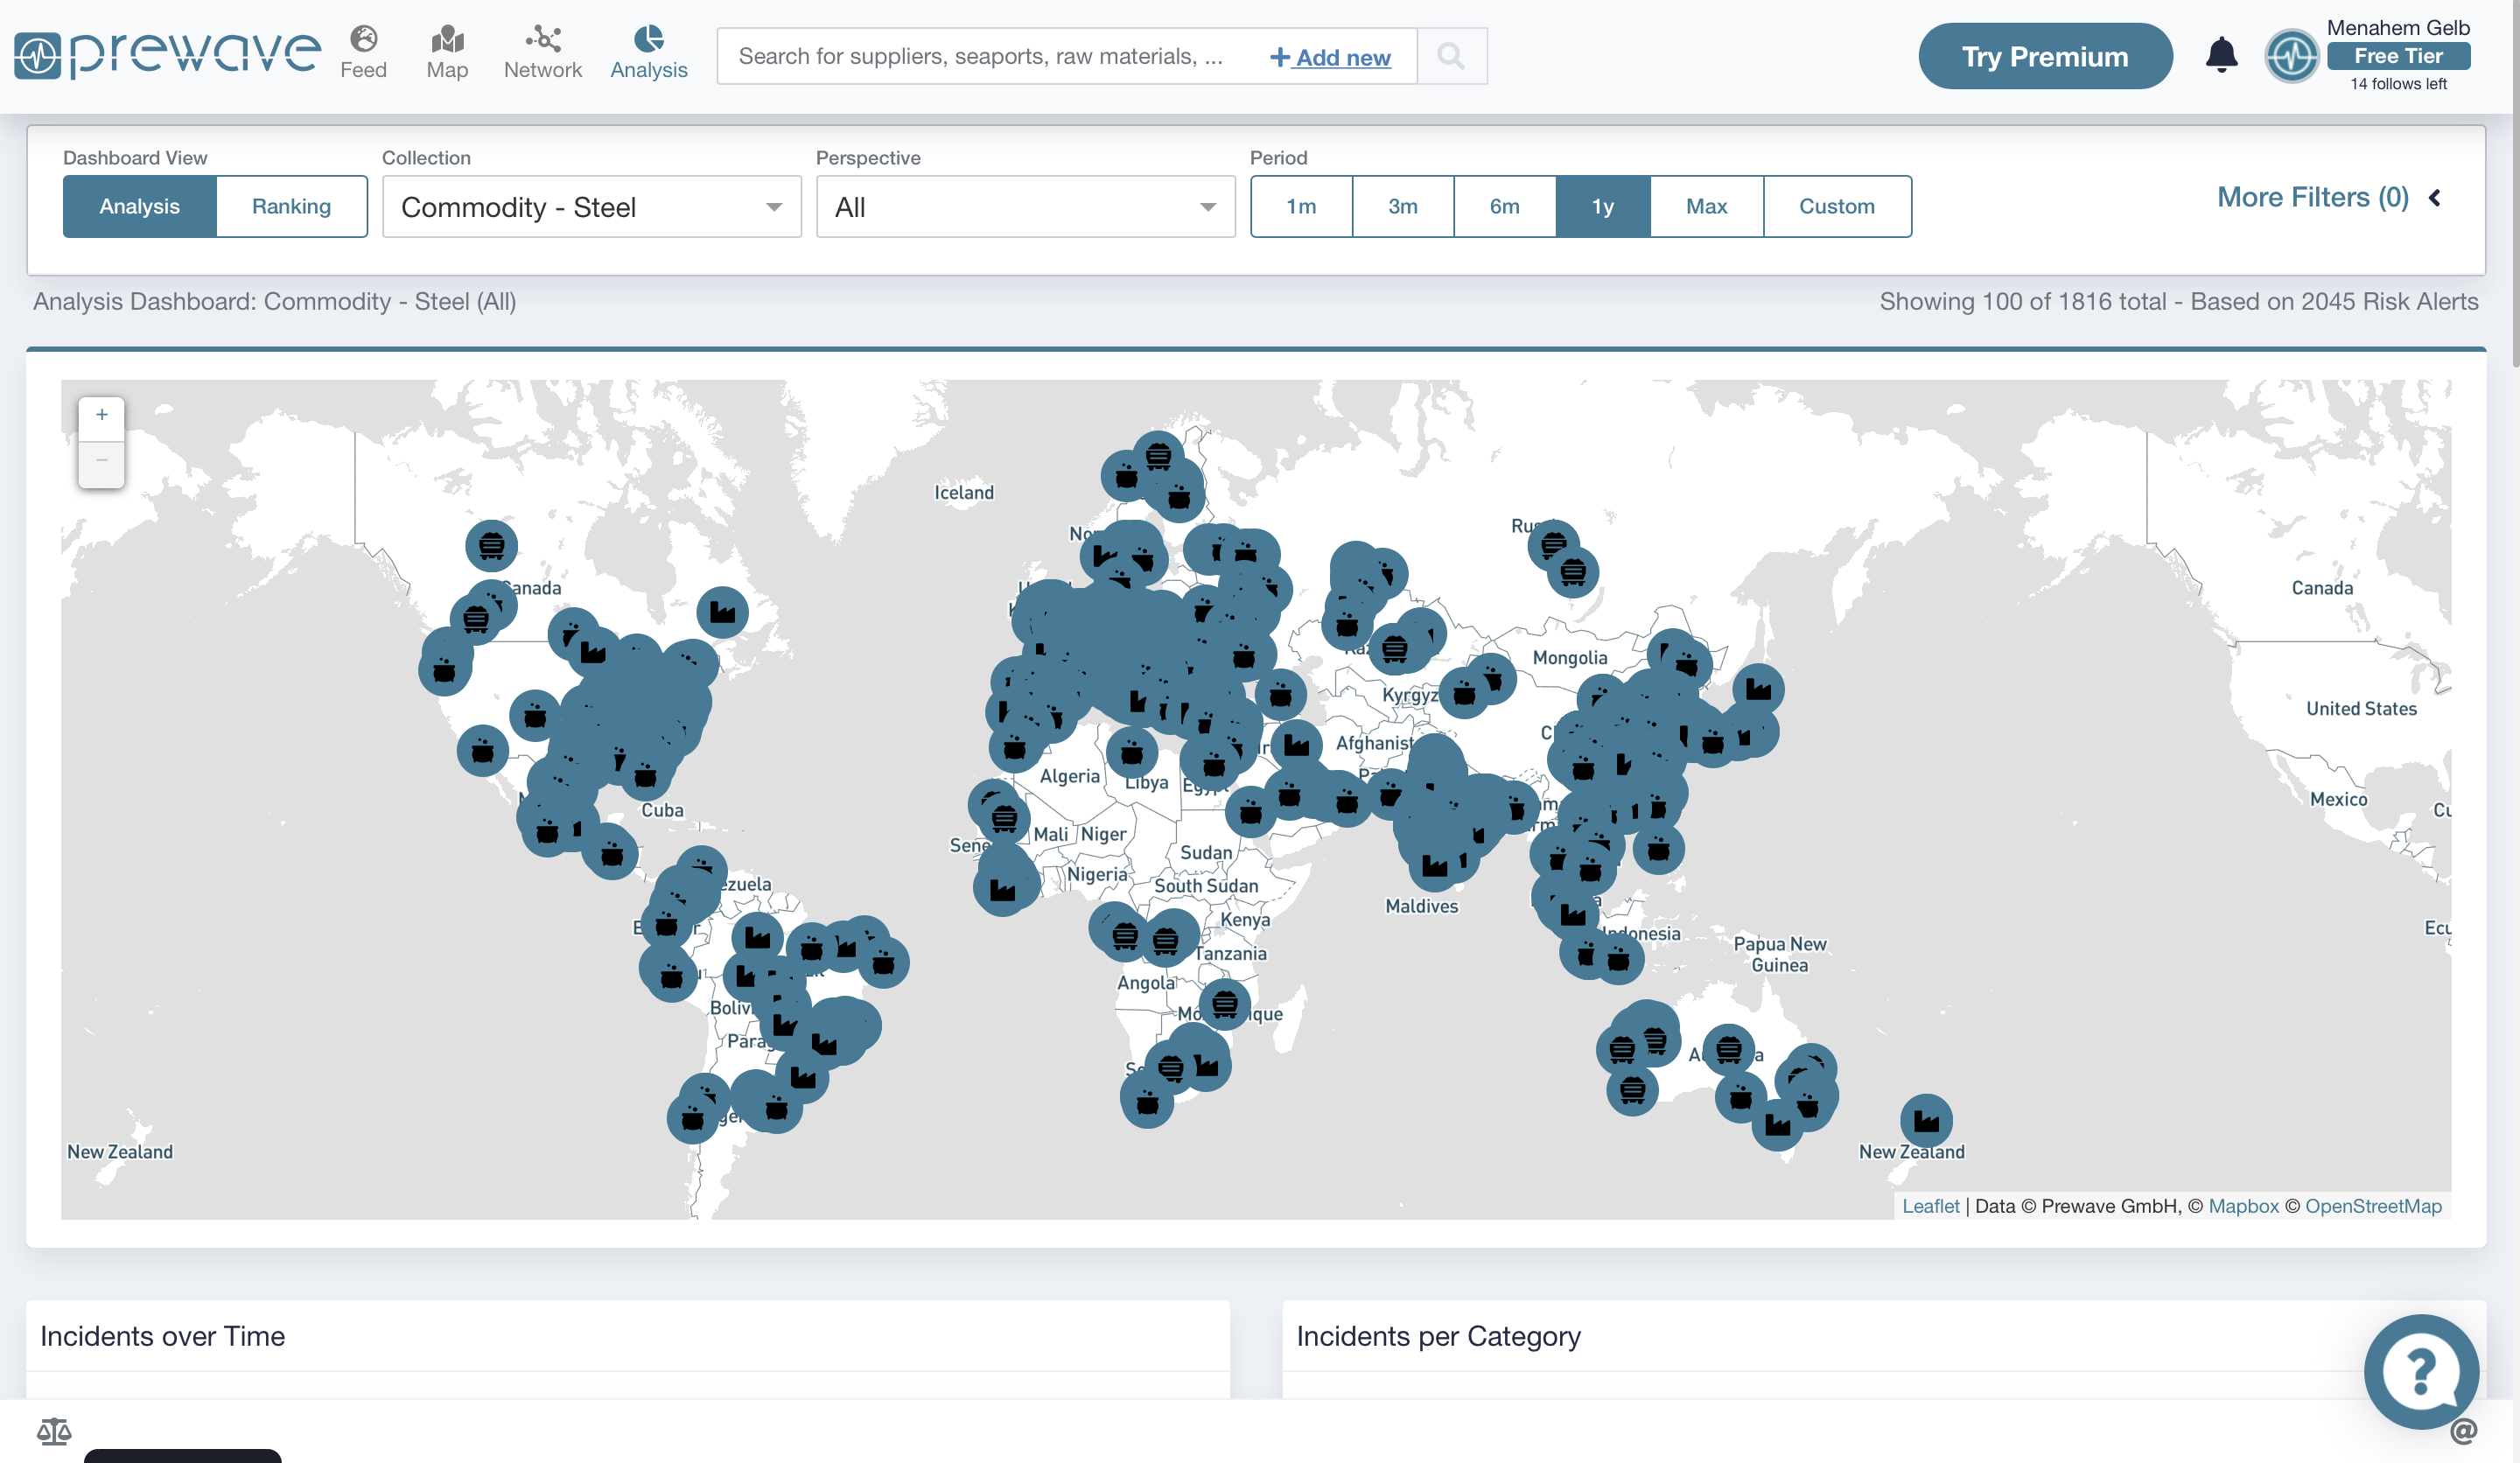  |